|
시장보고서
상품코드
1755366
음료 향료 시스템 시장 : 기회, 성장 촉진요인, 산업 동향 분석 및 예측(2025-2034년)Beverage Flavoring System Market Opportunity, Growth Drivers, Industry Trend Analysis, and Forecast 2025 - 2034 |
||||||
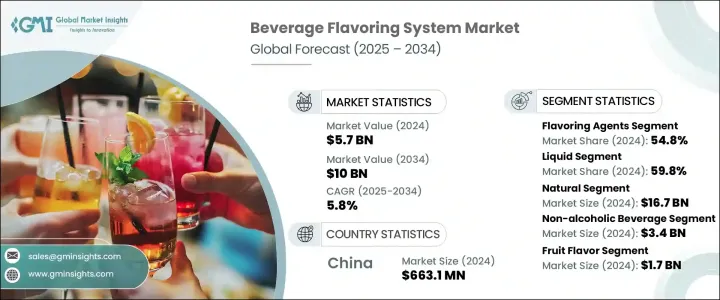
세계의 음료 향료 시스템 시장 규모는 2024년에 57억 달러로 평가되었고, 2034년에는 100억 달러에 이를 것으로 예측되며, CAGR 5.8%로 성장할 전망입니다.
이 시장은 진화하는 소비자 선호도, 혁신적인 기술, 음료 응용 분야의 다양화 등에 힘입어 역동적인 변화를 겪고 있습니다. 음료 제조업체들이 제품의 매력을 높이고 차별화를 도모하기 위해 노력함에 따라, 일관된 향료, 향, 시각적 효과를 제공하는 향료 시스템이 중요한 요소로 부상하고 있습니다. 청량 음료, 기능성 음료, 유제품 음료 등 음료 부문의 모든 카테고리는 시장 요구를 충족하기 위해 맞춤형 향료 시스템에 크게 의존하고 있습니다.
건강과 웰빙에 대한 소비자의 인식이 확대됨에 따라 천연 및 클린 라벨 향료 솔루션으로의 전환이 진행되고 있습니다. 식물성, 비유전자변형, 유기농 원료의 향료 성분이 선호되는 추세가 높아지면서 제조업체들은 식물 추출물, 에센셜 오일, 발효 유래 향료와 같은 천연 성분을 채택하고 있습니다. 이러한 성분은 현재의 건강 동향에 부합할 뿐만 아니라, 정보에 정통한 오늘날의 소비자들의 요구에 부응하는 명확한 라벨 표시를 지원합니다. 음료 향료 시스템 시장은 지속적인 혁신, 연구 개발 활동의 증가, 전 세계 향료 회사들 간의 경쟁 심화로 촉진되고 있습니다. 이러한 업체들은 음료 브랜드들과 전략적 협력 관계를 맺고 새로운 제형 기술을 활용하여 혼잡한 시장에서 돋보이는 독특한 향료 프로파일을 만들고 있습니다.
| 시장 범위 | |
|---|---|
| 시작 연도 | 2024년 |
| 예측 연도 | 2025년-2034년 |
| 시작 금액 | 57억 달러 |
| 예측 금액 | 100억 달러 |
| CAGR | 5.8% |
성분 유형별로 보면, 향료가 2024년에 54.8%의 압도적인 시장 점유율을 차지하며 부문을 주도했으며, 2034년까지 연평균 5.7%의 성장률을 보일 것으로 예상됩니다. 이 성분이 업계에서 확고한 위치를 차지하고 있는 이유는 음료의 감각적 특성을 형성하는 데 필수적인 역할을 하기 때문입니다. 이 첨가물은 독특한 향료 경험을 제공하며 소비자의 진정성 요구를 충족시키고 제품 정체성을 강화하는 데 필수적입니다. 새로운 자연스러운 향료 옵션에 대한 수요가 지속 증가함에 따라 향료 첨가물은 전통적 및 신흥 음료 형식 모두에서 광범위하게 적용되고 있습니다.
형태별로는 액체 형태가 2024년에 59.8%로 가장 큰 비중을 차지했으며, 5.7%의 CAGR로 모멘텀을 유지할 것으로 예상됩니다. 액체 향료 시스템의 성공은 주로 통합의 용이성, 제형에 대한 균일한 분포, 비용 효율성 덕분입니다. 이 제품의 적응성 덕분에 제조업체는 변화하는 향료 동향에 신속하게 대응하고, 생산 공정을 간소화하며, 운영 비용을 절감할 수 있습니다. 대량 생산이든 소량 생산이든, 액상 향료 시스템은 타의 추종을 불허하는 일관성과 가공 효율성을 제공합니다.
유래별로 구분하면 천연 향료 부문이 2024년에 167억 달러라는 상당한 가치를 기록하며 두각을 나타냈습니다. 이러한 우위는 건강을 중시하는 클린 라벨 음료의 인기가 높아지고 있음을 반영합니다. 소비자들이 합성 성분에 대해 점점 더 신중해짐에 따라 천연 향료는 투명성, 진정성, 건강에 대한 인식된 효능으로 인기를 얻고 있습니다. 음료 제조업체들은 웰빙을 중시하는 부문을 공략하기 위해 천연 성분을 강조한 제품으로 재구성하고 있습니다. 비용 및 원료 조달에 대한 어려움이 있지만, 천연 향료는 프리미엄 및 기능성 음료 부문에서 특히 선호되어 시장에서의 선도적 위치를 강화하고 있습니다.
음료 유형에 따르면, 무알코올 음료가 2024년에 34억 달러의 시장 규모를 차지하며 가장 큰 비중을 차지했습니다. 이 부문의 강력한 존재감은 높은 일일 소비율, 제품 다양성 및 광범위한 소비자층에 기인합니다. 수분 보충 제품에서 에너지 증진 제형에 이르기까지 무알코올 부문은 소비자의 관심을 유지하기 위해 지속적으로 혁신적인 향료 솔루션을 요구하고 있습니다. 반면, 시장 규모는 작지만 알코올 음료는 프리미엄 향료가 첨가된 알코올 음료에 대한 수요 증가에 힘입어 주목할 만한 성장을 보이고 있습니다.
향료 유형별로는 과일 향료가 2024년 17억 달러를 차지하며 시장을 주도했습니다. 과일 향료는 건강과의 자연스러운 연관성, 다양한 음료 유형과의 호환성, 비용 효율성으로 인해 계속해서 우위를 차지하고 있습니다. 과일 향료의 다용성은 단독 사용과 복잡한 블렌드 모두에 적합해, 독특하고 상쾌한 향료 경험을 제공하려는 제조업체들에게 인기입니다.
지역별로는 중국이 2024년 시장 가치 USD 6억 6,310만 달러로 아시아태평양 지역 음료 향료 시스템 시장을 주도하고 있으며, 2034년까지 연평균 성장률(CAGR) 5.6%로 성장할 것으로 전망됩니다. 중국의 대규모 소비자 기반, 도시화 확대, 향료 및 기능성 음료에 대한 수요 증가가 이 성장의 주요 요인입니다. 강력한 국내 제조 능력과 유리한 식품 안전 규제가 중국의 위치를 더욱 강화했습니다. 소비자의 수요가 건강에 좋고 풍미가 풍부한 음료로 계속 이동함에 따라 중국은 이 지역의 혁신과 생산의 중심지로서의 위치를 유지하고 있습니다.
세계의 음료 향료 시스템 공급업체들은 기술 전문 지식, 다양한 제품 라인, 광범위한 유통망을 활용하여 증가하는 수요를 활용하고 있습니다. 그들의 경쟁 우위는 빠른 적응력, 혁신에 대한 대규모 투자, 여러 지역에서 일관된 품질을 제공하는 능력에 있습니다.
목차
제1장 조사 방법
- 시장의 범위와 정의
- 조사 디자인
- 조사 접근
- 데이터 수집 방법
- 데이터 마이닝 소스
- 세계
- 지역/국가
- 기본 추정과 계산
- 기준연도 계산
- 시장 예측의 주요 동향
- 1차 조사와 검증
- 1차 정보
- 예측 모델
- 조사의 전제와 한계
제2장 주요 요약
제3장 업계 인사이트
- 생태계 분석
- 공급자의 상황
- 이익률
- 각 단계에서의 부가가치
- 밸류체인에 영향을 주는 요인
- 혁신
- 업계에 미치는 영향요인
- 성장 촉진요인
- 업계의 잠재적 위험 및 과제
- 시장 기회
- 성장 가능성 분석
- 규제 상황
- 북미
- 유럽
- 아시아태평양
- 라틴아메리카
- 중동 및 아프리카
- Porter's Five Forces 분석
- PESTEL 분석
- 가격 동향
- 지역별
- 제품별
- 장래 시장 동향
- 기술과 혁신의 상황
- 현재의 기술 동향
- 신흥기술
- 특허 상황
- 무역 통계(HS코드)(참고 : 무역 통계는 주요 국가에서만 제공됨)
- 주요 수입국
- 주요 수출국
- 지속가능성과 환경 측면
- 지속가능한 관행
- 폐기물 삭감 전략
- 생산에 있어서의 에너지 효율
- 환경 친화적인 노력
- 새로운 동향과 전망
- 기술 혁신
- 풍미 개발에서 AI와 머신러닝
- 고급 캡슐화 기술
- 향료 생산에서 생명 공학
- 소비자의 기호의 진화
- 클린 라벨 운동
- 기능성 향료
- 세계 각국의 이국적인 향료
- 건강과 웰빙 동향
- 설탕 감소 솔루션
- 면역력 강화 향료
- 적응성 및 노트로픽 향료
- 개인화 및 맞춤화
- 향료 산업의 디지털 전환
- 대체음료 카테고리와의 통합
- 식물 유래 음료
- 저알코올/무알코올 음료
- 기능성 음료
- 장래 시장 잠재력
- 투자 기회
- 기술 혁신
제4장 경쟁 구도
- 소개
- 기업의 시장 점유율 분석
- 지역별
- 북미
- 유럽
- 아시아태평양
- 라틴아메리카
- 중동 및 아프리카
- 지역별
- 기업 매트릭스 분석
- 주요 시장 기업의 경쟁 분석
- 경쟁 포지셔닝 매트릭스
- 주요 발전
- 합병과 인수
- 파트너십 및 협업
- 신제품 발매
- 확장 계획
제5장 시장 추계 및 예측 : 성분별(2021-2034년)
- 주요 경향
- 향료
- 천연 향료
- 과일 향료
- 식물 향료
- 향신료와 허브의 향료
- 견과류와 씨앗의 향료
- 기타
- 인공 향료
- 과일 모방 향료
- 닷맛 향료
- 짠맛 향료
- 기타
- 천연 동일 향료
- 천연 향료
- 향료 운반체
- 프로파일렌글리콜
- 에탄올
- 식물성 기름
- 기타
- 풍미 증강제
- 산미료
- 감미료
- 기타
- 풍미 조절제
제6장 시장 추계 및 예측 : 형태별(2021-2034년)
- 주요 경향
- 액체
- 에멀젼
- 용액
- 현탁액
- 건조
- 스프레이 건조
- 동결 건조
- 캡슐화
- 기타
제7장 시장 추계 및 예측 : 유래별(2021-2034년)
- 주요 경향
- 천연
- 식물 유래
- 동물 유래
- 인공
- 천연 동일
제8장 시장 추계 및 예측 : 음료 유형별(2021-2034년)
- 주요 경향
- 알코올 음료
- 맥주
- 와인
- 스피릿
- RTD(Ready-to-Drink) 알코올 음료
- 기타
- 무알코올 음료
- 탄산음료
- 주스와 넥타
- 에너지 음료
- 스포츠 음료
- RTD(Ready-to-Drink) 차 및 커피
- 향료 워터
- 유제품 기반 음료
- 식물 유래 음료
- 기타
제9장 시장 추계 및 예측 : 향료 유형별(2021-2034년)
- 주요 경향
- 과일 향료
- 베리
- 감귤류
- 트로피컬
- 핵과
- 기타
- 초콜릿과 바닐라
- 커피와 차
- 향신료와 허브
- 꽃향기
- 견과류와 씨앗의 향료
- 민트와 멘톨
- 달콤한 향료
- 짭짤한 향료
- 기타
제10장 시장 추계 및 예측 : 지역별(2021-2034년)
- 주요 동향
- 북미
- 미국
- 캐나다
- 유럽
- 독일
- 영국
- 프랑스
- 이탈리아
- 스페인
- 기타 유럽
- 아시아태평양
- 중국
- 인도
- 일본
- 호주
- 한국
- 기타 아시아태평양
- 라틴아메리카
- 브라질
- 멕시코
- 아르헨티나
- 기타 라틴아메리카
- 중동 및 아프리카
- 사우디아라비아
- 남아프리카
- 아랍에미리트(UAE)
- 기타 중동 및 아프리카
제11장 기업 프로파일
- Givaudan SA
- International Flavors &Fragrances Inc.(IFF)
- DSM
- Symrise AG
- Sensient Technologies Corporation
- Kerry Group plc
- Archer Daniels Midland Company(ADM)
- Tate &Lyle PLC
- Cargill, Incorporated
- MANE SA
- McCormick &Company, Inc.
- Takasago International Corporation
- T. Hasegawa Co., Ltd.
- Robertet Group
- Kalsec Inc.
The Global Beverage Flavoring System Market was valued at USD 5.7 billion in 2024 and is estimated to grow at a CAGR of 5.8% to reach USD 10 billion by 2034. This market is undergoing a dynamic transformation fueled by evolving consumer preferences, innovative technologies, and the increasing diversity of beverage applications. As beverage producers strive to enhance product appeal and differentiate offerings, flavor systems have emerged as a critical component in delivering consistent taste, aroma, and visual impact. Every category within the beverage sector-whether it's soft drinks, functional beverages, or dairy-based drinks-relies heavily on tailored flavoring systems to meet market demands.

There is an ongoing shift towards natural and clean-label flavoring solutions, reflecting broader consumer awareness around health and wellness. The rising preference for plant-based, non-GMO, and organically sourced flavor ingredients is encouraging manufacturers to adopt natural components like botanical infusions, essential oils, and fermentation-derived flavors. These elements not only align with current health trends but also support clearer labeling, which further resonates with today's informed consumers. The beverage flavoring system market is driven by constant innovation, increased R&D activity, and heightened competition among global flavor houses. These players are forming strategic collaborations with beverage brands and leveraging new formulation technologies to create unique flavor profiles that stand out in a crowded marketplace.
| Market Scope | |
|---|---|
| Start Year | 2024 |
| Forecast Year | 2025-2034 |
| Start Value | $5.7 Billion |
| Forecast Value | $10 Billion |
| CAGR | 5.8% |
By ingredient type, flavoring agents led the segment with a commanding 54.8% market share in 2024 and are projected to grow at a CAGR of 5.7% through 2034. Their stronghold in the industry stems from their essential role in shaping the sensory characteristics of beverages. These agents are integral to delivering signature taste experiences, meeting consumer demand for authenticity, and elevating product identity. As the appetite for novel and natural taste options continues to grow, flavoring agents are seeing widespread application across both conventional and emerging beverage formats.
In terms of form, liquid forms accounted for the largest share at 59.8% in 2024 and are anticipated to maintain momentum with a 5.7% CAGR. The success of liquid flavor systems is largely due to their ease of integration, uniform distribution in formulations, and cost-effectiveness. Their adaptability allows manufacturers to respond quickly to changing flavor trends, streamline production processes, and reduce operational costs. Whether it's large-scale manufacturing or small-batch production, liquid flavor systems offer unmatched consistency and processing efficiency.
When segmented by origin, the natural flavor segment stood out with a significant valuation of USD 16.7 billion in 2024. This dominance reflects the increasing popularity of health-forward, clean-label beverages. As consumers grow more cautious about synthetic ingredients, natural flavors have gained favor for their transparency, authenticity, and perceived health benefits. Beverage producers are reformulating products to emphasize natural claims, appealing to the wellness-oriented segment. Despite challenges around cost and raw material sourcing, natural flavors are particularly favored in premium and functional beverage categories, reinforcing their leading market position.
Based on beverage type, non-alcoholic drinks emerged as the largest contributor, holding a market size of USD 3.4 billion in 2024. The strong presence of this segment is attributed to high daily consumption rates, product variety, and a broad consumer base. From hydration products to energy-enhancing formulations, the non-alcoholic category consistently demands innovative flavor solutions to maintain consumer interest. On the other hand, alcoholic beverages, though smaller in market size, are witnessing notable growth fueled by rising demand for premium, flavored alcoholic drinks.
Regarding flavor types, fruit flavors led the category, accounting for USD 1.7 billion in 2024. These flavors continue to dominate due to their natural association with wellness, wide compatibility with various beverage types, and cost-efficiency. The versatility of fruit flavors allows for both standalone applications and complex blends, making them a favorite among manufacturers aiming to deliver unique and refreshing taste experiences.
Regionally, China leads the Asia Pacific beverage flavoring system market with a market value of USD 663.1 million in 2024 and is projected to grow at a CAGR of 5.6% through 2034. The country's large consumer base, urban expansion, and increasing appetite for flavored and functional drinks are fueling this growth. Strong domestic manufacturing capabilities and favorable food safety regulations have further strengthened China's position. As consumer demand continues to shift toward health-conscious and flavor-rich beverage options, China remains a central hub for innovation and production in the region.
Global flavor system providers are leveraging their technical expertise, diverse product lines, and expansive distribution networks to tap into the growing demand. Their competitive edge lies in their ability to adapt quickly, invest heavily in innovation, and offer consistent quality across multiple regions.
Table of Contents
Chapter 1 Methodology
- 1.1 Market scope and definition
- 1.2 Research design
- 1.2.1 Research approach
- 1.2.2 Data collection methods
- 1.3 Data mining sources
- 1.3.1 Global
- 1.3.2 Regional/Country
- 1.4 Base estimates and calculations
- 1.4.1 Base year calculation
- 1.4.2 Key trends for market estimation
- 1.5 Primary research and validation
- 1.5.1 Primary sources
- 1.6 Forecast model
- 1.7 Research assumptions and limitations
Chapter 2 Executive Summary
- 2.1 Industry 3600 synopsis
- 2.2 Key market trends
- 2.2.1 Regional
- 2.2.2 Ingredient type
- 2.2.3 Form
- 2.2.4 Origin
- 2.2.5 Beverage type
- 2.2.6 Flavor type
- 2.3 TAM Analysis, 2025-2034
- 2.4 CXO perspectives: Strategic imperatives
- 2.4.1 Executive decision points
- 2.4.2 Critical success factors
- 2.5 Future Outlook and Strategic Recommendations
Chapter 3 Industry Insights
- 3.1 Industry ecosystem analysis
- 3.1.1 Supplier landscape
- 3.1.2 Profit margin
- 3.1.3 Value addition at each stage
- 3.1.4 Factor affecting the value chain
- 3.1.5 Disruptions
- 3.2 Industry impact forces
- 3.2.1 Growth drivers
- 3.2.2 Industry pitfalls and challenges
- 3.2.3 Market opportunities
- 3.3 Growth potential analysis
- 3.4 Regulatory landscape
- 3.4.1 North America
- 3.4.2 Europe
- 3.4.3 Asia Pacific
- 3.4.4 Latin America
- 3.4.5 Middle East & Africa
- 3.5 Porter's analysis
- 3.6 PESTEL analysis
- 3.6.1 Technology and innovation landscape
- 3.6.2 Current technological trends
- 3.6.3 Emerging technologies
- 3.7 Price trends
- 3.7.1 By region
- 3.7.2 By product
- 3.8 Future market trends
- 3.9 Technology and Innovation landscape
- 3.9.1 Current technological trends
- 3.9.2 Emerging technologies
- 3.10 Patent Landscape
- 3.11 Trade statistics (HS code) ( Note: the trade statistics will be provided for key countries only )
- 3.11.1 Major importing countries
- 3.11.2 Major exporting countries
- 3.12 Sustainability and environmental aspects
- 3.12.1 Sustainable practices
- 3.12.2 Waste reduction strategies
- 3.12.3 Energy efficiency in production
- 3.12.4 Eco-friendly initiatives
- 3.13 Emerging trends and future outlook
- 3.13.1 Technological innovations
- 3.13.1.1 Ai and machine learning in flavor development
- 3.13.1.2 Advanced encapsulation technologies
- 3.13.1.3 Biotechnology in flavor production
- 3.13.2 Consumer preference evolution
- 3.13.2.1 Clean label movement
- 3.13.2.2 Functional flavors
- 3.13.2.3 Global and exotic flavor profiles
- 3.13.3 Health and wellness trends
- 3.13.4 Sugar reduction solutions
- 3.13.5 Immunity-boosting flavors
- 3.13.6 Adaptogenic and nootropic flavors
- 3.13.7 Personalization and customization
- 3.13.8 Digital transformation in flavor industry
- 3.13.9 Integration with alternative beverage categories
- 3.13.9.1 Plant-based beverages
- 3.13.9.2 Low/no-alcohol beverages
- 3.13.9.3 Functional beverages
- 3.13.10 Future market potential
- 3.13.11 Investment opportunities
- 3.13.1 Technological innovations
Chapter 4 Competitive Landscape, 2024
- 4.1 Introduction
- 4.2 Company market share analysis
- 4.2.1 By region
- 4.2.1.1 North America
- 4.2.1.2 Europe
- 4.2.1.3 Asia Pacific
- 4.2.1.4 LATAM
- 4.2.1.5 MEA
- 4.2.1 By region
- 4.3 Company matrix analysis
- 4.4 Competitive analysis of major market players
- 4.5 Competitive positioning matrix
- 4.6 Key developments
- 4.6.1 Mergers & acquisitions
- 4.6.2 Partnerships & collaborations
- 4.6.3 New product launches
- 4.6.4 Expansion plans
Chapter 5 Market Estimates & Forecast, By Ingredient Type, 2021 - 2034 (USD Million) (Kilo Tons)
- 5.1 Key trend
- 5.2 Flavoring agents
- 5.2.1 Natural flavors
- 5.2.1.1 Fruit flavors
- 5.2.1.2 Botanical flavors
- 5.2.1.3 Spice and herb flavors
- 5.2.1.4 Nut and seed flavors
- 5.2.1.5 Others
- 5.2.2 Artificial flavors
- 5.2.2.1 Fruit mimics
- 5.2.2.2 Sweet flavors
- 5.2.2.3 Savory flavors
- 5.2.2.4 Others
- 5.2.3 Nature-identical flavors
- 5.2.1 Natural flavors
- 5.3 Flavor carriers
- 5.3.1 Propylene glycol
- 5.3.2 Ethanol
- 5.3.3 Vegetable oils
- 5.3.4 Others
- 5.4 Flavor enhancers
- 5.4.1 Acidulants
- 5.4.2 Sweeteners
- 5.4.3 Others
- 5.5 Flavor modifiers
Chapter 6 Market Estimates & Forecast, By Form, 2021 - 2034 (USD Million) (Kilo Tons)
- 6.1 Key trend
- 6.2 Liquid
- 6.2.1 Emulsions
- 6.2.2 Solutions
- 6.2.3 Suspensions
- 6.3 Dry
- 6.3.1 Spray-dried
- 6.3.2 Freeze-dried
- 6.3.3 Encapsulated
- 6.3.4 Others
Chapter 7 Market Estimates & Forecast, By Origin, 2021 - 2034 (USD Million) (Kilo Tons)
- 7.1 Key trend
- 7.2 Natural
- 7.2.1 Plant-based
- 7.2.2 Animal-derived
- 7.3 Artificial
- 7.4 Nature-identical
Chapter 8 Market Estimates & Forecast, By Beverage Type, 2021 - 2034 (USD Million) (Kilo Tons)
- 8.1 Key trend
- 8.2 Alcoholic beverages
- 8.2.1 Beer
- 8.2.2 Wine
- 8.2.3 Spirits
- 8.2.4 Ready-to-Drink (RTD) alcoholic beverages
- 8.2.5 Others
- 8.3 Non-alcoholic beverages
- 8.3.1 Carbonated soft drinks
- 8.3.2 Juices and nectars
- 8.3.3 Energy drinks
- 8.3.4 Sports drinks
- 8.3.5 Ready-to-Drink (RTD) tea and coffee
- 8.3.6 Flavored water
- 8.3.7 Dairy-based beverages
- 8.3.8 Plant-based beverages
- 8.3.9 Others
Chapter 9 Market Estimates & Forecast, By Flavor Type, 2021 - 2034 (USD Million) (Kilo Tons)
- 9.1 Key trend
- 9.2 Fruit flavors
- 9.2.1 Berries
- 9.2.2 Citrus
- 9.2.3 Tropical
- 9.2.4 Stone fruits
- 9.2.5 Others
- 9.3 Chocolate and vanilla
- 9.4 Coffee and tea
- 9.5 Spices and herbs
- 9.6 Floral flavors
- 9.7 Nut and seed flavors
- 9.8 Mint and menthol
- 9.9 Sweet flavors
- 9.10 Savory flavors
- 9.11 Others
Chapter 10 Market Estimates & Forecast, By Region, 2021 - 2034 (USD Million) (Kilo Tons)
- 10.1 Key trends
- 10.2 North America
- 10.2.1 U.S.
- 10.2.2 Canada
- 10.3 Europe
- 10.3.1 Germany
- 10.3.2 UK
- 10.3.3 France
- 10.3.4 Italy
- 10.3.5 Spain
- 10.3.6 Rest of Europe
- 10.4 Asia Pacific
- 10.4.1 China
- 10.4.2 India
- 10.4.3 Japan
- 10.4.4 Australia
- 10.4.5 South Korea
- 10.4.6 Rest of Asia Pacific
- 10.5 Latin America
- 10.5.1 Brazil
- 10.5.2 Mexico
- 10.5.3 Argentina
- 10.5.4 Rest of Latin America
- 10.6 Middle East & Africa
- 10.6.1 Saudi Arabia
- 10.6.2 South Africa
- 10.6.3 UAE
- 10.6.4 Rest of Middle East & Africa
Chapter 11 Company Profiles
- 11.1 Givaudan SA
- 11.2 International Flavors & Fragrances Inc. (IFF)
- 11.3 DSM
- 11.4 Symrise AG
- 11.5 Sensient Technologies Corporation
- 11.6 Kerry Group plc
- 11.7 Archer Daniels Midland Company (ADM)
- 11.8 Tate & Lyle PLC
- 11.9 Cargill, Incorporated
- 11.10 MANE SA
- 11.11 McCormick & Company, Inc.
- 11.12 Takasago International Corporation
- 11.13 T. Hasegawa Co., Ltd.
- 11.14 Robertet Group
- 11.15 Kalsec Inc.