
|
시장보고서
상품코드
1913345
우유 단백질 시장 : 시장 기회, 성장 요인, 산업 동향 분석 및 예측(2026-2035년)Milk Protein Market Opportunity, Growth Drivers, Industry Trend Analysis, and Forecast 2026 - 2035 |
||||||
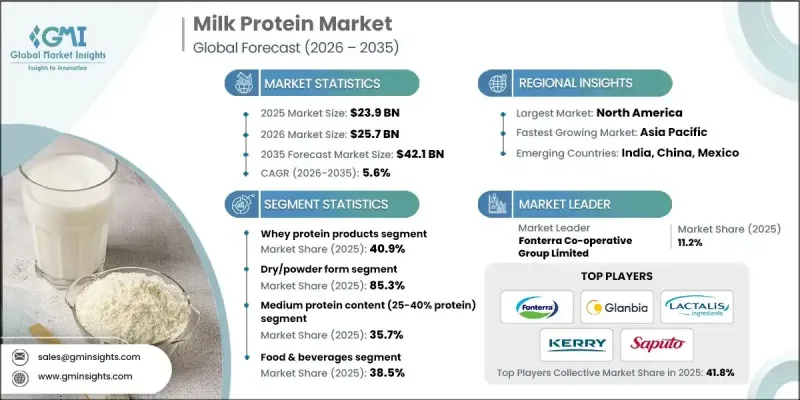
세계의 우유 단백질 시장은 2025년에 239억 달러로 평가되었고, 2035년까지 연평균 복합 성장률(CAGR) 5.6%로 성장할 전망이며, 421억 달러에 이를 것으로 예측됩니다.

우유 단백질은 우수한 영양 프로파일 및 기능성을 바탕으로 원료로서의 지위를 유지하며, 영양 중시 제품 카테고리 전체에서 널리 평가되고 있습니다. 소비자의 균형 잡힌 식단, 활성 라이프 스타일, 종합적인 건강에 대한 관심이 높아짐에 따라 단백질 강화 식품 및 음료에 대한 관심이 크게 증가하고 있습니다. 이 변화로 인해 영양가와 기능성을 모두 찾는 제조업체에게 우유 단백질이 선호 원료로 자리를 잡았습니다. 영양면에서의 이점 외에도 우유 단백질은 식감, 점성, 제품 안정성을 향상시켜 배합 효율 향상에도 기여합니다. 깨끗한 라벨 및 천연 유래 원료에 대한 선호도 증가는 우유 단백질에 대한 소비자의 신뢰를 더욱 견고하게 만듭니다. 동시에, 가공 기술의 지속적인 발전으로 여과 및 분리 방법이 개선되고 흡수성과 실용성이 우수한 고품질 제품이 만들어졌습니다. 이러한 개선으로 생산자는 진화하는 영양 요구와 특정 건강 지향 소비 패턴에 따라 우유 단백질 솔루션을 제공할 수 있게 되었습니다.
| 시장 범위 | |
|---|---|
| 시작 연도 | 2025년 |
| 예측 연도 | 2026-2035년 |
| 시작 시 가치 | 239억 달러 |
| 예측 금액 | 421억 달러 |
| CAGR | 5.6% |
건조 및 분말 형태의 부문은 2025년에 85.3%의 점유율을 차지하였고, 2026-2035년 CAGR 6.3%로 성장할 것으로 예측됩니다. 이 형태는 장기 보존성, 수송의 용이성, 폭넓은 식품 및 영양 용도에 대한 적응성으로부터 널리 채용되고 있습니다. 그 안정성 및 제형의 유연성은 대규모 제조에서 선호되는 선택입니다.
액체 및 농축 우유 단백질 형태에 대한 수요는 꾸준히 증가하고 있으며, 특히 부드러운 식감 및 신속한 용해성이 강조되는 분야에서 두드러집니다. 소비자의 편의성에 중점을 둔 영양 수요가 증가함에 따라, 이러한 형태는 음료 및 유제품 베이스 제형에 더 강한 지지를 얻고 있습니다.
중농도(40%-70%)의 우유 단백질은 2025년에 35.7%의 점유율을 차지했으며, 2035년까지 연평균 복합 성장률(CAGR) 5.4%로 성장이 전망되고 있습니다. 비용 효율성 및 기능성의 균형이 뛰어난 본 카테고리는 영양 중시 제품 라인에서 광범위한 채용을 지원하고 매력적인 선택입니다.
북미의 우유 단백질 시장은 2025년 32%의 점유율을 차지했습니다. 이 지역은 단백질이 풍부하고 최소한의 가공을 한 제품에 대한 소비자의 강한 관심 및 확립된 제조 인프라의 혜택을 받고 있습니다. 깊은 뿌리를 둔 건강 지향 문화는 영양 지향 식품 및 식품 부문 전체에서 혁신을 추진하고 있습니다.
자주 묻는 질문
목차
제1장 조사 방법 및 범위
제2장 주요 요약
제3장 업계 인사이트
- 생태계 분석
- 공급자의 상황
- 이익률
- 각 단계에서의 부가가치
- 밸류체인에 영향을 주는 요인
- 혁신
- 업계에 미치는 영향요인
- 성장 촉진요인
- 높아지는 건강 및 웰니스에 대한 의식
- 성장을 계속하는 스포츠 액티브 영양 시장
- 식품에 있어서의 단백질 강화 증가
- 업계의 잠재적 위험 및 과제
- 원유 가격의 변동성
- 유당 불내증 및 유제품 알레르기
- 시장 기회
- 생물 활성 단백질의 용도 확대
- 개인화된 영양 제품 개발
- 성장 촉진요인
- 성장 가능성 분석
- 규제 상황
- 북미
- 유럽
- 아시아태평양
- 라틴아메리카
- 중동 및 아프리카
- Porter's Five Forces 분석
- PESTEL 분석
- 가격 동향
- 지역별
- 제품 유형별
- 향후 시장 동향
- 기술 및 혁신 동향
- 현재 기술 동향
- 신흥 기술
- 특허 상황
- 무역 통계(HS코드)
(참고 : 무역 통계는 주요 국가에서만 제공됩니다)
- 주요 수입국
- 주요 수출국
- 지속가능성 및 환경면
- 지속가능한 대처
- 폐기물 감축 전략
- 생산에 있어서 에너지 효율
- 환경에 배려한 대처
- 탄소발자국 고려
제4장 경쟁 구도
- 서문
- 기업의 시장 점유율 분석
- 지역별
- 북미
- 유럽
- 아시아태평양
- 라틴아메리카
- 중동 및 아프리카
- 지역별
- 기업 매트릭스 분석
- 주요 시장 기업의 경쟁 분석
- 경쟁 포지셔닝 매트릭스
- 주요 발전
- 합병 및 인수
- 제휴 및 협업
- 신제품 발매
- 사업 확대 계획
제5장 시장 추계 및 예측 : 제품 유형별(2022-2035년)
- 카제인 제품
- 산 카제인
- 렌넷 카제인
- 카세인 나트륨
- 카제인 칼슘
- 미셀상 카제인
- 유청 단백질 제품
- 유청 단백질 콘센트레이트(WPC)
- 유청 단백질 아이솔레이트(WPI)-단백질 함량 90% 이상
- 유청 단백질 가수분해물(WPH)
- 네이티브 유청 단백질
- 우유 단백질 농축물 및 분리물
- 우유 단백질 농축물(MPC 40-85%)
- 우유 단백질 분리물(MPI 85-90%)
- 전우유 단백질
- 특수 단백질 제품
- 생물활성 단백질(락토페린, 면역글로불린)
- 가수분해 우유 단백질
- 유기 우유 단백질
제6장 시장 추계 및 예측 : 형태별(2022-2035년)
- 건조 및 분말 형태
- 액체 및 농축 형태
- 특수 형태
- 단백질 크리스프 및 압출 성형품
- 마이크로 캡슐화 단백질
- 레디 투 믹스 블렌드
제7장 시장 추계 및 예측 : 단백질 함유 레벨별(2022-2035년)
- 저단백질 함량(25-40% 단백질)
- 중단백질(40-70%)
- 고단백질(70-85%)
- 초고단백질(85% 초과)
제8장 시장 추계 및 예측 : 용도별(2022-2035년)
- 음식
- 영양보조식품
- 스포츠 영양
- 유아용 조제 분유
- 임상영양
- 화장품 및 퍼스널케어
- 동물용 영양
제9장 시장 추계 및 예측 : 유통 채널별(2022-2035년)
- B2B 직접 판매(원료 공급)
- B2C 소매 채널
- 전문점 및 건강 식품 소매점
- 슈퍼마켓 및 하이퍼마켓
- 편의점
- 온라인 및 전자상거래 채널
- 브랜드 직영 웹사이트
- 온라인 마켓플레이스(Amazon, Alibaba)
- 정기 구입 모델
- 외식 산업용 채널
- 레스토랑 및 패스트푸드점
- 카페 및 주스바
- 기관용 푸드 서비스
- 약국 및 의료기관용 채널
- 병원 약국
- 소매 약국
- 의료용 영양 식품 도매업체
제10장 시장 추계 및 예측 : 지역별(2022-2035년)
- 북미
- 미국
- 캐나다
- 유럽
- 독일
- 영국
- 프랑스
- 스페인
- 이탈리아
- 기타 유럽
- 아시아태평양
- 중국
- 인도
- 일본
- 호주
- 한국
- 기타 아시아태평양
- 라틴아메리카
- 브라질
- 멕시코
- 아르헨티나
- 기타 라틴아메리카
- 중동 및 아프리카
- 사우디아라비아
- 남아프리카
- 아랍에미리트(UAE)
- 기타 중동 및 아프리카
제11장 기업 프로파일
- Fonterra Co-operative Group Limited
- Glanbia plc
- Lactalis Ingredients
- Kerry Group plc
- Saputo Inc.
- Arla Foods amba
- Royal FrieslandCampina NV
- Nestle SA(Nutrition &Health Science)
- Hilmar Ingredients
- Milk Specialties Global
- Agropur Cooperative
- Carbery Group
- Glanbia Performance Nutrition(Optimum Nutrition Brand)
- Idaho Milk Products
- Arla Foods Ingredients Group P/S
The Global Milk Protein Market was valued at USD 23.9 billion in 2025 and is estimated to grow at a CAGR of 5.6% to reach USD 42.1 billion by 2035.
Milk protein remains a foundational ingredient due to its strong nutritional profile and functional performance, making it widely valued across nutrition-driven product categories. Rising consumer focus on balanced diets, active lifestyles, and overall wellness has significantly increased interest in protein-enriched foods and beverages. This shift has positioned milk protein as a preferred ingredient for manufacturers seeking both nutritional value and functional performance. Beyond its dietary benefits, milk protein supports formulation efficiency by enhancing texture, consistency, and product stability. Growing preference for clean-label and naturally sourced ingredients has further strengthened consumer trust in milk-derived proteins. At the same time, ongoing advancements in processing technologies have enabled improved filtration and separation methods, resulting in higher-quality products with better absorption and usability. These improvements allow producers to tailor milk protein solutions to meet evolving nutritional expectations and specific health-focused consumption patterns.
| Market Scope | |
|---|---|
| Start Year | 2025 |
| Forecast Year | 2026-2035 |
| Start Value | $23.9 Billion |
| Forecast Value | $42.1 Billion |
| CAGR | 5.6% |
The dry or powder form segment accounted for 85.3% share in 2025 and is projected to grow at a CAGR of 6.3% from 2026 to 2035. This format is widely adopted due to its long shelf life, ease of transportation, and adaptability across a broad range of food and nutrition applications. Its stability and formulation flexibility continue to make it a preferred option for large-scale manufacturing.
Demand for liquid and concentrated milk protein formats is steadily increasing, particularly where smooth texture and rapid solubility are prioritized. These formats are gaining stronger acceptance across beverage and dairy-based formulations as consumer demand for convenience-driven nutrition rises.
Milk proteins with medium concentration levels ranging from 40% to 70% captured 35.7% share in 2025 and is anticipated to grow at a CAGR of 5.4% through 2035. This category remains attractive due to its balance between cost efficiency and functional performance, supporting widespread adoption across nutrition-focused product lines.
North America Milk Protein Market held a 32% share in 2025. The region benefits from strong consumer interest in protein-rich, minimally processed products and from well-established manufacturing infrastructure. A deeply rooted wellness culture continues to drive innovation across nutrition-oriented food and beverage segments.
Key companies operating in the Milk Protein Market include Kerry Group plc, Arla Foods Ingredients Group P/S, Royal FrieslandCampina N.V., Glanbia plc, Hilmar Ingredients, Nestle S.A. (Nutrition & Health Science), Agropur Cooperative, Lactalis Ingredients, Idaho Milk Products, Saputo Inc., Milk Specialties Global, Fonterra Co-operative Group Limited, Carbery Group, Arla Foods amba, and Glanbia Performance Nutrition under the Optimum Nutrition brand. Companies in the Milk Protein Market are reinforcing their market position through innovation, capacity expansion, and portfolio diversification. Many players are investing in advanced processing technologies to enhance product purity, consistency, and functional performance. Strategic partnerships with food and beverage manufacturers are being used to expand application reach and accelerate product adoption.
Table of Contents
Chapter 1 Methodology & Scope
- 1.1 Market scope and definition
- 1.2 Research design
- 1.2.1 Research approach
- 1.2.2 Data collection methods
- 1.3 Data mining sources
- 1.3.1 Global
- 1.3.2 Regional/Country
- 1.4 Base estimates and calculations
- 1.4.1 Base year calculation
- 1.4.2 Key trends for market estimation
- 1.5 Primary research and validation
- 1.5.1 Primary sources
- 1.6 Forecast model
- 1.7 Research assumptions and limitations
Chapter 2 Executive Summary
- 2.1 Industry 360° synopsis
- 2.2 Key market trends
- 2.2.1 Regional
- 2.2.2 Product Type
- 2.2.3 Form
- 2.2.4 Protein Content Level
- 2.2.5 Application
- 2.2.6 Distribution Channel
- 2.3 TAM Analysis, 2025-2035
- 2.4 CXO perspectives: Strategic imperatives
- 2.4.1 Executive decision points
- 2.4.2 Critical success factors
- 2.5 Future Outlook and Strategic Recommendations
Chapter 3 Industry Insights
- 3.1 Industry ecosystem analysis
- 3.1.1 Supplier landscape
- 3.1.2 Profit margin
- 3.1.3 Value addition at each stage
- 3.1.4 Factor affecting the value chain
- 3.1.5 Disruptions
- 3.2 Industry impact forces
- 3.2.1 Growth drivers
- 3.2.1.1 Rising health & wellness consciousness
- 3.2.1.2 Growing sports & active nutrition market
- 3.2.1.3 Increasing protein fortification in foods
- 3.2.2 Industry pitfalls and challenges
- 3.2.2.1 Raw milk price volatility
- 3.2.2.2 Lactose intolerance & dairy allergies
- 3.2.3 Market opportunities
- 3.2.3.1 Bioactive protein applications expansion
- 3.2.3.2 Personalized nutrition product development
- 3.2.1 Growth drivers
- 3.3 Growth potential analysis
- 3.4 Regulatory landscape
- 3.4.1 North America
- 3.4.2 Europe
- 3.4.3 Asia Pacific
- 3.4.4 Latin America
- 3.4.5 Middle East & Africa
- 3.5 Porter's analysis
- 3.6 PESTEL analysis
- 3.7 Price trends
- 3.7.1 By region
- 3.7.2 By product type
- 3.8 Future market trends
- 3.9 Technology and Innovation landscape
- 3.9.1 Current technological trends
- 3.9.2 Emerging technologies
- 3.10 Patent Landscape
- 3.11 Trade statistics (HS code)
( Note: The trade statistics will be provided for key countries only)
- 3.11.1 Major importing countries
- 3.11.2 Major exporting countries
- 3.12 Sustainability and environmental aspects
- 3.12.1 Sustainable practices
- 3.12.2 Waste reduction strategies
- 3.12.3 Energy efficiency in production
- 3.12.4 Eco-friendly initiatives
- 3.13 Carbon footprint consideration
Chapter 4 Competitive Landscape, 2025
- 4.1 Introduction
- 4.2 Company market share analysis
- 4.2.1 By region
- 4.2.1.1 North America
- 4.2.1.2 Europe
- 4.2.1.3 Asia Pacific
- 4.2.1.4 LATAM
- 4.2.1.5 MEA
- 4.2.1 By region
- 4.3 Company matrix analysis
- 4.4 Competitive analysis of major market players
- 4.5 Competitive positioning matrix
- 4.6 Key developments
- 4.6.1 Mergers & acquisitions
- 4.6.2 Partnerships & collaborations
- 4.6.3 New Product Launches
- 4.6.4 Expansion Plans
Chapter 5 Market Estimates and Forecast, By Product Type, 2022-2035 (USD Billion) (Kilo Tons)
- 5.1 Key trends
- 5.2 Casein products
- 5.2.1 Acid casein
- 5.2.2 Rennet casein
- 5.2.3 Sodium caseinate
- 5.2.4 Calcium caseinate
- 5.2.5 Micellar casein
- 5.3 Whey protein products
- 5.3.1 Whey protein concentrate (WPC)
- 5.3.2 Whey protein isolate (WPI) - >90% protein
- 5.3.3 Whey protein hydrolysate (WPH)
- 5.3.4 Native whey protein
- 5.4 Milk protein concentrates & isolates
- 5.4.1 Milk protein concentrate (MPC 40-85%)
- 5.4.2 Milk protein isolate (MPI 85-90%)
- 5.4.3 Total milk protein
- 5.5 Specialty protein products
- 5.5.1 Bioactive proteins (lactoferrin, immunoglobulins)
- 5.5.2 Hydrolyzed milk proteins
- 5.5.3 Organic milk proteins
Chapter 6 Market Estimates and Forecast, By Form, 2022-2035 (USD Billion) (Kilo Tons)
- 6.1 Key trends
- 6.2 Dry/powder form
- 6.3 Liquid/concentrated form
- 6.4 Specialty forms
- 6.4.1 Protein crisps & extrudates
- 6.4.2 Micro-encapsulated proteins
- 6.4.3 Ready-to-mix blends
Chapter 7 Market Estimates and Forecast, By Protein Content Level, 2022-2035 (USD Billion) (Kilo Tons)
- 7.1 Key trends
- 7.2 Low Protein Content (25-40% Protein)
- 7.3 Medium Protein (40-70%)
- 7.4 High Protein (70-85%)
- 7.5 Ultra-High Protein (>85%)
Chapter 8 Market Estimates and Forecast, By Application, 2022-2035 (USD Billion) (Kilo Tons)
- 8.1 Key trends
- 8.2 Food & Beverages
- 8.3 Dietary Supplements
- 8.4 Sports Nutrition
- 8.5 Infant Formula
- 8.6 Clinical Nutrition
- 8.7 Cosmetics & Personal Care
- 8.8 Animal Nutrition
Chapter 9 Market Estimates and Forecast, By Distribution Channel, 2022-2035 (USD Billion) (Kilo Tons)
- 9.1 Key trends
- 9.2 B2B direct sales (ingredient supply)
- 9.3 B2C retail channels
- 9.3.1 Specialty stores & health food retailers
- 9.3.2 Supermarkets & hypermarkets
- 9.3.3 Convenience stores
- 9.4 Online/e-commerce channels
- 9.4.1 Brand direct websites
- 9.4.2 Online marketplaces (amazon, Alibaba)
- 9.4.3 Subscription models
- 9.5 Food service channels
- 9.5.1 Restaurants & quick service
- 9.5.2 Cafes & juice bars
- 9.5.3 Institutional food service
- 9.6 Pharmacy & medical channels
- 9.6.1 Hospital pharmacies
- 9.6.2 Retail pharmacies
- 9.6.3 Medical nutrition distributors
Chapter 10 Market Estimates and Forecast, By Region, 2022-2035 (USD Billion) (Kilo Tons)
- 10.1 Key trends
- 10.2 North America
- 10.2.1 U.S.
- 10.2.2 Canada
- 10.3 Europe
- 10.3.1 Germany
- 10.3.2 UK
- 10.3.3 France
- 10.3.4 Spain
- 10.3.5 Italy
- 10.3.6 Rest of Europe
- 10.4 Asia Pacific
- 10.4.1 China
- 10.4.2 India
- 10.4.3 Japan
- 10.4.4 Australia
- 10.4.5 South Korea
- 10.4.6 Rest of Asia Pacific
- 10.5 Latin America
- 10.5.1 Brazil
- 10.5.2 Mexico
- 10.5.3 Argentina
- 10.5.4 Rest of Latin America
- 10.6 Middle East and Africa
- 10.6.1 Saudi Arabia
- 10.6.2 South Africa
- 10.6.3 UAE
- 10.6.4 Rest of Middle East and Africa
Chapter 11 Company Profiles
- 11.1 Fonterra Co-operative Group Limited
- 11.2 Glanbia plc
- 11.3 Lactalis Ingredients
- 11.4 Kerry Group plc
- 11.5 Saputo Inc.
- 11.6 Arla Foods amba
- 11.7 Royal FrieslandCampina N.V.
- 11.8 Nestle S.A. (Nutrition & Health Science)
- 11.9 Hilmar Ingredients
- 11.10 Milk Specialties Global
- 11.11 Agropur Cooperative
- 11.12 Carbery Group
- 11.13 Glanbia Performance Nutrition (Optimum Nutrition Brand)
- 11.14 Idaho Milk Products
- 11.15 Arla Foods Ingredients Group P/S
