
|
시장보고서
상품코드
1913347
역물류 시장 : 시장 기회, 성장 요인, 산업 동향 분석 및 예측(2026-2035년)Reverse Logistics Market Opportunity, Growth Drivers, Industry Trend Analysis, and Forecast 2026 - 2035 |
||||||
세계의 역물류 시장은 2025년 8,726억 달러로 평가되었고, 2035년까지 연평균 복합 성장률(CAGR) 7.3%로 성장할 전망이며, 1조 7,500억 달러에 이를 것으로 예측됩니다.
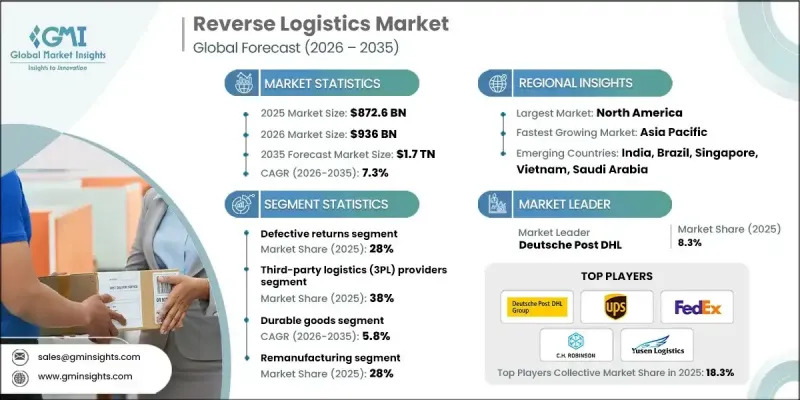
시장 성장은 기업의 환경 책임에 대한 주력 강화와 보다 광범위한 지속가능성 목표와의 무결성에 의해 추진되고 있습니다. 역물류는 반품 제품의 체계적인 회수, 재이용 및 책임적인 폐기를 가능하게 함으로써 폐기물 감축을 지원하고 조직이 환경 부하를 저감하는 동시에 기업의 사회적 책임에 대한 대처를 강화하는 것을 돕습니다. 또한 지속가능성은 경쟁적 차별화 요인이 되고 있으며, 소비자는 책임있는 사업 운영을 실천하는 기업을 점점 지지하는 경향이 있습니다. 디지털 상거래의 급속한 확대는 반품량을 크게 늘리고 공급망을 통한 제품 이동을 관리하는 효율적인 시스템의 필요성을 높입니다. 효율적인 반품 처리는 고객 만족도, 브랜드 신뢰성, 장기적인 고객 유지와 밀접한 관련이 있습니다. 역물류는 반품 상품으로부터의 가치 회수, 자재 효율의 향상, 신규 투입 자원에 대한 의존도 저감을 통해 비용 관리도 지원합니다. 기업이 순환 경제 모델 및 비즈니스 연속성을 추구하는 동안, 역물류는 소매, 제조 및 유통 네트워크를 가로지르는 전략적 기능으로 세계적으로 중요성을 늘리고 있습니다.
| 시장 범위 | |
|---|---|
| 시작 연도 | 2025년 |
| 예측 연도 | 2026-2035년 |
| 시작 시 가치 | 8,726억 달러 |
| 예측 금액 | 1조 7,500억 달러 |
| CAGR | 7.3% |
불량 반품 부문은 2025년에 28%의 점유율을 차지했습니다. 특히 기술 주도형 및 소비자 지향 산업에서 비호환 제품의 높은 볼륨이 역류를 지속적으로 촉진하고 있습니다. 조직은 결함 관련 비용을 억제하기 위해 고급 진단 및 공급업체 협력 도구를 점점 더 활용하고 있습니다. 규제 감시 및 투명성에 대한 기대가 계속 증가함에 따라 제품 리콜도 증가하는 경향이 있습니다.
내구 소비재 부문은 2026-2035년 연평균 복합 성장률(CAGR) 5.8%로 성장할 것으로 예측됩니다. 높은 반품 빈도, 재생 가능성, 지속적인 2차 시장 수요는 견조한 성과를 지원합니다. 소비자용 제품과 관련된 역물류 활동은 컴플라이언스 요구사항, 라이프사이클 관리, 환경 배려의 영향으로 확대되고 있습니다.
미국의 역물류 시장은 2025년 1,600억 달러 규모에 이르렀으며, 2035년까지 견조한 성장이 예상됩니다. 높은 반품률이 자동화, 데이터 구동형 구분, 처리 사이클의 고속화에 대한 투자를 촉진하고 있습니다. 많은 기업들이 효율성 및 고객 경험 향상을 위해 리버스 오퍼레이션을 외부 위탁하는 한편 지속가능성의 요청과 ESG 이니셔티브가 재이용 및 회수 프로그램의 가속을 지속적으로 추진하고 있습니다.
자주 묻는 질문
목차
제1장 조사 방법
제2장 주요 요약
제3장 업계 인사이트
- 생태계 분석
- 공급자의 상황
- 이익률 분석
- 비용 구조
- 각 단계에서의 부가가치
- 밸류체인에 영향을 주는 요인
- 혁신
- 업계에 미치는 영향요인
- 성장 촉진요인
- 온라인 쇼핑 성장에 따른 EC 반품 증가
- 폐기물 관리 및 재활용에 관한 규제 요건
- 지속가능성 및 순환형 경제의 도입에 대한 관심 증가
- 반품 상품 및 재생 가능 자재로부터의 비용 회수 가능성
- 기술 진보 : 추적 및 자동화를 위한 AI, IoT, 블록체인
- 업계의 잠재적 위험 및 과제
- 반품 수송 및 처리에 있어서 높은 운영 비용
- 멀티채널 반품 관리의 복잡성
- 시장 기회
- 녹색 물류 및 탄소 실적 감소 이니셔티브와의 통합
- 재생품 및 중고 시장 확대
- 스마트 역물류 솔루션(AI, 예측 분석) 도입
- 제조업체, 소매업체, 재활용 기업 간 제휴
- 성장 가능성 분석
- 규제 상황
- 북미
- 미국-자원보전, 재생법(RCRA) 및 확대 생산자 책임(EPR)법
- 캐나다-캐나다 환경보호법(CEPA) 및 주 EPR 프로그램
- 유럽
- 영국-폐전기전자 기기(WEEE) 규제
- 독일-순환경제법(Kreislaufwirtschaftsgesetz)
- 프랑스-순환형 경제를 위한 폐기물 감축법(AGEC법)
- 이탈리아-환경법(정령 제152호/2006년)
- 스페인-폐기물 및 오염토양법
- 아시아태평양
- 중국-확대 생산자 책임 제도 및 고형 폐기물 오염 방지법
- 일본-가전 리사이클법 및 자동차 리사이클법
- 인도-전자 폐기물 관리 규칙 및 플라스틱 폐기물 관리 규칙
- 라틴아메리카
- 브라질-국가 고형 폐기물 정책(PNRS)
- 멕시코-폐기물 방지 및 종합 관리에 관한 일반법(LGPGIR)
- 아르헨티나-통합 폐기물 관리법
- 중동 및 아프리카
- 아랍에미리트(UAE)-폐기물 관리에 관한 연방법
- 남아프리카-국가 환경 관리 : 폐기물법
- 사우디아라비아-폐기물 관리 규제
- 북미
- Porter's Five Forces 분석
- PESTEL 분석
- 기술 및 혁신 동향
- 현재 기술 동향
- 신흥 기술
- 비용 내역 분석
- 개발 비용 구조
- 연구개발비 분석
- 마케팅 및 판매 비용
- 특허 분석
- 지속가능성 및 환경면
- 지속가능한 실천
- 폐기물 감축 전략
- 생산에 있어서 에너지 효율
- 환경에 배려한 대처
- 반품 행동 및 반품율의 동향
- 업계 및 제품 카테고리별 반품률 분석
- 관대한 반품 정책이 역물류량에 미치는 영향
- 계절적 및 프로모션에 의한 반품 변동
- 역물류 업무에 있어서의 리스크 상황
- 장래의 운영 모델 및 업계의 진화
- 플랫폼형 역물류 및 에코시스템
- 분산형 및 온디맨드 반품 처리
- 제로 웨이스트 의무화의 장기적인 영향
제4장 경쟁 구도
- 서문
- 기업의 시장 점유율 분석
- 북미
- 유럽
- 아시아태평양
- 라틴아메리카
- 중동 및 아프리카
- 주요 시장 기업의 경쟁 분석
- 경쟁 포지셔닝 매트릭스
- 전략적 전망 매트릭스
- 주요 발전
- 합병 및 인수
- 제휴 및 협업
- 신제품 발매
- 사업 확대 계획 및 자금 조달
제5장 시장 추계 및 예측 : 제조 공정별(2021-2034년)
- 반품 관리
- 재생 제조
- 재활용
- 폐기 처리
- 기타
제6장 시장 추계 및 예측 : 수익별(2021-2034년)
- 불량 반품
- 회수된 수익
- B2B 반품 및 상업 반품
- 수리 가능한 반품
- 수명 종료시의 반품
- 기타
제7장 시장 추계 및 예측 : 서비스 제공업체별(2021-2034년)
- 사내 역물류
- 제3자물류(3PL) 공급자
- 재활용 기업
- 폐기물 관리 회사
제8장 시장 추계 및 예측 : 카테고리별(2022-2035년)
- 내구 소비재
- 소모품
- 산업용 기기
- 포장자재
- 기타
제9장 시장 추계 및 예측 : 최종 용도별(2021-2034년)
- 소매업 및 전자상거래
- 전자기기
- 자동차
- 의약품
- 제조업
- 기타
제10장 시장 추계 및 예측 : 지역별(2022-2035년)
- 북미
- 미국
- 캐나다
- 유럽
- 독일
- 영국
- 프랑스
- 이탈리아
- 스페인
- 러시아
- 북유럽 국가
- 포르투갈
- 크로아티아
- 베네룩스
- 아시아태평양
- 중국
- 인도
- 일본
- 호주
- 한국
- 싱가포르
- 태국
- 인도네시아
- 베트남
- 라틴아메리카
- 브라질
- 멕시코
- 아르헨티나
- 콜롬비아
- 중동 및 아프리카
- 남아프리카
- 사우디아라비아
- 아랍에미리트(UAE)
- 튀르키예
제11장 기업 프로파일
- 세계 기업
- Deutsche Post DHL
- United Parcel Service(UPS)
- FedEx
- CMA CGM
- DB Schenker
- CEVA Logistics
- XPO Logistics
- Ryder System
- CH Robinson Worldwide
- Yusen Logistics
- Kintetsu World Express
- Ingram Micro Commerce &Lifecycle Services
- Logistics Plus
- 지역 기업
- NFI Industries
- Pitney Bowes
- Blue Dart Express
- Safexpress
- Reverse Logistics
- Stena Recycling
- R2 Logistics
- Inmar Intelligence
- 신흥 기업 및 디스럽터 기업
- Happy Returns(a PayPal company)
- Optoro
- ReverseLogix
- Apto Solutions
- Forterra Solutions
- Core Logistic
- Softbox Systems
- R2 Logistics
- Forterra Solutions
The Global Reverse Logistics Market was valued at USD 872.6 billion in 2025 and is estimated to grow at a CAGR of 7.3% to reach USD 1.75 trillion by 2035.

Market growth is driven by stronger corporate focus on environmental responsibility and alignment with broader sustainability objectives. Reverse logistics supports waste reduction by enabling structured recovery, reuse, and responsible disposal of returned products, helping organizations reduce environmental impact while strengthening corporate responsibility commitments. Sustainability has also become a competitive differentiator, as consumers increasingly favor companies that demonstrate responsible operational practices. The rapid expansion of digital commerce has significantly increased return volumes, intensifying the need for efficient systems to manage product movement back through the supply chain. Streamlined return handling is now closely tied to customer satisfaction, brand trust, and long-term retention. Reverse logistics also supports cost control by recovering value from returned goods, improving material efficiency, and reducing reliance on new inputs. As companies pursue circular economy models and operational resilience, reverse logistics has become a strategic function across retail, manufacturing, and distribution networks worldwide.
| Market Scope | |
|---|---|
| Start Year | 2025 |
| Forecast Year | 2026-2035 |
| Start Value | $872.6 Billion |
| Forecast Value | $1.75 Trillion |
| CAGR | 7.3% |
The defective returns segment held 28% share in 2025. High volumes of nonconforming products continue to drive reverse flows, particularly across technology-driven and consumer-focused industries. Organizations are increasingly applying advanced diagnostics and supplier collaboration tools to limit defect-related costs. Product recalls are also rising as regulatory oversight and transparency expectations continue to increase.
The durable goods segment is forecast to grow at a CAGR of 5.8% from 2026 to 2035. Strong performance is supported by higher return frequency, refurbishment potential, and sustained secondary market demand. Reverse logistics activity related to consumable products is also expanding, influenced by compliance requirements, lifecycle management, and environmental considerations.
U.S. Reverse Logistics Market reached USD 160 billion in 2025 and is expected to show strong growth through 2035. High return rates are driving investment in automation, data-driven sorting, and faster processing cycles. Many businesses are outsourcing reverse operations to improve efficiency and customer experience, while sustainability mandates and ESG initiatives continue to accelerate reuse and recovery programs.
Major companies operating in the Global Reverse Logistics Market include United Parcel Service (UPS), Deutsche Post DHL, FedEx, DB Schenker, CEVA Logistics, C.H. Robinson Worldwide, Yusen Logistics, Kintetsu World Express, NFI Industries, Optoro, and ReverseLogix. Companies in the Global Reverse Logistics Market are strengthening their competitive position through automation, digital platforms, and service integration. Investments in artificial intelligence and data analytics are improving return visibility, grading accuracy, and processing speed. Strategic partnerships with retailers and manufacturers help expand service scope and secure long-term contracts. Many providers are enhancing sustainability-focused offerings to support recycling, refurbishment, and resale initiatives. Geographic expansion and localized return centers are being used to reduce transportation costs and turnaround times. Firms are also differentiating through end-to-end solutions that integrate transportation, warehousing, and data management.
Table of Contents
Chapter 1 Methodology
- 1.1 Market scope and definition
- 1.2 Research design
- 1.2.1 Research approach
- 1.2.2 Data collection methods
- 1.3 Data mining sources
- 1.3.1 Global
- 1.3.2 Regional/Country
- 1.4 Base estimates and calculations
- 1.4.1 Base year calculation
- 1.4.2 Key trends for market estimation
- 1.5 Primary research and validation
- 1.5.1 Primary sources
- 1.6 Forecast
- 1.7 Research assumptions and limitations
Chapter 2 Executive Summary
- 2.1 Industry 360° synopsis, 2022 - 2035
- 2.2 Key market trends
- 2.2.1 Regional
- 2.2.2 Processes
- 2.2.3 Return
- 2.2.4 Service provider
- 2.2.5 Category
- 2.2.6 End use
- 2.3 TAM Analysis, 2026-2035
- 2.4 CXO perspectives: Strategic imperatives
- 2.4.1 Executive decision points
- 2.4.2 Critical success factors
- 2.5 Future outlook & strategic recommendations
Chapter 3 Industry Insights
- 3.1 Industry ecosystem analysis
- 3.1.1 Supplier landscape
- 3.1.2 Profit margin analysis
- 3.1.3 Cost structure
- 3.1.4 Value addition at each stage
- 3.1.5 Factor affecting the value chain
- 3.1.6 Disruptions
- 3.2 Industry impact forces
- 3.2.1.1 Growth drivers
- 3.2.1.2 Increasing e-commerce returns due to online shopping growth.
- 3.2.1.3 Regulatory mandates for waste management and recycling.
- 3.2.1.4 Rising focus on sustainability and circular economy adoption.
- 3.2.1.5 Cost recovery potential from returned goods and recyclable materials.
- 3.2.1.6 Technological advancements: AI, IoT, and blockchain for tracking and automation
- 3.2.2 Industry pitfalls and challenges
- 3.2.2.1 High operational costs for transportation and processing of returns.
- 3.2.2.2 Complexity in managing multi-channel returns.
- 3.2.3 Market opportunities
- 3.2.3.1 Integration with green logistics and carbon footprint reduction initiatives.
- 3.2.3.2 Expansion of refurbished and secondary markets.
- 3.2.3.3 Adoption of smart reverse logistics solutions (AI, predictive analytics).
- 3.2.3.4 Partnerships between manufacturers, retailers, and recycling firms.
- 3.3 Growth potential analysis
- 3.4 Regulatory landscape
- 3.4.1 North America
- 3.4.1.1 U.S. - Resource Conservation and Recovery Act (RCRA) & Extended Producer Responsibility (EPR) Laws
- 3.4.1.2 Canada - Canadian Environmental Protection Act (CEPA) & Provincial EPR Programs
- 3.4.2 Europe
- 3.4.2.1 UK - Waste Electrical and Electronic Equipment (WEEE) Regulations
- 3.4.2.2 Germany - Circular Economy Act (Kreislaufwirtschaftsgesetz)
- 3.4.2.3 France - Anti-Waste Law for a Circular Economy (AGEC Law)
- 3.4.2.4 Italy - Environmental Code (Legislative Decree 152/2006)
- 3.4.2.5 Spain - Waste and Contaminated Soils Law
- 3.4.3 Asia Pacific
- 3.4.3.1 China - Extended Producer Responsibility System & Solid Waste Pollution Prevention Law
- 3.4.3.2 Japan - Home Appliance Recycling Act & End-of-Life Vehicle Recycling Law
- 3.4.3.3 India - E-Waste Management Rules & Plastic Waste Management Rules
- 3.4.4 Latin America
- 3.4.4.1 Brazil - National Solid Waste Policy (PNRS)
- 3.4.4.2 Mexico - General Law for Waste Prevention and Integral Management (LGPGIR)
- 3.4.4.3 Argentina - Integrated Waste Management Law
- 3.4.5 Middle East & Africa
- 3.4.5.1 UAE - Federal Law on Waste Management
- 3.4.5.2 South Africa - National Environmental Management: Waste Act
- 3.4.5.3 Saudi Arabia - Waste Management Regulation
- 3.4.1 North America
- 3.5 Porter's analysis
- 3.6 PESTEL analysis
- 3.7 Technology and innovation landscape
- 3.7.1 Current technological trends
- 3.7.2 Emerging technologies
- 3.8 Cost breakdown analysis
- 3.8.1 Development cost structure
- 3.8.2 R&D cost analysis
- 3.8.3 Marketing & sales costs
- 3.9 Patent analysis
- 3.10 Sustainability and environmental aspects
- 3.10.1 Sustainable practices
- 3.10.2 Waste reduction strategies
- 3.10.3 Energy efficiency in production
- 3.10.4 Eco-friendly Initiatives
- 3.11 Returns behavior & return-rate dynamics
- 3.11.1 Return rate analysis by industry and product category
- 3.11.2 Impact of liberal return policies on reverse logistics volumes
- 3.11.3 Seasonal and promotional return fluctuations
- 3.12 Risk landscape in reverse logistics operations
- 3.13 Future operating models & industry evolution
- 3.13.1 Platform-based reverse logistics ecosystems
- 3.13.2 Decentralized and on-demand return processing
- 3.13.3 Long-term implications of zero-waste mandates
Chapter 4 Competitive Landscape, 2025
- 4.1 Introduction
- 4.2 Company market share analysis
- 4.2.1 North America
- 4.2.2 Europe
- 4.2.3 Asia Pacific
- 4.2.4 LATAM
- 4.2.5 MEA
- 4.3 Competitive analysis of major market players
- 4.4 Competitive positioning matrix
- 4.5 Strategic outlook matrix
- 4.6 Key developments
- 4.6.1 Mergers & acquisitions
- 4.6.2 Partnerships & collaborations
- 4.6.3 New Product Launches
- 4.6.4 Expansion Plans and funding
Chapter 5 Market Estimates & Forecast, By Processes, 2021 - 2034 ($Bn)
- 5.1 Key trends
- 5.2 Returns management
- 5.3 Remanufacturing
- 5.4 Recycling
- 5.5 Disposal
- 5.6 Others
Chapter 6 Market Estimates & Forecast, By Return, 2021 - 2034 ($Bn)
- 6.1 Key trends
- 6.2 Defective returns
- 6.3 Recalled returns
- 6.4 B2B returns and commercial returns
- 6.5 Repairable returns
- 6.6 End of life returns
- 6.7 Others
Chapter 7 Market Estimates & Forecast, By Service Provider, 2021 - 2034 ($Bn)
- 7.1 Key trends
- 7.2 In-house reverse logistics
- 7.3 Third-party logistics (3PL) Providers
- 7.4 Recycling companies
- 7.5 Waste management companies
Chapter 8 Market Estimates & Forecast, By Category, 2022 - 2035 (USD Mn)
- 8.1 Key trends
- 8.2 Durable Goods
- 8.3 Consumables
- 8.4 Industrial Equipment
- 8.5 Packaging Materials
- 8.6 Others
Chapter 9 Market Estimates & Forecast, By End Use, 2021 - 2034 ($Bn)
- 9.1 Key trends
- 9.2 Retail & E-commerce
- 9.3 Electronics
- 9.4 Automotive
- 9.5 Pharmaceuticals
- 9.6 Manufacturing
- 9.7 Others
Chapter 10 Market Estimates & Forecast, By Region, 2022 - 2035 (USD Mn)
- 10.1 Key trends
- 10.2 North America
- 10.2.1 US
- 10.2.2 Canada
- 10.3 Europe
- 10.3.1 Germany
- 10.3.2 UK
- 10.3.3 France
- 10.3.4 Italy
- 10.3.5 Spain
- 10.3.6 Russia
- 10.3.7 Nordics
- 10.3.8 Portugal
- 10.3.9 Croatia
- 10.3.10 Benelux
- 10.4 Asia Pacific
- 10.4.1 China
- 10.4.2 India
- 10.4.3 Japan
- 10.4.4 Australia
- 10.4.5 South Korea
- 10.4.6 Singapore
- 10.4.7 Thailand
- 10.4.8 Indonesia
- 10.4.9 Vietnam
- 10.5 Latin America
- 10.5.1 Brazil
- 10.5.2 Mexico
- 10.5.3 Argentina
- 10.5.4 Colombia
- 10.6 MEA
- 10.6.1 South Africa
- 10.6.2 Saudi Arabia
- 10.6.3 UAE
- 10.6.4 Turkey
Chapter 11 Company Profiles
- 11.1 Global Players
- 11.1.1 Deutsche Post DHL
- 11.1.2 United Parcel Service (UPS)
- 11.1.3 FedEx
- 11.1.4 CMA CGM
- 11.1.5 DB Schenker
- 11.1.6 CEVA Logistics
- 11.1.7 XPO Logistics
- 11.1.8 Ryder System
- 11.1.9 C.H. Robinson Worldwide
- 11.1.10 Yusen Logistics
- 11.1.11 Kintetsu World Express
- 11.1.12 Ingram Micro Commerce & Lifecycle Services
- 11.1.13 Logistics Plus
- 11.2 Regional Players
- 11.2.1 NFI Industries
- 11.2.2 Pitney Bowes
- 11.2.3 Blue Dart Express
- 11.2.4 Safexpress
- 11.2.5 Reverse Logistics
- 11.2.6 Stena Recycling
- 11.2.7 R2 Logistics
- 11.2.8 Inmar Intelligence
- 11.3 Emerging / Disruptor Players
- 11.3.1 Happy Returns (a PayPal company)
- 11.3.2 Optoro
- 11.3.3 ReverseLogix
- 11.3.4 Apto Solutions
- 11.3.5 Forterra Solutions
- 11.3.6 Core Logistic
- 11.3.7 Softbox Systems
- 11.3.8 R2 Logistics
- 11.3.9 Forterra Solutions
