
|
시장보고서
상품코드
1939719
미국의 역물류 : 시장 점유율 분석, 업계 동향과 통계, 성장 예측(2026-2031년)United States Reverse Logistics - Market Share Analysis, Industry Trends & Statistics, Growth Forecasts (2026 - 2031) |
||||||
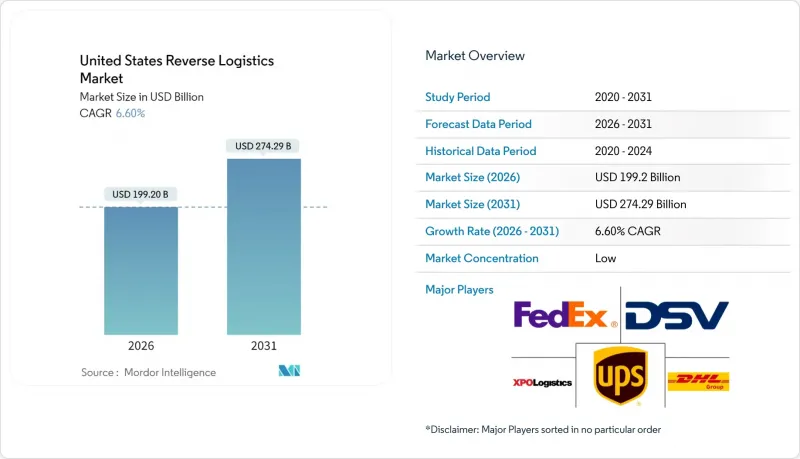
2026년 미국 역물류 시장 규모는 1,992억 달러로 추정되며, 2025년 1,868억 7,000만 달러에서 성장하며, 2031년에는 2,742억 9,000만 달러에 달할 것으로 예측됩니다. 2026-2031년에 걸친 연평균 성장률(CAGR)은 6.6%에 달할 전망입니다.
이러한 성장 궤도의 주요 요인은 견고한 E-Commerce 성장, 전자 폐기물에 대한 규제 당국의 감시 강화, 그리고 고객 충성도 확보를 위한 마찰 없는 반품을 특징으로 하는 브랜드 전략이 주요 요인으로 꼽힙니다. 반품 상품은 수백만 개의 분산된 주소에서 발생하며, 중앙 처리 센터로 신속하게 재배치해야 하므로 운송비가 지출의 대부분을 차지하고 있습니다. 한편, 로봇공학, 컴퓨터 비전, AI 기반 폐기 엔진에 대한 기술 투자로 단가를 낮추고 반품된 제품을 빠르게 수익화할 수 있는 자산으로 전환하여 회수율을 높이고 있습니다. 2025년 주요인수합병 사례에서 알 수 있듯이, 대형 물류 사업자 간의 통합이 진행되는 가운데, 전용 리버스 네트워크, 콜드체인 자산, 컴플라이언스 전문성을 갖춘 사업자만이 이 기회를 완전히 수익화할 수 있을 것으로 보입니다.
미국 역물류 시장 동향 및 인사이트
E-Commerce의 급격한 성장으로 반품량 증가
온라인 지출 증가는 거의 직접적으로 반품량 증가로 이어집니다. 소매상들은 종종'브래킷 구매'에 직면하게 됩니다. 이는 쇼핑객이 여러 가지 상품을 주문하고 그 중 대부분을 반품하는 것을 전제로 하는 행위로, 리버스 플로우의 속도가 구매 전 판매 포인트가 되고 있습니다. 현재 주요 택배업체들은 공차 주행거리를 최소화하기 위해 라스트마일 배송 경로 계획에 반품 수거를 포함시키고 있습니다. 이 조정으로 체류 시간이 단축되고, 입고 부두의 혼잡이 완화됩니다. 고처리 능력의 컨베이어를 갖춘 반품센터도 휴가 후 급증하는 반품에 대응하기 위해 규모를 확대하여 48시간 이내에 재고를 재배치하여 품절 사태를 방지하고 있습니다. 이 사이클을 효율적으로 운영하는 전국 규모의 소매업체는 고객 평생 가치를 높이면서 더 많은 운전 자본을 회수할 수 있습니다.
경쟁 우위로서의 관대한 반품 정책
과거에는 서비스의 일부였던 넉넉한 반품 기간이 이제는 구매 전환의 핵심이 되고 있습니다. '시도 후 구매' 모델을 만들어낸 D2C 브랜드는 고객 만족도를 유지하기 위해 며칠이 아닌 몇 시간 내에 처리 및 환불이 가능한 파트너를 찾고 있습니다. 따라서 리버스 네트워크는 지역적 범위와 기술 기반에서 포워드 네트워크를 모방하여 택배 보관함, 매장 카운터, 우편 반품 채널을 동일한 재고 클라우드로 연결합니다. AI 기반 부정행위 분석은 비정상적으로 높은 반품률을 보이는 고객을 감지하여 소매업체가 손실률을 증가시키지 않고 관대한 정책을 유지할 수 있도록 지원합니다. 이 밸런스를 잘 잡은 업체는 의류 및 가전제품 소매업체와 장기 계약을 체결하고 있습니다.
높은 운송 및 취급 비용
역방향 물류 루트는 본질적으로 불균형적이며, 트럭이 부분적으로만 적재된 상태로 돌아가는 경우가 많기 때문에 단위당 비용이 상승합니다. 연료 가격의 변동은 이러한 문제를 더욱 심화시키고 있으며, 선단 운영자들은 새로운 3단계 온실가스 규제에 대응하기 위해 값비싼 장비 교체가 필요한 상황입니다. 이익률을 보호하기 위해 공급자는 소포를 지역 크로스도크에 통합하고, 적재율을 높이기 위해 동적 백홀 계약을 협상하여 적재율을 높입니다. 그러나 저가 상품의 경우 운송비만으로도 재판매 이익이 사라지는 경우도 있으며, 양산품은 재생품이 아닌 청산품으로 처리되는 경향이 있습니다.
부문 분석
2025년 기준, 미국 역물류 시장 규모의 64.40%를 운송이 차지하고 있으며, 이는 가치 회수에 있으며, 회수 및 재배치가 최우선 순위임을 나타냅니다. 소량화물 및 트럭 미만 화물 운송업체는 배송 경로와 연계된 전용 반송 차선을 배치하여 네트워크 밀도를 극대화하고 있습니다. 항공화물 운송은 특히 의료기기 업계에서 고가품이나 온도관리가 필요한 반품을 지속적으로 취급하고 있습니다. 창고는 2차 비용센터로 이어지며, 주요 항만 및 주간 고속도로 인근의 멀티 클라이언트형 시설은 크로스도킹 상품의 사이클 타임 단축에 기여하고 있습니다. 기타 부가가치 서비스(수리, 재생, 등급 판정, 인증 폐기)는 브랜드가 순환 모델을 추구함에 따라 수요가 증가하고 있으며, 2031년까지 이 부문의 CAGR을 4.65%로 끌어올릴 것입니다. 운송과 이러한 서비스를 결합한 공급자는 전체 폐기 체인을 관리할 수 있으므로 프리미엄 매출을 얻을 수 있습니다.
2세대 시설에서는 로봇 분류, 데이터 삭제가 완료된 테스트 랩, EC용 사진 부스를 통합하여 회수품이 도착한 당일에 리커머스 마켓플레이스에 출품할 수 있는 체제를 갖추고 있습니다. 이러한 변화를 통해 미국 역물류 시장 내에서 매출 증가를 창출하고, 청산 도매업체에 대한 외부 위탁을 줄였습니다. 장거리 운송 사업자도 마찬가지로 도크 사이드에서 선별 작업을 추가하여 낭비되는 주행거리를 줄였습니다. 기능 통합이 이익률과 지속가능성 측면에서 성과를 가져온다는 것을 입증하고 있습니다.
기타 특전:
- 엑셀 형식 시장 예측(ME) 시트
- 애널리스트의 3개월간 지원
자주 묻는 질문
목차
제1장 서론
제2장 조사 방법
제3장 개요
제4장 시장 구도
제5장 시장 규모와 성장 예측
제6장 경쟁 구도
제7장 시장 기회와 향후 전망
KSA 26.03.05United States Reverse Logistics market size in 2026 is estimated at USD 199.2 billion, growing from 2025 value of USD 186.87 billion with 2031 projections showing USD 274.29 billion, growing at 6.6% CAGR over 2026-2031.

Robust e-commerce growth, heightened regulatory scrutiny of electronic waste, and brand strategies that use friction-free returns to win customer loyalty are the chief forces behind this trajectory. Transportation continues to absorb the bulk of spending because returned items originate from millions of dispersed addresses and require rapid repositioning into central processing hubs. At the same time, technology investments in robotics, computer vision, and AI-enabled disposition engines are lowering unit costs, turning returned products into quickly monetized assets, and improving recovery rates. Consolidation among major logistics providers-underscored by headline acquisitions in 2025-signals that only operators with dedicated reverse networks, cold-chain assets, and compliance expertise can fully monetize the opportunity.
United States Reverse Logistics Market Trends and Insights
E-commerce Boom Lifting Return Volumes
Online spending growth translates almost directly into higher returns. Retailers frequently encounter "bracketing," where shoppers order multiple variants with the expectation of sending most of them back, turning reverse flow speed into a pre-purchase selling point. Major parcel carriers now embed returns pick-ups in last-mile route plans to minimize empty-truck miles, an adjustment that cuts dwell time and limits congestion at inbound docks. Returns centers equipped with high-throughput conveyors are also scaling to meet the post-holiday influx, preventing stockouts by redeploying inventory within 48 hours. National retailers that excel at this cycle improve customer lifetime value while recovering more working capital.
Liberal Returns Policies as Competitive Differentiator
Generous return windows, once a courtesy, are now pivotal to conversion. Direct-to-consumer brands that originated the "try-before-you-buy" model require partners that can process and refund within hours, not days, to maintain customer satisfaction scores. Reverse networks, therefore, mirror forward networks in geographic reach and technology stack, linking parcel lockers, in-store counters, and mail-back channels to the same inventory cloud. AI-driven fraud analytics flag unusually high-return personas, allowing retailers to sustain lenient policies without escalating shrinkage. Providers that master this balance earn sticky multi-year contracts from apparel and electronics merchants.
High Transportation & Handling Costs
Reverse lanes are inherently imbalanced, with trucks often returning partially filled, which elevates cost per unit. Fuel price volatility amplifies the challenge; fleet operators must align with emerging Phase 3 greenhouse-gas standards that require expensive equipment upgrades. To protect margins, providers consolidate parcels into regional cross-docks and negotiate dynamic backhaul agreements to boost load factors. Yet for low-value merchandise, transportation alone can erase resale profit, pushing volume toward liquidation instead of refurbishment.
Other drivers and restraints analyzed in the detailed report include:
- Sustainability & E-waste Regulations
- Automation & Robotics in Returns Centers
- Omnichannel Returns Complexity
For complete list of drivers and restraints, kindly check the Table Of Contents.
Segment Analysis
Transportation generated 64.40% of the United States Reverse Logistics market size in 2025, underscoring the primacy of collection and repositioning in value recovery. Parcel and less-than-truckload carriers have deployed dedicated returns lanes that sync with outbound routes, maximizing network density. Airfreight continues to handle high-value or temperature-sensitive returns, notably from the medical-device trade. Warehousing follows as the secondary cost center; multi-client campuses near major ports and interstates shorten cycle times for cross-docked items. Other Value-added Services (repair, refurbishment, grading, and certified destruction) capture rising demand as brands pursue circular models, propelling this sub-segment's 4.65% CAGR to 2031. Providers bundling transportation with these services command premium yields because they control the full disposition chain.
Second-generation facilities now combine robotic sortation, data-sanitized test labs, and e-commerce photo booths to list recovered items on recommerce marketplaces the same day they arrive. This shift embeds incremental revenue inside the United States Reverse Logistics market rather than outsourcing it to liquidation wholesalers. Long-haul carriers are likewise adding dockside triage to reduce wasted miles, proving that functional integration yields both margin and sustainability wins.
The United States Reverse Logistics Market Report is Segmented by Function (Transportation, Warehousing, and Other Value-Added Services), End User (Consumer & Retail, Home & Decor, Healthcare & Pharmaceuticals, FMCG, and Other End Users). The Market Forecasts are Provided in Terms of Value (USD).
List of Companies Covered in this Report:
- United Parcel Service (UPS)
- FedEx Corp.
- XPO Logistics
- DSV
- DHL Supply Chain
- C.H. Robinson Worldwide
- Geodis
- Yusen Logistics
- CEVA Logistics
- Kuehne+Nagel
- ShipBob
- United States Postal Service (USPS)
- Excelsior Integrated LLC
- Ryder
- Kenco Logistics
- Yellow Corporation
- RXO Inc.
- ArcBest
- AP Express
- Bluebird Express
Additional Benefits:
- The market estimate (ME) sheet in Excel format
- 3 months of analyst support
TABLE OF CONTENTS
1 Introduction
- 1.1 Study Assumptions & Market Definition
- 1.2 Scope of the Study
2 Research Methodology
3 Executive Summary
4 Market Landscape
- 4.1 Market Overview
- 4.2 Market Drivers
- 4.2.1 E-commerce boom lifting return volumes
- 4.2.2 Liberal returns policies as a competitive differentiator
- 4.2.3 Sustainability & e-waste regulations
- 4.2.4 Automation & robotics in returns centers
- 4.2.5 AI-driven predictive return-prevention analytics
- 4.2.6 Monetization of recommerce marketplaces
- 4.3 Market Restraints
- 4.3.1 High transportation & handling costs
- 4.3.2 Omnichannel returns complexity
- 4.3.3 Rising returns fraud
- 4.3.4 Refurbish/recycle capacity bottlenecks for bulky goods
- 4.4 Value / Supply-Chain Analysis
- 4.5 Technological Outlook
- 4.6 Regulatory Landscape
- 4.7 Porter's Five Forces
- 4.7.1 Threat of New Entrants
- 4.7.2 Bargaining Power of Suppliers
- 4.7.3 Bargaining Power of Buyers
- 4.7.4 Threat of Substitutes
- 4.7.5 Competitive Rivalry
- 4.8 Spotlight - US E-commerce Industry
- 4.9 Study on Changing Consumer Behavior & Preferences
- 4.10 Impact of Cost of Returns on Retailers - Analyst View
5 Market Size & Growth Forecasts
- 5.1 By Function
- 5.1.1 Transportation
- 5.1.1.1 Road
- 5.1.1.2 Air
- 5.1.1.3 Other Modes
- 5.1.2 Warehousing (Storage, Distribution, Consolidation)
- 5.1.3 Other Value-added Services (Return Processing, Restocking, Refurbishment, Disposition)
- 5.1.1 Transportation
- 5.2 By End User
- 5.2.1 Consumer & Retail
- 5.2.2 Home & Decor
- 5.2.3 Healthcare & Pharmaceuticals
- 5.2.4 FMCG
- 5.2.5 Other End Users
6 Competitive Landscape
- 6.1 Market Concentration
- 6.2 Strategic Moves
- 6.3 Market Share Analysis
- 6.4 Company Profiles {(includes Global level Overview, Market level overview, Core Segments, Financials as available, Strategic Information, Market Rank/Share, Products & Services, Recent Developments)}
- 6.4.1 United Parcel Service (UPS)
- 6.4.2 FedEx Corp.
- 6.4.3 XPO Logistics
- 6.4.4 DSV
- 6.4.5 DHL Supply Chain
- 6.4.6 C.H. Robinson Worldwide
- 6.4.7 Geodis
- 6.4.8 Yusen Logistics
- 6.4.9 CEVA Logistics
- 6.4.10 Kuehne+Nagel
- 6.4.11 ShipBob
- 6.4.12 United States Postal Service (USPS)
- 6.4.13 Excelsior Integrated LLC
- 6.4.14 Ryder
- 6.4.15 Kenco Logistics
- 6.4.16 Yellow Corporation
- 6.4.17 RXO Inc.
- 6.4.18 ArcBest
- 6.4.19 AP Express
- 6.4.20 Bluebird Express
7 Market Opportunities & Future Outlook
- 7.1 White-space & Unmet-need Assessment
