
|
시장보고서
상품코드
1998836
소프트드링크 포장 시장 기회, 성장 촉진요인, 업계 동향 분석, 예측(2026-2035년)Soft Drinks Packaging Market Opportunity, Growth Drivers, Industry Trend Analysis, and Forecast 2026 - 2035 |
||||||
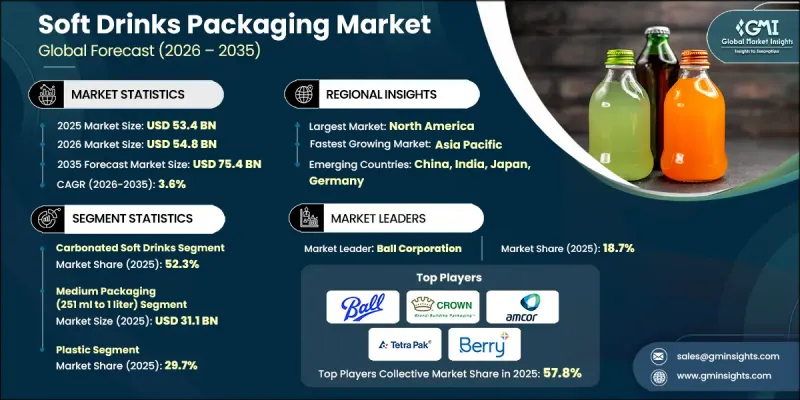
세계의 소프트드링크 포장 시장은 2025년에 534억 달러로 평가되며, 2035년까지 CAGR 3.6%로 성장하며, 754억 달러에 달할 것으로 추정되고 있습니다.

시장 확대는 아시아태평양의 탄산음료 소비 증가, 프리미엄 음료 포맷의 보급 확대, 알루미늄 캔 생산 능력 증가에 의해 주도되고 있습니다. 다른 요인으로는 편의성이 높은 1회용 포장에 대한 소비자의 선호, 유럽과 북미 전역의 재활용 소재 함유 및 순환형 포장에 대한 규제 도입 등이 있습니다. 지속가능한 포장에 대한 관심이 높아지면서 원재료 조달 전략이 재편되고 있는 가운데, 임팩트 있는 장식 인쇄와 특수한 캔 디자인이 브랜드 차별화를 가능하게 하고 있습니다. 팬데믹 이후 회복기에 더욱 강화된 이러한 추세는 프리미엄화, 판매 현장에서의 가시성 향상, 틈새 소비자층을 겨냥한 소량 생산 및 한정판 음료의 생산을 지속적으로 촉진하고 있습니다.
| 시장 범위 | |
|---|---|
| 시작연도 | 2025년 |
| 예측 기간 | 2026-2035년 |
| 시작 금액 | 534억 달러 |
| 예측 금액 | 754억 달러 |
| CAGR | 3.6% |
2025년 기준 탄산음료 부문은 52.3%의 점유율을 차지했습니다. 이 부문의 우위는 탄산의 압력을 견딜 수 있으면서도 가볍고 재활용 가능한 포장에 대한 니즈에 의해 지원됩니다. 탄산음료와 콜라 등의 광범위한 소비로 인해 PET병과 알루미늄 캔에 대한 수요가 지속되고 있습니다. 제조업체들은 내구성, 내압성, 지속가능성의 특성을 결합하는 데 주력하고 있으며, 이를 통해 선진국과 신흥 시장 모두에서 이 부문의 선도적 지위를 유지하고 있습니다.
251ml에서 1리터의 중간 용량 패키지 부문은 2025년 311억 달러의 시장 규모를 기록할 것으로 예측됩니다. 이 사이즈감은 휴대성과 가성비의 균형이 뛰어나며, 1회용부터 다양한 상황에서 사용하기에 적합합니다. PET병 및 알루미늄 캔과의 호환성을 통해 높은 생산 효율과 대량 생산을 하는 음료 브랜드에 안정적인 공급이 보장되어 소매점, 슈퍼마켓, 외식 산업 각 채널에서 그 인기가 높아지고 있습니다.
2025년 북미 청량음료 포장 시장은 35.3%의 점유율을 차지했습니다. 이 지역의 성장은 알루미늄 캔에 대한 견고한 수요, 재활용 소재 함유량 규제 요건에 대한 대응, 탄산음료의 안정적인 소비가 지원하고 있습니다. 이 지역에서는 알루미늄 캔의 재활용률이 여전히 높기 때문에 지속가능성을 추구하는 브랜드에게 선호되는 선택이 되고 있습니다. 미국과 멕시코의 국내 알루미늄 캔 생산에 대한 투자로 공급 안정성이 강화되고 있으며, 규제 요건과 기업의 지속가능성에 대한 노력으로 인해 PET병에 대한 수요는 견고하게 유지되고 있습니다.
자주 묻는 질문
목차
제1장 조사 방법과 범위
제2장 개요
제3장 업계 인사이트
제4장 경쟁 구도
제5장 시장 추산·예측 : 재료별, 2022-2035년
제6장 시장 추산·예측 : 제품 유형별, 2022-2035년
제7장 시장 추산·예측 : 용량별, 2022-2035년
제8장 시장 추산·예측 : 소프트드링크 유형별, 2022-2035년
제9장 시장 추산·예측 : 지역별, 2022-2035년
제10장 기업 개요
KSA 26.04.23The Global Soft Drinks Packaging Market was valued at USD 53.4 billion in 2025 and is estimated to grow at a CAGR of 3.6% to reach USD 75.4 billion by 2035.
The market's expansion is fueled by rising carbonated beverage consumption in the Asia-Pacific region, increasing adoption of premium beverage formats, and growing production capacity for aluminum cans. Additional drivers include consumer preference for convenient single-serve packaging and the implementation of recycled-content and circular packaging mandates across Europe and North America. The growing focus on sustainable packaging is reshaping material sourcing strategies, while high-impact decorative printing and specialty can designs enable brand differentiation. This trend, which intensified following the post-pandemic recovery, continues to support premiumization, improved point-of-sale visibility, and the ability to produce short-run and limited-edition beverages for niche consumer segments.
| Market Scope | |
|---|---|
| Start Year | 2025 |
| Forecast Year | 2026-2035 |
| Start Value | $53.4 Billion |
| Forecast Value | $75.4 Billion |
| CAGR | 3.6% |
The carbonated soft drinks segment held 52.3% share in 2025. The segment's dominance is driven by the need for packaging that withstands carbonation pressure while remaining lightweight and recyclable. The widespread consumption of sparkling beverages and colas ensures sustained demand for both PET bottles and aluminum cans. Manufacturers focus on combining durability, pressure resistance, and sustainability features, maintaining the segment's leading position across both developed and emerging markets.
The medium-sized packaging, ranging from 251 ml to 1 liter, segment generated USD 31.1 billion in 2025. This format offers a balance of portability and value, making it suitable for single-serve consumption as well as multi-occasion use. Its compatibility with PET bottles and aluminum cans ensures strong production efficiency and reliable supply to high-volume beverage brands, reinforcing its popularity across retail, supermarket, and foodservice channels.
North America Soft Drinks Packaging Market accounted for 35.3% share in 2025. Growth in the region is supported by strong demand for aluminum cans, the requirement to meet recycled-content mandates, and consistent consumption of carbonated beverages. Aluminum cans remain highly recycled in the region, making them a preferred choice for brands committed to sustainability. Investments in domestic aluminum can production across the U.S. and Mexico have strengthened supply security, while PET bottle demand remains steady due to regulatory mandates and corporate sustainability initiatives.
Key players in the Global Soft Drinks Packaging Market include Amcor Limited, AptarGroup, Ardagh Group, Ball Corporation, Berry Global Group, Inc., CAN-PACK SA, CPMC Holdings Limited, Crown Holdings, Inc., Graham Packaging Company, Graphic Packaging International, LLC, Novelis Inc., Plastipak Holdings, Inc., SIG, Silgan Holdings Inc., Smurfit Kappa, Tetra Pak International S.A., Visy Industries, and WestRock Company. Companies in the Global Soft Drinks Packaging Market are pursuing multiple strategies to strengthen their market presence and competitive positioning. They are investing in sustainable materials and lightweight packaging to comply with recycled-content mandates and reduce environmental impact. Expansion of production capacity and modernization of canning and bottling lines ensure that supply keeps pace with rising demand. Firms are collaborating with beverage brands to offer customized packaging, specialty printing, and limited-edition designs to enhance shelf visibility and brand engagement. Adoption of digital printing technologies and premium finishing techniques allows companies to differentiate products while catering to single-serve and multi-occasion consumption trends.
Table of Contents
Chapter 1 Methodology and Scope
- 1.1 Market scope and definition
- 1.2 Research design
- 1.2.1 Research approach
- 1.2.2 Data collection methods
- 1.3 Data mining sources
- 1.3.1 Global
- 1.3.2 Regional/Country
- 1.4 Base estimates and calculations
- 1.4.1 Base year calculation
- 1.4.2 Key trends for market estimation
- 1.5 Primary research and validation
- 1.5.1 Primary sources
- 1.6 Forecast model
- 1.7 Research assumptions and limitations
Chapter 2 Executive Summary
- 2.1 Industry 360° synopsis, 2022 - 2035
- 2.2 Key market trends
- 2.2.1 Material trends
- 2.2.2 Product type trends
- 2.2.3 Capacity trends
- 2.2.4 Soft drink type trends
- 2.2.5 Regional trends
- 2.3 TAM Analysis, 2026-2035
- 2.4 CXO perspectives: Strategic imperatives
Chapter 3 Industry Insights
- 3.1 Industry ecosystem analysis
- 3.1.1 Supplier Landscape
- 3.1.2 Profit Margin
- 3.1.3 Cost structure
- 3.1.4 Value addition at each stage
- 3.1.5 Factor affecting the value chain
- 3.1.6 Disruptions
- 3.2 Industry impact forces
- 3.2.1 Growth drivers
- 3.2.1.1 Rising carbonated beverage consumption in Asia-Pacific
- 3.2.1.2 Shift toward lightweight PET bottle formats
- 3.2.1.3 Growth of single-serve, on-the-go packaging
- 3.2.1.4 Expansion of aluminum can capacity globally
- 3.2.1.5 E-commerce-ready secondary packaging demand
- 3.2.2 Industry pitfalls and challenges
- 3.2.2.1 Volatile resin and aluminum price fluctuations
- 3.2.2.2 Recycling infrastructure gaps in emerging economies
- 3.2.3 Market opportunities
- 3.2.3.1 100% recyclable mono-material packaging development
- 3.2.3.2 Smart packaging with QR traceability integration
- 3.2.1 Growth drivers
- 3.3 Growth potential analysis
- 3.4 Regulatory landscape
- 3.4.1 North America
- 3.4.2 Europe
- 3.4.3 Asia Pacific
- 3.4.4 Latin America
- 3.4.5 Middle East & Africa
- 3.5 Porter's analysis
- 3.6 PESTEL analysis
- 3.7 Technology and Innovation landscape
- 3.7.1 Current technological trends
- 3.7.2 Emerging technologies
- 3.8 Price trends
- 3.8.1 By region
- 3.8.2 By product
- 3.9 Pricing Strategies
- 3.10 Emerging Business Models
- 3.11 Compliance Requirements
- 3.12 Patent and IP analysis
Chapter 4 Competitive Landscape, 2025
- 4.1 Introduction
- 4.2 Company market share analysis
- 4.2.1 By region
- 4.2.1.1 North America
- 4.2.1.2 Europe
- 4.2.1.3 Asia Pacific
- 4.2.1.4 Latin America
- 4.2.1.5 Middle East & Africa
- 4.2.2 Market concentration analysis
- 4.2.1 By region
- 4.3 Competitive benchmarking of key players
- 4.3.1 Financial performance comparison
- 4.3.1.1 Revenue
- 4.3.1.2 Profit margin
- 4.3.1.3 R&D
- 4.3.2 Product portfolio comparison
- 4.3.2.1 Product range breadth
- 4.3.2.2 Technology
- 4.3.2.3 Innovation
- 4.3.3 Geographic presence comparison
- 4.3.3.1 Global footprint analysis
- 4.3.3.2 Service network coverage
- 4.3.3.3 Market penetration by region
- 4.3.4 Competitive positioning matrix
- 4.3.4.1 Leaders
- 4.3.4.2 Challengers
- 4.3.4.3 Followers
- 4.3.4.4 Niche players
- 4.3.5 Strategic outlook matrix
- 4.3.1 Financial performance comparison
- 4.4 Key developments
- 4.4.1 Mergers and acquisitions
- 4.4.2 Partnerships and collaborations
- 4.4.3 Technological advancements
- 4.4.4 Expansion and investment strategies
- 4.4.5 Digital transformation initiatives
- 4.5 Emerging/ startup competitors landscape
Chapter 5 Market Estimates and Forecast, By Material, 2022 - 2035 (USD Million)
- 5.1 Key trends
- 5.2 Plastic
- 5.3 Glass
- 5.4 Metal
- 5.5 Paper & paperboard
- 5.6 Others
Chapter 6 Market Estimates and Forecast, By Product Type, 2022 - 2035 (USD Million)
- 6.1 Key trends
- 6.2 Bottles
- 6.3 Cans
- 6.4 Cartons
- 6.5 Pouches
- 6.6 Others
Chapter 7 Market Estimates and Forecast, By Capacity, 2022 - 2035 (USD Million)
- 7.1 Key trends
- 7.2 Small packaging (up to 250 ml)
- 7.3 Medium packaging (251 ml to 1 liter)
- 7.4 Large packaging (above 1 liter)
Chapter 8 Market Estimates and Forecast, By Soft Drink Type, 2022 - 2035 (USD Million)
- 8.1 Key trends
- 8.2 Carbonated soft drinks
- 8.3 Non-carbonated soft drinks
Chapter 9 Market Estimates and Forecast, By Region, 2022 - 2035 (USD Million)
- 9.1 Key trends
- 9.2 North America
- 9.2.1 U.S.
- 9.2.2 Canada
- 9.3 Europe
- 9.3.1 Germany
- 9.3.2 UK
- 9.3.3 France
- 9.3.4 Spain
- 9.3.5 Italy
- 9.3.6 Netherlands
- 9.4 Asia Pacific
- 9.4.1 China
- 9.4.2 India
- 9.4.3 Japan
- 9.4.4 Australia
- 9.4.5 South Korea
- 9.5 Latin America
- 9.5.1 Brazil
- 9.5.2 Mexico
- 9.5.3 Argentina
- 9.6 Middle East and Africa
- 9.6.1 South Africa
- 9.6.2 Saudi Arabia
- 9.6.3 UAE
Chapter 10 Company Profiles
- 10.1 Global Key Players
- 10.1.1 Amcor Limited
- 10.1.2 Ball Corporation
- 10.1.3 Crown Holdings, Inc.
- 10.1.4 Berry Global Group, Inc.
- 10.1.5 Tetra Pak International S.A
- 10.1.6 SIG
- 10.2 Regional key players
- 10.2.1 North America
- 10.2.1.1 AptarGroup
- 10.2.1.2 Graham Packaging Company
- 10.2.1.3 Silgan Holdings Inc.
- 10.2.1.4 WestRock Company
- 10.2.1.5 Plastipak Holdings, Inc.
- 10.2.2 Asia Pacific
- 10.2.2.1 CPMC Holdings Limited
- 10.2.2.2 Visy Industries
- 10.2.3 Europe
- 10.2.3.1 Ardagh Group
- 10.2.3.2 Smurfit Kappa
- 10.2.3.3 CAN-PACK SA
- 10.2.1 North America
- 10.3 Niche Players/Disruptors
- 10.3.1 Novelis Inc.
- 10.3.2 Graphic Packaging International, LLC
