
|
시장보고서
상품코드
2019082
식품 캔 시장 기회, 성장 촉진요인, 업계 동향 분석 및 예측(2026-2035년)Food Cans Market Opportunity, Growth Drivers, Industry Trend Analysis, and Forecast 2026 - 2035 |
||||||
세계의 식품 캔 시장은 2025년에 1,159억 달러로 평가되었으며, 2035년까지 CAGR 3.2%로 성장하여 1,584억 달러에 달할 것으로 추정됩니다.
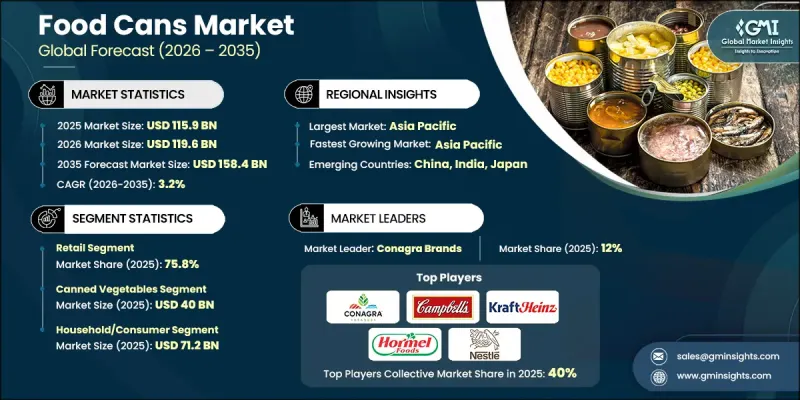
가공식품 및 통조림 식품에 대한 수요 증가와 함께 즉석식품(RTE) 부문의 급속한 성장이 시장 성장을 이끄는 주요 요인으로 작용하고 있습니다. 소비자들은 장기 보관이 가능하고 보관이 용이하며 휴대성이 뛰어난 제품을 원하고 있으며, 이에 따라 제조사들은 내구성이 뛰어나고 시각적으로도 매력적인 캔 디자인을 고안하고 있습니다. 또한, 환경을 생각하는 소비자층 사이에서 친환경 캔이 인기를 끌면서 지속가능한 패키지로의 전환도 시장 확대에 기여하고 있습니다. 재료 및 보존 기술 향상을 포함한 캔 제조 기술의 발전으로 생산자는 보다 견고하고 안전하며 매력적인 포장 옵션을 제공할 수 있게 되었으며, 변화하는 소비자 라이프스타일에 대응하면서 시장의 상승세를 주도하고 있습니다.
| 시장 범위 | |
|---|---|
| 시작 연도 | 2025년 |
| 예측 기간 | 2026-2035년 |
| 시작 시점 시장 규모 | 1,159억 달러 |
| 예측 규모 | 1,584억 달러 |
| CAGR | 3.2% |
온라인 및 E-Commerce 채널 부문은 인터넷 보급률과 스마트폰 사용 증가로 인해 소비자들이 통조림 제품을 택배로 구매할 수 있게 됨에 따라 2035년까지 연평균 4.4%의 성장률을 보일 것으로 예상됩니다. E-Commerce 플랫폼은 다양한 제품 라인업, 경쟁력 있는 가격, 구독형 프로모션을 제공함으로써 바쁘고 기술에 정통한 소비자들에게 어필하고 온라인 판매 확대를 주도하고 있습니다.
즉석섭취(RTE) 식품 부문은 편리하고 영양가가 높으며 휴대하기 쉬운 식품 솔루션에 대한 수요에 힘입어, 2035년까지 연평균 성장률(CAGR) 4.5%로 성장할 것으로 전망됩니다. 도시화, 바쁜 라이프스타일, 시간 절약형 식사에 대한 요구가 증가함에 따라 제조업체들은 매력적인 포장, 풍부한 맛, 영양가 있는 RTE 통조림 식품 생산에 주력하고 있습니다.
2025년 기준 북미 식품 캔 시장은 31.4%의 점유율을 차지했습니다. 이 지역의 성장은 소매, 식품 가공 및 RTE(Ready-To-Eat) 식품 부문의 확장에 의해 뒷받침되고 있습니다. 소비자들은 점점 더 편리하고 환경 친화적이며 장기간 제품 품질을 유지할 수 있는 패키지를 선호하고 있습니다. 이 시장은 장기 보관이 가능하고 영양가가 높으며 지속가능한 패키지를 갖춘 가공식품에 대한 강력한 수요와 접근성을 높이는 탄탄한 E-Commerce 생태계에 의해 주도되고 있습니다.
자주 묻는 질문
목차
제1장 조사 방법과 범위
제2장 주요 요약
제3장 업계 인사이트
제4장 경쟁 구도
제5장 시장 추정 및 예측 : 제품 유형별, 2022-2035
제6장 시장 추정 및 예측 : 유통 채널별, 2022-2035
제7장 시장 추정 및 예측 : 최종 용도별, 2022-2035
제8장 시장 추정 및 예측 : 지역별, 2022-2035
제9장 기업 개요
KSM 26.05.06The Global Food Cans Market was valued at USD 115.9 billion in 2025 and is estimated to grow at a CAGR of 3.2% to reach USD 158.4 billion by 2035.

Rising demand for processed and canned foods, coupled with the rapid growth of the ready-to-eat (RTE) segment, is a key factor supporting market growth. Consumers are seeking products that offer long shelf life, easy storage, and portability, prompting manufacturers to innovate with durable and visually appealing can designs. The shift toward sustainable packaging also contributes to market expansion, as eco-friendly cans gain traction among environmentally conscious buyers. Technological advancements in can manufacturing, including enhanced materials and preservation methods, are enabling producers to offer stronger, safer, and more attractive packaging options, reinforcing the market's upward trajectory while catering to evolving consumer lifestyles.
| Market Scope | |
|---|---|
| Start Year | 2025 |
| Forecast Year | 2026-2035 |
| Start Value | $115.9 Billion |
| Forecast Value | $158.4 Billion |
| CAGR | 3.2% |
The online and e-commerce channels segment is expected to grow at a CAGR of 4.4% through 2035, as increasing internet penetration and smartphone usage allow consumers to purchase canned products for home delivery. E-commerce platforms appeal to busy, tech-savvy consumers by offering wide product selections, competitive pricing, and subscription-based promotions, driving higher online sales.
The ready-to-eat meals segment is projected to grow at a CAGR of 4.5% through 2035, fueled by demand for convenient, nutritious, and portable food solutions. Urbanization, busy lifestyles, and the need for time-saving meal options are encouraging manufacturers to produce RTE canned meals with appealing packaging, rich taste, and nutritional value.
North America Food Cans Market accounted for a 31.4% share in 2025. Growth in this region is supported by expanding retail, food processing, and RTE meal sectors. Consumers increasingly prefer packaging that is convenient, environmentally friendly, and maintains product quality over time. The market is driven by strong demand for packaged foods offering extended shelf life, nutritional value, and sustainable packaging, combined with a robust e-commerce ecosystem that enhances accessibility.
Key companies in the Global Food Cans Market include Nestle S.A., Conagra Brands, Campbell Soup Company, Del Monte Foods, Kraft Heinz Company, Hormel Foods Corporation, Dole Food Company, B&G Foods, General Mills, Grupo Calvo, Danish Crown, JBS S.A., Dongwon Industries, Rhodes Food Group, Bolton Group, Ayam Brand, and Bonduelle Group. Companies in the Food Cans Market are leveraging strategies such as innovation in can design and material selection to enhance shelf life, durability, and visual appeal. They are focusing on sustainable and recyclable packaging to address environmental concerns and strengthen brand perception. Expanding online sales channels and strategic partnerships with food manufacturers improve market reach and consumer accessibility. Additionally, firms are adopting digital marketing and subscription-based services to engage busy consumers. Portfolio diversification, including RTE meal cans and specialty product packaging, allows companies to cater to evolving dietary preferences.
Table of Contents
Chapter 1 Methodology and Scope
- 1.1 Market scope and definition
- 1.2 Research design
- 1.2.1 Research approach
- 1.2.2 Data collection methods
- 1.3 Data mining sources
- 1.3.1 Global
- 1.3.2 Regional/Country
- 1.4 Base estimates and calculations
- 1.4.1 Base year calculation
- 1.4.2 Key trends for market estimation
- 1.5 Primary research and validation
- 1.5.1 Primary sources
- 1.6 Forecast model
- 1.7 Research assumptions and limitations
Chapter 2 Executive Summary
- 2.1 Industry 360° synopsis, 2022 - 2035
- 2.2 Key market trends
- 2.2.1 Product type trends
- 2.2.2 Distribution channel trends
- 2.2.3 End use trends
- 2.2.4 Regional trends
- 2.3 TAM analysis, 2026-2035
- 2.4 CXO perspectives: Strategic imperatives
Chapter 3 Industry Insights
- 3.1 Industry ecosystem analysis
- 3.1.1 Supplier landscape
- 3.1.2 Profit margin analysis
- 3.1.3 Cost structure
- 3.1.4 Value addition at each stage
- 3.1.5 Factor affecting the value chain
- 3.1.6 Disruptions
- 3.2 Industry impact forces
- 3.2.1 Growth drivers
- 3.2.1.1 Increase in shelf-stable packaging solutions
- 3.2.1.2 Rising demand for sustainable packaging
- 3.2.1.3 Growth in the ready-to-eat (RTE) food segment
- 3.2.1.4 Increasing demand for processed and canned foods
- 3.2.1.5 Technological advancements in can design
- 3.2.2 Industry pitfalls and challenges
- 3.2.2.1 Competition from alternative packaging
- 3.2.2.2 Fluctuating raw material prices
- 3.2.3 Market opportunities
- 3.2.3.1 Expansion in emerging markets
- 3.2.3.2 Innovations in smart packaging
- 3.2.1 Growth drivers
- 3.3 Growth potential analysis
- 3.4 Regulatory landscape
- 3.4.1 North America
- 3.4.2 Europe
- 3.4.3 Asia Pacific
- 3.4.4 Latin America
- 3.4.5 Middle East & Africa
- 3.5 Porter's analysis
- 3.6 PESTEL analysis
- 3.7 Technology and innovation landscape
- 3.7.1 Current technological trends
- 3.7.2 Emerging technologies
- 3.8 Price trends
- 3.8.1 By region
- 3.8.2 By product
- 3.9 Pricing Strategies
- 3.10 Emerging Business Models
- 3.11 Compliance Requirements
- 3.12 Patent and IP analysis
Chapter 4 Competitive Landscape, 2025
- 4.1 Introduction
- 4.2 Company market share analysis
- 4.2.1 By region
- 4.2.1.1 North America
- 4.2.1.2 Europe
- 4.2.1.3 Asia Pacific
- 4.2.1.4 Latin America
- 4.2.1.5 Middle East & Africa
- 4.2.1 By region
- 4.3 Competitive benchmarking of key players
- 4.3.1 Financial performance comparison
- 4.3.1.1 Revenue
- 4.3.1.2 Profit margin
- 4.3.1.3 R&D
- 4.3.2 Product portfolio comparison
- 4.3.2.1 Product range breadth
- 4.3.2.2 Technology
- 4.3.2.3 Innovation
- 4.3.3 Geographic presence comparison
- 4.3.3.1 Global footprint analysis
- 4.3.3.2 Service network coverage
- 4.3.3.3 Market penetration by region
- 4.3.4 Competitive positioning matrix
- 4.3.4.1 Leaders
- 4.3.4.2 Challengers
- 4.3.4.3 Followers
- 4.3.4.4 Niche players
- 4.3.1 Financial performance comparison
- 4.4 Key developments
- 4.4.1 Mergers and acquisitions
- 4.4.2 Partnerships and collaborations
- 4.4.3 Technological advancements
- 4.4.4 Expansion and investment strategies
- 4.4.5 Digital transformation initiatives
- 4.5 Emerging/ startup competitors landscape
Chapter 5 Market Estimates and Forecast, By Product Type, 2022 - 2035 (USD Billion & Kilo Tons)
- 5.1 Key trends
- 5.2 Canned vegetables
- 5.2.1 Tomatoes
- 5.2.2 Corn
- 5.2.3 Beans
- 5.2.4 Peas
- 5.2.5 Mixed vegetables
- 5.2.6 Mushrooms
- 5.2.7 Others
- 5.3 Canned fish & seafood
- 5.3.1 Tuna
- 5.3.2 Salmon
- 5.3.3 Sardines
- 5.3.4 Mackerel
- 5.3.5 Anchovies
- 5.3.6 Shellfish
- 5.3.7 Others
- 5.4 Canned fruits
- 5.4.1 Peaches
- 5.4.2 Pineapple
- 5.4.3 Mixed fruits
- 5.4.4 Others
- 5.5 Canned meat
- 5.5.1 Chicken
- 5.5.2 Beef
- 5.5.3 Pork
- 5.5.4 Others
- 5.6 Ready-to-eat meals
- 5.6.1 Soups
- 5.6.2 Stews
- 5.6.3 Pasta
- 5.6.4 Others
- 5.7 Others
Chapter 6 Market Estimates and Forecast, By Distribution Channel, 2022 - 2035 (USD Billion & Kilo Tons)
- 6.1 Key trends
- 6.2 Retail
- 6.2.1 Supermarkets and hypermarkets
- 6.2.2 Convenience stores
- 6.2.3 Specialty food stores
- 6.3 Online/E-commerce
- 6.3.1 Foodservice
- 6.3.2 Restaurants
- 6.3.3 Hotels & catering
- 6.3.4 Institutional
Chapter 7 Market Estimates and Forecast, By End Use, 2022 - 2035 (USD Billion & Kilo Tons)
- 7.1 Key trends
- 7.2 Household/consumer
- 7.3 Food processing industry
- 7.4 Institutional & bulk users
Chapter 8 Market Estimates and Forecast, By Region, 2022 - 2035 (USD Billion & Kilo Tons)
- 8.1 Key trends
- 8.2 North America
- 8.2.1 U.S.
- 8.2.2 Canada
- 8.3 Europe
- 8.3.1 Germany
- 8.3.2 UK
- 8.3.3 France
- 8.3.4 Spain
- 8.3.5 Italy
- 8.3.6 Netherlands
- 8.4 Asia Pacific
- 8.4.1 China
- 8.4.2 India
- 8.4.3 Japan
- 8.4.4 Australia
- 8.4.5 South Korea
- 8.5 Latin America
- 8.5.1 Brazil
- 8.5.2 Mexico
- 8.5.3 Argentina
- 8.6 Middle East and Africa
- 8.6.1 South Africa
- 8.6.2 Saudi Arabia
- 8.6.3 UAE
Chapter 9 Company Profiles
- 9.1 Global Key Players
- 9.1.1 Conagra Brands
- 9.1.2 Campbell Soup Company
- 9.1.3 Kraft Heinz Company
- 9.1.4 Hormel Foods Corporation
- 9.1.5 Nestle S.A.
- 9.1.6 General Mills
- 9.2 Regional Key Players
- 9.2.1 North America
- 9.2.1.1 Del Monte Foods
- 9.2.1.2 B&G Foods
- 9.2.1.3 Dole Food Company
- 9.2.2 Europe
- 9.2.2.1 Grupo Calvo
- 9.2.2.2 Danish Crown
- 9.2.2.3 Rhodes Food Group
- 9.2.2.4 Bolton Group
- 9.2.2.5 Bonduelle Group
- 9.2.3 Asia Pacific
- 9.2.3.1 Dongwon Industries
- 9.2.3.2 JBS S.A.
- 9.2.1 North America
- 9.3 Niche / Disruptors
- 9.3.1 Ayam Brand
