
|
시장보고서
상품코드
2061433
산업용 버너 시장 기회, 성장 촉진요인, 업계 동향 분석 및 예측(2026-2035년)Industrial Burner Market Opportunity, Growth Drivers, Industry Trend Analysis, and Forecast 2026 - 2035 |
||||||
세계의 산업용 버너 시장은 2025년에 71억 달러로 추계되고 있으며, CAGR 5.3%로 성장하며, 2035년까지 119억 달러에 달할 것으로 예측됩니다.

에너지 효율이 높은 연소 기술에 대한 수요가 증가하고, 산업 배출 기준이 점점 더 엄격해지고 있는 것이 시장 확대를 지원하는 주요 요인이 되고 있습니다. 각 업계에서는 연비 향상, 운영 비용 절감, 환경에 미치는 영향 최소화를 위해 첨단 버너 시스템을 적극적으로 도입하고 있습니다. 산업 부문의 탄소 배출량 감축과 변화하는 환경 규제의 준수가 점점 더 중요시되는 가운데, 첨단 연소 제어 기능과 배출 감축 기능을 갖춘 최신 버너 기술의 도입이 가속화되고 있습니다. 산업 시설에서는 운영 성능을 향상시키기 위해 첨단 모니터링 기술, 자동 연소 관리 시스템, 디지털 제어 플랫폼을 통합한 저배출·초저NOx 버너 시스템에 대한 투자가 증가하고 있습니다. 산업용 버너는 고온의 산업 공정을 효율적으로 지원할 수 있는 능력을 갖추고 있으며, 여러 제조 분야에서 계속해서 중요한 역할을 수행하고 있습니다. 지속가능한 산업 운영과 청정 에너지 도입에 대한 전 세계적인 관심이 높아짐에 따라 제조업체들은 기존의 연소 설비를 기술적으로 첨단이고 친환경적인 버너 솔루션으로 교체하도록 더욱 촉진받고 있습니다.
| 시장 범위 | |
|---|---|
| 시작연도 | 2025년 |
| 예측 기간 | 2026-2035년 |
| 시작 금액 | 71억 달러 |
| 예측 금액 | 119억 달러 |
| CAGR | 5.3% |
2025년 기준으로 재생식 버너 부문은 시장 점유율 25.4%를 차지하며 18억 달러 규모의 시장을 기록했습니다. 해당 부문은 2026-2035년 연평균 성장률(CAGR) 5.9%로 성장할 것으로 전망됩니다. 재생식 버너 시스템은 뛰어난 열회수 능력과 탁월한 열효율 성능 덕분에 시장에서 계속해서 높은 지지를 얻고 있습니다. 이러한 시스템은 배열을 회수·재활용하도록 설계되어 있으며, 기존의 버너 기술에 비해 연료 소비를 대폭 절감하고 운영 효율을 향상시킵니다. 고온 산업 분야에서는 에너지 사용 최적화, 배출량 감축 및 장기적인 운영 비용 절감을 위해 재생식 버너에 대한 의존도가 높아지고 있습니다. 또한 이러한 첨단 연소 사이클 구성 덕분에 산업 생산 환경 전반에서 에너지 회수 효율을 극대화하는 동시에 정확한 온도 제어 기능도 지원합니다.
가스 버너 부문은 2025년에 55.10%의 시장 점유율을 차지하며, 2026-2035년 연평균 성장률(CAGR) 5.4%로 성장할 것으로 전망됩니다. 이 부문은 천연가스의 더 깨끗한 연소 특성, 낮은 배출량, 그리고 주요 산업 지역의 광범위한 가스 공급 인프라 구축 덕분에 계속해서 시장을 독점하고 있습니다. 가스 버너 시스템은 대체 연료 기반 시스템과 비교하여 연소 정밀도 향상, 작동 응답 속도 향상, 그리고 유지보수 요구 사항 감소를 실현합니다. 산업 운영업체들은 배출량 감축 목표 달성, 연료 효율 향상, 그리고 더욱 엄격해진 환경 기준 준수를 추구하는 과정에서 천연가스 구동 버너 기술로의 전환을 가속화하고 있습니다. 기존의 액체 및 고체 연료 연소 시스템과 비교할 때, 천연가스 버너 기술은 미세먼지 및 온실가스 관련 배출량을 대폭 줄여줍니다.
미국의 산업용 버너 시장은 2025년에 15억 5,000만 달러 규모에 달하며, 2026-2035년 연평균 성장률(CAGR) 5.3%를 기록하며 북미 전체에서 주도적인 위치를 유지할 것으로 전망됩니다. 활발한 산업 생산 활동, 확고히 자리 잡은 석유화학 부문, 그리고 엄격한 환경 규제를 준수해야 하는 요건이 미국 전역의 시장 수요를 지속적으로 견인하고 있습니다. 다양한 분야의 산업 시설에서는 에너지 효율 향상, 연료 소비량 절감 및 운영 성과 강화를 위해 첨단 버너 기술에 막대한 투자가 이루어지고 있습니다. 연소 기술, 산소 최적화 제어 및 가변 연소 기능을 갖춘 고효율 버너 시스템의 도입 확대는 산업 사업자들이 연료비를 대폭 절감하는 동시에 환경 지속가능성 목표를 달성하는 데 기여하고 있습니다. 또한 산업 운영 비용 절감과 생산 인프라 현대화에 대한 관심이 높아짐에 따라 미국 시장에서 첨단 산업용 버너 장비에 대한 수요가 더욱 가속화되고 있습니다.
자주 묻는 질문
목차
제1장 조사 방법과 범위
제2장 개요
제3장 업계 인사이트
제4장 경쟁 구도
제5장 시장 추산·예측 : 유형별, 2022-2035년
제6장 시장 추산·예측 : 연료 유형별, 2022-2035년
제7장 시장 추산·예측 : 조작 모드별, 2022-2035년
제8장 시장 추산·예측 : 버너 설계별, 2022-2035년
제9장 시장 추산·예측 : 용도별, 2022-2035년
제10장 시장 추산·예측 : 최종 용도 산업별, 2022-2035년
제11장 시장 추산·예측 : 유통 채널별, 2022-2035년
제12장 시장 추산·예측 : 지역별, 2022-2035년
제13장 기업 개요
KSA 26.06.24The Global Industrial Burner Market was estimated at USD 7.1 billion in 2025 and is estimated to grow at a CAGR of 5.3% to reach USD 11.9 billion by 2035.
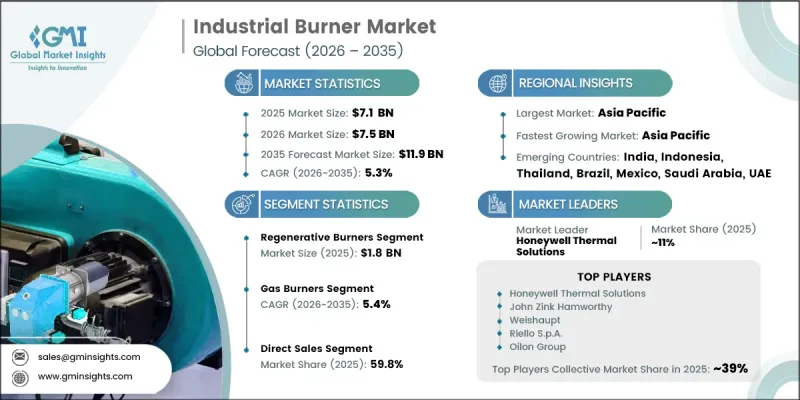
Rising demand for energy-efficient combustion technologies and increasingly stringent industrial emission standards are major factors supporting market expansion. Industries are actively adopting advanced burner systems to improve fuel efficiency, reduce operational costs, and minimize environmental impact. The growing emphasis on lowering industrial carbon emissions and complying with evolving environmental regulations is accelerating the deployment of modern burner technologies equipped with enhanced combustion controls and emission reduction capabilities. Industrial facilities are increasingly investing in low-emission and ultra-low NOx burner systems integrated with advanced monitoring technologies, automated combustion management systems, and digital control platforms to improve operational performance. Industrial burners continue to play a critical role across multiple manufacturing sectors due to their ability to support high-temperature industrial processes efficiently. Growing global focus on sustainable industrial operations and clean energy adoption is further encouraging manufacturers to replace traditional combustion equipment with technologically advanced and environmentally responsible burner solutions.
| Market Scope | |
|---|---|
| Start Year | 2025 |
| Forecast Year | 2026-2035 |
| Start Value | $7.1 Billion |
| Forecast Value | $11.9 Billion |
| CAGR | 5.3% |
The regenerative burners segment accounted for 25.4% share in 2025 and generated USD 1.8 billion. The segment is anticipated to expand at a CAGR of 5.9% from 2026 to 2035. Regenerative burner systems continue to gain strong market acceptance because of their advanced heat recovery capabilities and exceptional thermal efficiency performance. These systems are designed to capture and reuse exhaust heat, allowing significant fuel savings and improved operational efficiency compared to conventional burner technologies. High-temperature industrial applications increasingly rely on regenerative burners to optimize energy usage, reduce emissions, and lower long-term operating expenses. Their advanced combustion cycle configuration also supports accurate temperature regulation while maximizing energy recovery efficiency across industrial production environments.
The gas burners segment held 55.10% share in 2025 and is expected to grow at a CAGR of 5.4% during 2026-2035. The segment continues to dominate the market due to the cleaner combustion profile of natural gas, lower emissions output, and the broad availability of gas supply infrastructure across major industrial regions. Gas burner systems provide improved combustion precision, faster operational response, and reduced maintenance requirements compared to alternative fuel-based systems. Industrial operators are increasingly transitioning toward natural gas-powered burner technologies as they pursue lower emissions targets, improved fuel efficiency, and compliance with stricter environmental standards. Compared to conventional liquid and solid fuel combustion systems, natural gas burner technologies significantly reduce emissions associated with particulate matter and greenhouse gases.
U.S. Industrial Burner Market was valued at USD 1.55 billion in 2025 and is projected to grow at a CAGR of 5.3% from 2026 to 2035, maintaining its leading position across North America. Strong industrial manufacturing activity, a well-established petrochemical sector, and strict environmental compliance requirements continue to drive market demand throughout the country. Industrial facilities across multiple sectors are investing heavily in advanced burner technologies to improve energy efficiency, lower fuel consumption, and strengthen operational performance. Growing adoption of high-efficiency burner systems equipped with regenerative technologies, oxygen optimization controls, and variable firing capabilities is helping industrial operators achieve substantial fuel savings while supporting environmental sustainability objectives. In addition, increasing focus on reducing industrial operating costs and modernizing production infrastructure is further accelerating demand for advanced industrial burner equipment in the U.S. market.
Major companies operating in the Global Industrial Burner Market include Alfa Laval, Baltur S.p.A., Emerson Electric Co., Faber Burner Company, Five Group, Honeywell Thermal Solutions, Hurst Boiler & Welding Company, John Zink Hamworthy, Limpsfield Combustion Engineering, Miura America Co., Oilon Group, Power Flame Incorporated, Riello S.p.A., SAACKE GmbH, Santin Industrial, Selas Heat Technology, Wayne Combustion Systems, and Weishaupt. Companies operating in the industrial burner industry are implementing several strategic initiatives to strengthen their market position and expand global reach. Leading manufacturers are increasing investments in research and development activities focused on energy-efficient combustion technologies, ultra-low emission systems, and smart digital burner controls. Businesses are also prioritizing product innovation aimed at improving fuel efficiency, operational automation, and environmental compliance capabilities. Strategic partnerships, acquisitions, and collaborations with industrial facility operators are helping companies expand their customer base and strengthen distribution networks. In addition, manufacturers are investing in predictive maintenance technologies, advanced monitoring systems, and integrated combustion management platforms to improve equipment reliability and long-term operational performance. The growing industry focus on sustainable manufacturing, clean energy adoption, and industrial decarbonization is further encouraging companies to introduce next-generation industrial burner solutions tailored to evolving regulatory and operational requirements.
Table of Contents
Chapter 1 Methodology and Scope
- 1.1 Market scope and definition
- 1.2 Research design
- 1.2.1 Research approach
- 1.2.2 Data collection methods
- 1.3 Data mining sources
- 1.3.1 Global
- 1.3.2 Regional/Country
- 1.4 Base estimates and calculations
- 1.4.1 Base year calculation
- 1.4.2 Key trends for market estimation
- 1.5 Primary research and validation
- 1.5.1 Primary sources
- 1.6 Forecast model
- 1.7 Research assumptions and limitations
Chapter 2 Executive Summary
- 2.1 Industry 360° synopsis
- 2.2 Key market trends
- 2.2.1 Regional
- 2.2.2 Type
- 2.2.3 Fuel Type
- 2.2.4 Mode of Operation
- 2.2.5 Burner Design
- 2.2.6 Application
- 2.2.7 End Use Industry
- 2.2.8 Distribution channel
Chapter 3 Industry Insights
- 3.1 Industry ecosystem analysis
- 3.1.1 Supplier landscape
- 3.1.2 Profit margin
- 3.1.3 Value addition at each stage
- 3.1.4 Factor affecting the value chain
- 3.2 Industry impact forces
- 3.2.1 Growth drivers
- 3.2.2 Industry pitfalls & challenges
- 3.2.3 Opportunities
- 3.3 Growth potential analysis
- 3.3.1 Price volatility and market unpredictability
- 3.3.2 Quality assurance and equipment reliability concerns
- 3.4 Future market trends
- 3.5 Technology and innovation landscape
- 3.5.1 Current technological trends
- 3.5.2 Emerging technologies
- 3.6 Pricing Analysis (Driven by Primary Research)
- 3.6.1 Historical Price Trend Analysis (Driven by Primary Research)
- 3.6.2 Pricing Strategy by Player Type (Premium/Value/Cost-plus) (Driven by Primary Research)
- 3.6.3 Average Selling Price by Type
- 3.7 Regulatory landscape
- 3.7.1 Emission Standards & Environmental Regulations (EPA, EU ETS, EU EcoDesign Directive)
- 3.7.2 Safety & Product Standards (NFPA 86, EN 676, ATEX)
- 3.7.3 Energy Efficiency Directives by Region
- 3.8 Porter's analysis
- 3.9 PESTEL analysis
- 3.10 Trade Data Analysis (Driven by Primary Research)
- 3.10.1 Import/Export Volume & Value Trends (Driven by Primary Research)
- 3.10.2 Key Trade Corridors & Tariff Impact (Driven by Primary Research)
- 3.10.3 HS Code Classification & Trade Flow Analysis
- 3.11 Impact of AI & Generative AI on the Market
- 3.11.1 AI-Driven Disruption of Existing Business Models
- 3.11.2 GenAI Use Cases & Adoption Roadmap by Segment
- 3.11.3 Risks, Limitations & Regulatory Considerations
- 3.12 Capacity & Production Landscape (Driven by Primary Research)
- 3.12.1 Installed Manufacturing Capacity by Region & Key Producer (Driven by Primary Research)
- 3.12.2 Capacity Utilization Rates & Expansion Pipelines (Driven by Primary Research)
Chapter 4 Competitive Landscape, 2025
- 4.1 Introduction
- 4.2 Company market share analysis
- 4.2.1 By region
- 4.2.1.1 North America
- 4.2.1.2 Europe
- 4.2.1.3 Asia Pacific
- 4.2.1.4 Latin America
- 4.2.1.5 Middle East and Africa
- 4.2.1 By region
- 4.3 Company matrix analysis
- 4.4 Competitive analysis of major market players
- 4.5 Competitive positioning matrix
- 4.6 Key developments
- 4.6.1 Mergers & acquisitions
- 4.6.2 Partnerships & collaborations
- 4.6.3 New product launches
- 4.6.4 Expansion plans
Chapter 5 Market Estimates & Forecast, By Type, 2022 - 2035, (USD Billion) (Thousand Units)
- 5.1 Key trends
- 5.2 Regenerative burners
- 5.3 Radiant tube burners
- 5.4 Air staged burners
- 5.5 Self-recuperative burners
- 5.6 Others (flat flame burners etc.)
Chapter 6 Market Estimates & Forecast, By Fuel Type, 2022 - 2035, (USD Billion) (Thousand Units)
- 6.1 Key trends
- 6.2 Gas burners
- 6.3 Oil burners
- 6.4 Dual fuel burners
Chapter 7 Market Estimates & Forecast, By Mode of Operation, 2022 - 2035, (USD Billion) (Thousand Units)
- 7.1 Key trends
- 7.2 Manual
- 7.3 Semi-automatic
- 7.4 Fully automatic
Chapter 8 Market Estimates & Forecast, By Burner Design, 2022 - 2035, (USD Billion) (Thousand Units)
- 8.1 Key trends
- 8.2 Monoblock
- 8.3 Duoblock
Chapter 9 Market Estimates & Forecast, By Application, 2022 - 2035, (USD Billion) (Thousand Units)
- 9.1 Key trends
- 9.2 Process heating
- 9.3 Drying
- 9.4 Boilers
- 9.5 Incineration
- 9.6 Furnaces
- 9.7 Others (space heating, etc.)
Chapter 10 Market Estimates & Forecast, By End Use Industry, 2022 - 2035, (USD Billion) (Thousand Units)
- 10.1 Key trends
- 10.2 Power generation
- 10.3 Chemical and petrochemical
- 10.4 Metalworking
- 10.5 Food processing
- 10.6 Textile
- 10.7 Others (pulp and paper etc.)
Chapter 11 Market Estimates & Forecast, By Distribution Channel, 2022 - 2035, (USD Billion) (Thousand Units)
- 11.1 Key trends
- 11.2 Direct sales
- 11.3 Indirect sales
Chapter 12 Market Estimates and Forecast, By Region, 2022 - 2035 (USD Billion) (Thousand Units)
- 12.1 Key trends
- 12.2 North America
- 12.2.1 U.S.
- 12.2.2 Canada
- 12.3 Europe
- 12.3.1 Germany
- 12.3.2 UK
- 12.3.3 France
- 12.3.4 Italy
- 12.3.5 Spain
- 12.4 Asia Pacific
- 12.4.1 China
- 12.4.2 Japan
- 12.4.3 India
- 12.4.4 Australia
- 12.4.5 South Korea
- 12.5 Latin America
- 12.5.1 Brazil
- 12.5.2 Mexico
- 12.5.3 Argentina
- 12.6 Middle East and Africa
- 12.6.1 South Africa
- 12.6.2 Saudi Arabia
- 12.6.3 UAE
Chapter 13 Company Profiles
- 13.1 Top Global Player
- 13.1.1 Honeywell Thermal Solutions
- 13.1.2 Fives Group
- 13.1.3 Alfa Laval
- 13.1.4 Emerson Electric Co.
- 13.1.5 John Zink Hamworthy
- 13.1.6 Weishaupt
- 13.2 Regional Player
- 13.2.1 Oilon Group
- 13.2.2 Limpsfield Combustion Engineering
- 13.2.3 Faber Burner Company
- 13.2.4 Power Flame Incorporated
- 13.2.5 Selas Heat Technology
- 13.2.6 Riello S.p.A.
- 13.2.7 SAACKE GmbH
- 13.3 Emerging Players
- 13.3.1 Miura America Co.
- 13.3.2 Hurst Boiler & Welding Company
- 13.3.3 Wayne Combustion Systems
- 13.3.4 Baltur S.p.A.
- 13.3.5 Santin Industrial
