
|
시장보고서
상품코드
2061447
중고 트랙터 시장 기회, 성장요인, 업계 동향 분석 및 예측(2026-2035년)Used Tractors Market Opportunity, Growth Drivers, Industry Trend Analysis, and Forecast 2026 - 2035 |
||||||
세계의 중고 트랙터 시장은 2025년에 354억 달러로 평가되고 CAGR 5.1%로 성장하며, 2035년까지 586억 달러에 달할 것으로 추정되고 있습니다.

농업의 기계화와 비용 효율이 높은 농업 솔루션에 대한 수요가 증가함에 따라 세계 시장의 꾸준한 성장이 지속되고 있습니다. 농가는 생산성 향상, 노동력 의존도 감소, 작업 시간 단축, 그리고 농업 활동 전반의 효율화를 도모하기 위해 기계화된 설비를 점점 더 많이 도입하고 있습니다. 중고 트랙터는 특히 합리적인 가격의 기계화 솔루션을 찾는 중소규모 농가에게 신형 기계에 대한 경제적인 대안으로 부상하고 있습니다. 또한 농업의 현대화를 촉진하고 농업기계 도입에 대한 인센티브를 제공하는 정부의 지원책도 시장에 긍정적인 영향을 미치고 있습니다. 세계 인구 증가에 따른 식량 생산 확대에 대한 압박이 커짐에 따라 효율적인 농업 운영과 재배 생산성 향상의 필요성이 더욱 시급해지고 있습니다. 농지 이용 경쟁이 치열해지는 가운데, 농가는 밭 작업을 최적화하고 운영 비용을 절감하기 위해 신뢰성이 높고 가격도 합리적인 중고 트랙터에 대한 투자를 점점 더 늘리고 있습니다. 판매 대리점 네트워크 확대, 재생 기준 개선, 온라인 마켓플레이스 접근성 향상 또한 선진국 및 개발도상국의 농업 경제권 전반에 걸쳐 시장 침투 강화와 고객 접근성 확대에 기여하고 있습니다.
| 시장 범위 | |
|---|---|
| 시작연도 | 2025년 |
| 예측 기간 | 2026-2035년 |
| 개시 금액 | 354억 달러 |
| 예측액 | 586억 달러 |
| CAGR | 5.1% |
농업용 트랙터 시장은 2025년에 254억 달러 규모를 기록하며, 2026-2035년 연평균 성장률(CAGR) 5.5%로 성장할 것으로 전망됩니다. 트랙터는 현대 농업 경영에 있으며, 여전히 없어서는 안 될 장비이기 때문에 이 부문은 계속해서 시장을 주도하고 있습니다. 중고 농업용 트랙터는 경운, 경작, 파종, 수확, 자재 운반 등의 작업에 널리 이용되고 있습니다. 특히 가격에 민감한 농업 시장에서 농가는 새 기계 대신 비용 대비 효과가 높은 대안으로 중고 트랙터를 점점 더 선호하고 있습니다. 또한 다양한 출력 등급과 사양 구성이 마련되어 있으며, 농가는 자신의 작업 조건, 농장 규모, 작물 재배 요구 사항에 맞는 트랙터를 선택할 수 있습니다.
31-100마력 부문은 2025년에 40.2%의 시장 점유율을 차지하며, 2035년까지 연평균 성장률(CAGR) 5.3%로 성장할 것으로 전망됩니다. 이 마력 범위의 트랙터는 다용도성과 중소규모 농업 용도에 적합하다는 점 때문에 매우 인기가 높습니다. 이 트랙터들은 연비 효율, 출력, 유지비 및 전반적인 가동 성능 사이에서 효과적인 균형을 제공합니다. 이 카테고리는 폭넓은 농업 기능을 지원하면서도 가격이 합리적이며, 다양한 농업 조건과 부착 장치에 대한 적응성이 뛰어나기 때문에 농가로부터 계속해서 지지를 받고 있습니다.
미국의 중고 트랙터 시장은 2025년에 92억 달러 규모에 달하며, 2026-2035년 연평균 성장률(CAGR) 5.8%를 기록할 것으로 전망됩니다. 해당 국가의 시장 성장은 대규모 농업 경영, 확립된 농업 인프라, 그리고 상업 농업 사업자들의 지속적인 기계 교체 주기에 힘입어 이루어지고 있습니다. 판매점 네트워크, 경매 시스템, 디지털 기기 마켓플레이스를 통해 고품질 중고 트랙터가 풍부하게 공급되고 있는 점은 시장 활동을 더욱 활성화시키고, 고객이 합리적인 가격의 기계 솔루션을 이용하기 쉽게 하고 있습니다.
자주 묻는 질문
목차
제1장 조사 방법과 범위
제2장 개요
제3장 업계 인사이트
제4장 경쟁 구도
제5장 시장 추산·예측 : 유형별, 2022-2035년
제6장 시장 추산·예측 : 마력별, 2022-2035년
제7장 시장 추산·예측 : 연료별, 2022-2035년
제8장 시장 추산·예측 : 최종사용자별, 2022-2035년
제9장 시장 추산·예측 : 유통 채널별, 2022-2035년
제10장 시장 추산·예측 : 지역별, 2022-2035년
제11장 기업 개요
KSA 26.06.24The Global Used Tractors Market was valued at USD 35.4 billion in 2025 and is estimated to grow at a CAGR of 5.1% to reach USD 58.6 billion by 2035.
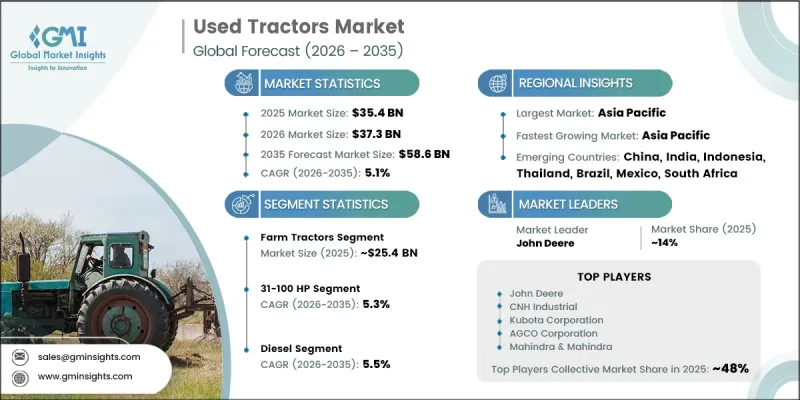
Rising demand for agricultural mechanization and cost-efficient farming solutions continues to support steady expansion of the market worldwide. Farmers are increasingly adopting mechanized equipment to improve productivity, reduce labor dependency, save operational time, and enhance efficiency across agricultural activities. Used tractors have emerged as an economical alternative to new machinery, particularly among small and medium-sized farmers seeking affordable mechanization solutions. The market is also benefiting from supportive government initiatives promoting farm modernization and providing incentives for agricultural equipment adoption. Growing pressure to increase food production due to rising global population levels is further accelerating the need for efficient farming operations and improved cultivation productivity. As agricultural land utilization intensifies, farmers are increasingly investing in reliable and affordable used tractors to optimize field operations and reduce operating costs. Expanding dealership networks, improved refurbishment standards, and increasing access to online equipment marketplaces are also contributing to stronger market penetration and wider customer accessibility across developed and developing agricultural economies.
| Market Scope | |
|---|---|
| Start Year | 2025 |
| Forecast Year | 2026-2035 |
| Start Value | $35.4 Billion |
| Forecast Value | $58.6 Billion |
| CAGR | 5.1% |
The farm tractors segment generated USD 25.4 billion in 2025 and is expected to grow at a CAGR of 5.5% from 2026 to 2035. The segment continues to dominate the market because tractors remain essential equipment for modern agricultural operations. Used farm tractors are widely utilized for plowing, cultivation, planting, harvesting, and material transportation activities. Farmers increasingly prefer used tractors as cost-effective alternatives to new machinery, particularly in price-sensitive agricultural markets. The availability of multiple horsepower categories and equipment configurations also allows farmers to select tractors suited to their operational requirements, farm size, and crop cultivation needs.
The 31-100 HP segment accounted for 40.2% share in 2025 and is anticipated to grow at a CAGR of 5.3% through 2035. Tractors within this horsepower range are highly preferred due to their operational versatility and suitability for small and medium-sized farming applications. These tractors offer an effective balance between fuel efficiency, power output, maintenance costs, and overall operational performance. Farmers continue to favor this category because it supports a broad range of agricultural functions while remaining affordable and adaptable to different farming conditions and equipment attachments.
United States Used Tractors Market generated USD 9.2 billion in 2025 and is expected to register a CAGR of 5.8% from 2026 to 2035. Growth in the country is supported by large-scale agricultural operations, established farming infrastructure, and continuous equipment replacement cycles among commercial farming businesses. Strong availability of quality used tractors through dealership networks, auction systems, and digital equipment marketplaces continues to strengthen market activity and improve customer access to affordable machinery solutions.
Major companies operating in the Global Used Tractors Market include John Deere, Kubota Corporation, Mahindra & Mahindra, CNH Industrial, AGCO Corporation, Massey Ferguson, Claas Group, Escorts Kubota, Yanmar, Kioti, TYM Tractors, Argo Tractors, SDF Group, Valtra, Sonalika, Powertrac, LS Mtron, Dongfeng Agricultural, Foton Tractors, Belarus, and Lovol. Companies operating in the used tractors market are adopting several strategic initiatives to strengthen their market position and expand customer reach. A major focus area involves expanding dealership and distribution networks to improve equipment availability across rural and agricultural regions. Manufacturers and dealers are also investing in certified refurbishment programs to improve product quality, reliability, and customer confidence in used equipment purchases. Digital transformation strategies, including online marketplaces and virtual equipment inspection platforms, are helping companies enhance customer accessibility and streamline the purchasing process. Businesses are further strengthening financing and leasing options to make used tractors more affordable for small and medium-sized farmers. Strategic partnerships with agricultural cooperatives, local distributors, and financial institutions are also supporting broader market penetration.
Table of Contents
Chapter 1 Methodology and Scope
- 1.1 Market scope and definition
- 1.2 Research design
- 1.2.1 Research approach
- 1.2.2 Data collection methods
- 1.3 Data mining sources
- 1.3.1 Global
- 1.3.2 Regional/Country
- 1.4 Base estimates and calculations
- 1.4.1 Base year calculation
- 1.4.2 Key trends for market estimation
- 1.5 Primary research and validation
- 1.5.1 Primary sources
- 1.6 Forecast model
- 1.7 Research assumptions and limitations
Chapter 2 Executive Summary
- 2.1 Industry 360° synopsis
- 2.2 Key market trends
- 2.2.1 Regional
- 2.2.2 Type
- 2.2.3 Horsepower
- 2.2.4 Fuel
- 2.2.5 End Users
- 2.2.6 Distribution channel
Chapter 3 Industry Insights
- 3.1 Industry ecosystem analysis
- 3.1.1 Supplier landscape
- 3.1.2 Profit margin
- 3.1.3 Value addition at each stage
- 3.1.4 Factor affecting the value chain
- 3.2 Industry impact forces
- 3.2.1 Growth drivers
- 3.2.1.1 Growing adoption of rental and leasing models
- 3.2.1.2 Rising mechanization in emerging agricultural markets
- 3.2.1.3 Expansion of online platforms and digital marketplaces
- 3.2.2 Industry pitfalls & challenges
- 3.2.2.1 Price volatility and market unpredictability
- 3.2.2.2 Quality assurance and equipment reliability concerns
- 3.2.3 Opportunities
- 3.2.3.1 Growth in sustainable and electric tractor adoption
- 3.2.3.2 Expansion in emerging markets and rural mechanization
- 3.2.1 Growth drivers
- 3.3 Growth potential analysis
- 3.3.1 Price volatility and market unpredictability
- 3.3.2 Quality assurance and equipment reliability concerns
- 3.4 Future market trends
- 3.5 Technology and innovation landscape
- 3.5.1 Current technological trends
- 3.5.2 Emerging technologies
- 3.6 Pricing Analysis (Driven by Primary Research)
- 3.6.1 Historical Price Trend Analysis (Driven by Primary Research)
- 3.6.2 Pricing Strategy by Player Type (Premium/Value/Cost-plus) (Driven by Primary Research)
- 3.7 Regulatory landscape
- 3.7.1 Standards and compliance requirements
- 3.7.2 Regional regulatory frameworks
- 3.7.3 Certification standards
- 3.8 Porter's analysis
- 3.9 PESTEL analysis
- 3.10 Trade Data Analysis (Driven by Primary Research)
- 3.10.1 Import/Export Volume & Value Trends (Driven by Primary Research)
- 3.10.2 Key Trade Corridors & Tariff Impact (Driven by Primary Research)
- 3.10.3 HS Code Classification & Trade Flow Analysis
- 3.11 Impact of AI & Generative AI on the Market
- 3.11.1 AI-Driven Disruption of Existing Business Models
- 3.11.2 GenAI Use Cases & Adoption Roadmap by Segment
- 3.11.3 Risks, Limitations & Regulatory Considerations
- 3.12 Refurbishment Capacity & Dealer Infrastructure Landscape (Driven by Primary Research)
- 3.12.1 Refurbishment Facility Capacity by Region & Key Player (Driven by Primary Research)
- 3.12.2 Dealer Network Density & Auction Throughput Analysis (Driven by Primary Research)
Chapter 4 Competitive Landscape, 2025
- 4.1 Introduction
- 4.2 Company market share analysis
- 4.2.1 By region
- 4.2.1.1 North America
- 4.2.1.2 Europe
- 4.2.1.3 Asia Pacific
- 4.2.1.4 Latin America
- 4.2.1.5 Middle East and Africa
- 4.2.1 By region
- 4.3 Company matrix analysis
- 4.4 Competitive analysis of major market players
- 4.5 Competitive positioning matrix
- 4.6 Key developments
- 4.6.1 Mergers & acquisitions
- 4.6.2 Partnerships & collaborations
- 4.6.3 New product launches
- 4.6.4 Expansion plans
Chapter 5 Market Estimates & Forecast, By Type, 2022 - 2035, (USD Billion) (Thousand Units)
- 5.1 Key trends
- 5.2 Farm tractor
- 5.2.1 Sub-compact utility tractor
- 5.2.2 Compact utility tractor
- 5.2.3 Specialty tractor
- 5.3 Construction tractor
- 5.4 Garden tractor
Chapter 6 Market Estimates & Forecast, By Horsepower, 2022 - 2035, (USD Billion) (Thousand Units)
- 6.1 Key trends
- 6.2 Below 30 HP
- 6.3 31-100 HP
- 6.4 101-200 HP
- 6.5 Above 200 HP
Chapter 7 Market Estimates & Forecast, By Fuel, 2022 - 2035, (USD Billion) (Thousand Units)
- 7.1 Key trends
- 7.2 Diesel
- 7.3 Petrol
- 7.4 Others (e.g., CNG, LPG)
Chapter 8 Market Estimates & Forecast, By End Users, 2022 - 2035, (USD Billion) (Thousand Units)
- 8.1 Key trends
- 8.2 Individual Owners
- 8.3 Residential
- 8.4 Commercial
Chapter 9 Market Estimates & Forecast, By Distribution Channel, 2022 - 2035, (USD Billion) (Thousand Units)
- 9.1 Key trends
- 9.2 Dealerships
- 9.3 Auctions
- 9.4 Private sales
- 9.5 Online platforms
Chapter 10 Market Estimates and Forecast, By Region, 2022 - 2035 (USD Billion) (Thousand Units)
- 10.1 Key trends
- 10.2 North America
- 10.2.1 U.S.
- 10.2.2 Canada
- 10.3 Europe
- 10.3.1 Germany
- 10.3.2 UK
- 10.3.3 France
- 10.3.4 Italy
- 10.3.5 Spain
- 10.4 Asia Pacific
- 10.4.1 China
- 10.4.2 Japan
- 10.4.3 India
- 10.4.4 Australia
- 10.4.5 South Korea
- 10.5 Latin America
- 10.5.1 Brazil
- 10.5.2 Mexico
- 10.5.3 Argentina
- 10.6 Middle East and Africa
- 10.6.1 South Africa
- 10.6.2 Saudi Arabia
- 10.6.3 UAE
Chapter 11 Company Profiles
- 11.1 Top Global Player
- 11.1.1 John Deere
- 11.1.2 CNH Industrial
- 11.1.3 Kubota Corporation
- 11.1.4 AGCO Corporation
- 11.1.5 Mahindra & Mahindra
- 11.1.6 Claas Group
- 11.1.7 Massey Ferguson
- 11.1.8 Escorts Kubota
- 11.1.9 Yanmar
- 11.2 Regional Player
- 11.2.1 Sonalika
- 11.2.2 LS Mtron
- 11.2.3 Kioti
- 11.2.4 Argo Tractors
- 11.2.5 SDF Group
- 11.2.6 Valtra
- 11.2.7 Belarus
- 11.2.8 TYM Tractors
- 11.3 Emerging Players
- 11.3.1 Lovol
- 11.3.2 Foton Tractors
- 11.3.3 Powertrac
- 11.3.4 Dongfeng Agricultural
