

|
시장보고서
상품코드
2083263
폐수에서의 스트루바이트 회수 시장 : 시장 기회, 성장요인, 업계 동향 분석 및 예측(2026-2035년)Struvite Recovery from Wastewater Market Opportunity, Growth Drivers, Industry Trend Analysis, and Forecast 2026 - 2035 |
||||||

세계의 폐수에서의 스트루바이트 회수 시장은 2025년에 47억 달러로 평가되었고, CAGR 7.3%로 성장하여 2035년까지 96억 달러에 달할 것으로 추정되고 있습니다.
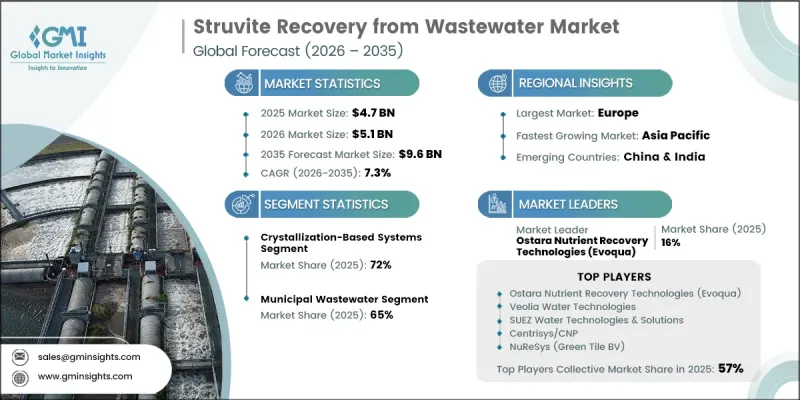
이러한 성장은 영양염 배출 규제의 강화, 순환형 경제 원칙의 확산, 그리고 폐수에서 유래한 영양염이 귀중한 상업적 자원으로 인식되기 시작함에 따라 뒷받침되고 있습니다. 시장의 확대는 일시적인 업계 동향이라기보다는 장기적인 구조적 변화를 반영한 것입니다. 스트루바이트 회수 기술은 더 이상 처리 시스템 내의 스케일이나 인의 축적을 관리하기 위한 운영상의 해결책으로만 간주되지 않습니다. 오히려, 이 시설은 규제 요건을 충족하면서도 시장에서 유통 가능한 비료 제품을 생산하는 데 도움이 되는 전략적 투자입니다. 처리 사업자들이 폐기물 흐름을 수익을 창출하는 자산으로 전환할 기회를 점점 더 인식함에 따라, 프로젝트 도입에 대한 재무 전망이 크게 개선되었습니다. 제품의 상용화를 통해 얻는 수익은 설치비 및 운영비를 상쇄하는 데 기여하고 있으며, 이는 프로젝트의 경제성을 향상시키고 처리 용량이 각기 다른 시설 전반에 걸쳐 보다 광범위한 도입을 촉진하고 있습니다. 동시에, 점점 더 엄격해지는 인 관리 규제로 인해 주요 하수 처리 시장 전반에 걸쳐 첨단 영양소 회수 기술에 대한 투자 기회가 지속적으로 창출되고 있습니다.
| 시장 범위 | |
|---|---|
| 개시 연도 | 2025년 |
| 예측 기간 | 2026-2035년 |
| 초기 시장 규모 | 47억 달러 |
| 예측액 | 96억 달러 |
| CAGR | 7.3% |
2025년에는 결정화 기술 부문이 72%의 점유율을 차지했습니다. 이 부문 시장 내 선도적 지위는 장기적인 운영 신뢰성, 상업적으로 활용 가능한 회수물의 안정적인 생산, 그리고 규제 당국 및 최종 사용자의 폭넓은 지지에 힘입어 유지되고 있습니다. 이러한 시스템의 성숙도에 더해 실제 가동 조건에서의 실적이 더해지면서, 결정화 기술은 효과적인 인 회수 솔루션을 모색하는 시설들에게 계속해서 선호되는 기술 경로로 자리 잡고 있습니다. 하수 처리 사업자들이 규제 준수를 유지하면서 영양염 회수를 극대화하는 데 주력하는 가운데, 주요 지역 시장 전반에 걸쳐 확립된 결정화 공정에 대한 수요는 계속해서 견조한 양상을 보이고 있습니다.
도시 하수 처리 분야 시장 점유율은 2025년에 65%에 달했습니다. 이러한 높은 시장 점유율은 적절한 인 농도와 도시 하수 처리 인프라를 통한 영양염 회수를 장려하는 강력한 규제적 인센티브에 힘입어 유지되고 있습니다. 고농도의 사이드스트림을 처리하는 하수 처리 시설에서는 효율적인 결정화와 높은 회수율을 달성할 수 있는 수준의 용존 인이 포함되어 있는 경우가 많습니다. 이러한 운전 조건은 대규모 도입에 있어 매력적인 경제성을 창출하며, 도시 하수 처리 네트워크 내에서 인 회수 기술의 광범위한 채택을 지속적으로 뒷받침하고 있습니다. 인프라 현대화 및 자원 회수 노력에 대한 투자 증가가 이 용도 분야 전체 수요를 더욱 부추기고 있습니다.
북미 하수에서 스트루바이트를 회수하는 시장은 2025년에 27%의 점유율을 차지했으며, 2035년까지 연평균 성장률(CAGR) 4.8%로 성장할 것으로 전망됩니다. 미국은 영양염 관리 및 하수 처리 성능 향상을 위한 지속적인 노력을 통해, 지역 시장 수요에 있어 여전히 가장 큰 기여를 하고 있습니다. 수계 내 인(P) 배출 감축을 목적으로 한 규제 조치로 인해, 처리 시설들은 점점 더 엄격해지는 방류 기준을 충족할 수 있는 첨단 영양염 회수 솔루션에 대한 투자를 확대되고 있습니다. 환경 규정 준수 기준이 지속적으로 발전함에 따라, 하수 처리 사업자들은 인 제거를 지원함과 동시에 자원 회수 기회를 창출하는 기술에 더 많은 자본을 투자하고 있습니다.
자주 묻는 질문
목차
제1장 조사 방법과 범위
제2장 주요 요약
제3장 업계 인사이트
제4장 경쟁 구도
제5장 시장 추산 및 예측 : 기술별, 2022년부터 2035년
제6장 시장 추산 및 예측 : 폐수 발생원별, 2022년부터 2035년
제7장 시장 추산 및 예측 : 최종사용자별, 2022년부터 2035년
제8장 시장 추산 및 예측 : 지역별, 2022년부터 2035년
제9장 기업 개요
LSH 26.07.14The Global Struvite Recovery from Wastewater Market was valued at USD 4.7 billion in 2025 and is estimated to grow at a CAGR of 7.3% to reach USD 9.6 billion by 2035.
Growth is fueled by stricter nutrient discharge regulations, rising adoption of circular economy principles, and growing recognition of wastewater-derived nutrients as valuable commercial resources. The market's expansion reflects a long-term structural shift rather than a temporary industry trend. Struvite recovery technologies are no longer viewed solely as operational solutions for managing scaling and phosphorus accumulation within treatment systems. Instead, they have become strategic investments that help facilities meet regulatory requirements while generating marketable fertilizer products. The financial outlook for project deployment has improved considerably as treatment operators increasingly identify opportunities to transform waste streams into revenue-generating assets. Revenue generated through product commercialization is helping offset installation and operating costs, improving project economics and encouraging broader adoption across facilities of varying capacities. At the same time, increasingly stringent phosphorus management regulations are creating a consistent pipeline of investment opportunities for advanced nutrient recovery technologies across major wastewater treatment markets.
| Market Scope | |
|---|---|
| Start Year | 2025 |
| Forecast Year | 2026-2035 |
| Start Value | $4.7 Billion |
| Forecast Value | $9.6 Billion |
| CAGR | 7.3% |
The crystallization-based technologies segment held a 72% share in 2025. Their leading market position is supported by long-term operational reliability, consistent production of commercially acceptable recovered materials, and broad acceptance among regulators and end users. The maturity of these systems, combined with proven performance under full-scale operating conditions, continues to make crystallization the preferred technology pathway for facilities seeking effective phosphorus recovery solutions. As wastewater treatment operators focus on maximizing nutrient capture while maintaining regulatory compliance, demand for established crystallization processes remains strong across key regional markets.
The municipal wastewater streams segment reached 65% share in 2025. This substantial market share is supported by favorable phosphorus concentrations and strong regulatory incentives encouraging nutrient recovery from municipal treatment infrastructure. Wastewater treatment facilities processing concentrated sidestream flows frequently contain dissolved phosphorus levels capable of supporting efficient crystallization and high recovery yields. These operating conditions create attractive economics for large-scale deployment and continue to support the widespread adoption of phosphorus recovery technologies within municipal treatment networks. Increasing investments in infrastructure modernization and resource recovery initiatives are further strengthening demand across this application segment.
North America Struvite Recovery from Wastewater Market accounted for 27% share in 2025 and is projected to grow at a CAGR of 4.8% through 2035. The United States remains the largest contributor to regional market demand due to ongoing efforts to improve nutrient management and wastewater treatment performance. Regulatory measures targeting phosphorus reduction in water systems have encouraged treatment facilities to invest in advanced nutrient recovery solutions capable of achieving increasingly stringent discharge requirements. As environmental compliance standards continue to evolve, wastewater operators are allocating greater capital toward technologies that support phosphorus removal while creating opportunities for resource recovery.
Key participants operating in the Global Struvite Recovery from Wastewater Market include Ostara Nutrient Recovery Technologies (Evoqua/Xylem), Veolia Water Technologies, SUEZ Water Technologies & Solutions, Centrisys/CNP, and NuReSys (Green Tile BV). Companies operating in the Struvite Recovery from Wastewater Market are focusing on technological innovation, strategic partnerships, and expansion of nutrient recovery capabilities to strengthen their competitive position. Market participants are investing in advanced recovery systems that improve phosphorus capture efficiency, enhance product quality, and reduce operating costs for wastewater treatment facilities. Collaboration with municipal utilities, industrial operators, engineering firms, and infrastructure developers remains a key growth strategy for accelerating project deployment. Many companies are also emphasizing research and development to optimize crystallization performance and support broader applications across different wastewater streams.
Table of Contents
Chapter 1 Methodology & Scope
- 1.1 Research approach
- 1.2 Quality Commitments
- 1.2.1 GMI AI policy & data integrity commitment
- 1.2.1.1 Source consistency protocol
- 1.2.1 GMI AI policy & data integrity commitment
- 1.3 Research Trail & Confidence Scoring
- 1.3.1 Research Trail Components
- 1.3.2 Scoring Components
- 1.4 Data Collection
- 1.4.1 Partial list of primary sources
- 1.5 Data mining sources
- 1.5.1 Paid sources
- 1.5.1.1 Sources, by region
- 1.5.1 Paid sources
- 1.6 Base estimates and calculations
- 1.6.1 Base year calculation for any one approach
- 1.7 Forecast model
- 1.7.1 Quantified market impact analysis
- 1.7.1.1 Mathematical impact of growth parameters on forecast
- 1.7.1 Quantified market impact analysis
- 1.8 Research transparency addendum
- 1.8.1 Source attribution framework
- 1.8.2 Quality assurance metrics
- 1.8.3 Our commitment to trust
Chapter 2 Executive Summary
- 2.1 Industry 360° synopsis
- 2.2 Key market trends
- 2.2.1 Regional
- 2.2.2 By Technology
- 2.2.3 By Wastewater Source
- 2.2.4 By End User
- 2.3 TAM Analysis, 2026-2035
- 2.4 CXO perspectives: Strategic imperatives
Chapter 3 Industry Insights
- 3.1 Industry ecosystem analysis
- 3.1.1 Supplier landscape
- 3.1.2 Profit margin
- 3.1.3 Value addition at each stage
- 3.1.4 Factor affecting the value chain
- 3.1.5 Disruptions
- 3.2 Industry impact forces
- 3.2.1 Growth drivers
- 3.2.2 Industry pitfalls and challenges
- 3.2.3 Market opportunities
- 3.3 Growth potential analysis
- 3.4 Regulatory landscape
- 3.4.1 North America
- 3.4.2 Europe
- 3.4.3 Asia Pacific
- 3.4.4 Latin America
- 3.4.5 Middle East & Africa
- 3.5 Porter’s analysis
- 3.6 PESTEL analysis
- 3.7 Price trends
- 3.7.1 By region
- 3.7.2 By technology
- 3.8 Future market trends
- 3.9 Technology and Innovation landscape
- 3.9.1 Current technological trends
- 3.9.2 Emerging technologies
- 3.10 Patent Landscape
- 3.11 Trade statistics (HS code)
- 3.11.1 Major importing countries
- 3.11.2 Major exporting countries
- 3.12 Sustainability and environmental aspects
- 3.12.1 Sustainable practices
- 3.12.2 Waste reduction strategies
- 3.12.3 Energy efficiency in production
- 3.12.4 Eco friendly initiatives
Chapter 4 Competitive Landscape, 2025
- 4.1 Introduction
- 4.2 Company market share analysis
- 4.2.1 By region
- 4.2.1.1 North America
- 4.2.1.2 Europe
- 4.2.1.3 Asia Pacific
- 4.2.1.4 LATAM
- 4.2.1.5 MEA
- 4.2.1 By region
- 4.3 Company matrix analysis
- 4.4 Competitive analysis of major market players
- 4.5 Competitive positioning matrix
- 4.6 Key developments
- 4.6.1 Mergers & acquisitions
- 4.6.2 Partnerships & collaborations
- 4.6.3 New Product Launches
- 4.6.4 Expansion Plans
Chapter 5 Market Estimates and Forecast, By Technology, 2022 to 2035 (USD Million) (Tons)
- 5.1 Key trends
- 5.2 Crystallization-Based Technologies
- 5.2.1 Fluidized Bed Reactors (FBR)
- 5.2.2 Stirred Tank Reactors
- 5.2.3 Air-Lift Reactors
- 5.2.4 Packed-Bed Systems
- 5.3 Electrochemical Recovery Systems
- 5.3.1 Sacrificial Magnesium Anode Systems
- 5.3.2 Hybrid Electrochemical-Crystallization Platforms
- 5.4 Biochar-Assisted Crystallization
- 5.4.1 Mg-Impregnated Biochar Systems
- 5.4.2 Biochar-Struvite Composite Production
Chapter 6 Market Estimates and Forecast, By Wastewater Source, 2022 to 2035 (USD Million) (Tons)
- 6.1 Key trends
- 6.2 Municipal Wastewater (Sludge Liquor/Sidestream)
- 6.2.1 Digester Supernatant Recovery
- 6.2.2 Dewatering Centrate/Filtrate Recovery
- 6.2.3 Post-Anaerobic Digestion Streams
- 6.3 Industrial Wastewater
- 6.3.1 Food Processing Industry
- 6.3.2 Chemical & Fertilizer Manufacturing
- 6.3.3 Dairy & Beverage Industries
- 6.3.4 Pharmaceutical & Specialty Chemical Sectors
- 6.4 Agro-Industrial & Livestock Wastewater
- 6.4.1 Manure Processing Facilities
- 6.4.2 Animal Rendering & Processing Plants
- 6.4.3 Biogas Digestates Recovery
- 6.5 Source-Separated Streams
- 6.5.1 Urine Separation Systems
- 6.5.2 Concentrated Nutrient Streams
Chapter 7 Market Estimates and Forecast, By End User, 2022 to 2035 (USD Million) (Tons)
- 7.1 Key trends
- 7.2 Municipal Wastewater Treatment Plants (WWTPs)
- 7.2.1 Large-Scale Facilities (>100,000 Population Equivalents)
- 7.2.2 Medium-Scale Facilities (50,000-100,000 Population Equivalents)
- 7.2.3 Enhanced Biological Phosphorus Removal (EBPR) Plants
- 7.3 Industrial Treatment Facilities
- 7.3.1 On-Site Wastewater Treatment (Food & Beverage)
- 7.3.2 Pharmaceutical & Chemical Industry Facilities
- 7.3.3 Mining & Mineral Processing Operations
- 7.4 Agricultural Operations
- 7.4.1 Livestock Farms with Anaerobic Digestion
- 7.4.2 Biogas Plants & Energy Recovery Facilities
- 7.4.3 Large-Scale Feedlots & Concentrated Animal Feeding Operations (CAFOs)
- 7.5 Decentralized/Small-Scale Systems
- 7.5.1 Community-Level Treatment Systems
- 7.5.2 Source-Separation & On-Site Recovery Facilities
Chapter 8 Market Estimates and Forecast, By Region, 2022 to 2035 (USD Million) (Tons)
- 8.1 Key trends
- 8.2 North America
- 8.2.1 U.S.
- 8.2.2 Canada
- 8.3 Europe
- 8.3.1 Germany
- 8.3.2 UK
- 8.3.3 France
- 8.3.4 Spain
- 8.3.5 Italy
- 8.3.6 Rest of Europe
- 8.4 Asia Pacific
- 8.4.1 China
- 8.4.2 India
- 8.4.3 Japan
- 8.4.4 Australia
- 8.4.5 South Korea
- 8.4.6 Rest of Asia Pacific
- 8.5 Latin America
- 8.5.1 Brazil
- 8.5.2 Mexico
- 8.5.3 Argentina
- 8.5.4 Rest of Latin America
- 8.6 Middle East and Africa
- 8.6.1 Saudi Arabia
- 8.6.2 South Africa
- 8.6.3 UAE
- 8.6.4 Rest of Middle East and Africa
Chapter 9 Company Profiles
- 9.1 Ostara Nutrient Recovery Technologies (Evoqua)
- 9.2 Veolia Water Technologies
- 9.3 SUEZ Water Technologies & Solutions
- 9.4 Centrisys/CNP
- 9.5 NuReSys (Green Tile BV)
- 9.6 CNP Cycles GmbH
- 9.7 Paques Technology
- 9.8 Schwing Bioset
- 9.9 Colsen B.V.
- 9.10 PARFORCE Engineering


