

|
시장보고서
상품코드
2101927
전동 스쿠터 시장 기회, 성장 촉진요인, 업계 동향 분석 및 예측(2026-2035년)Electric Scooters Market Opportunity, Growth Drivers, Industry Trend Analysis, and Forecast 2026 - 2035 |
||||||

세계의 전동 스쿠터 시장은 2025년에 275억 달러 규모에 달하고, 2035년까지 CAGR 12.5%로 성장하여 881억 달러에 달할 것으로 추정됩니다.
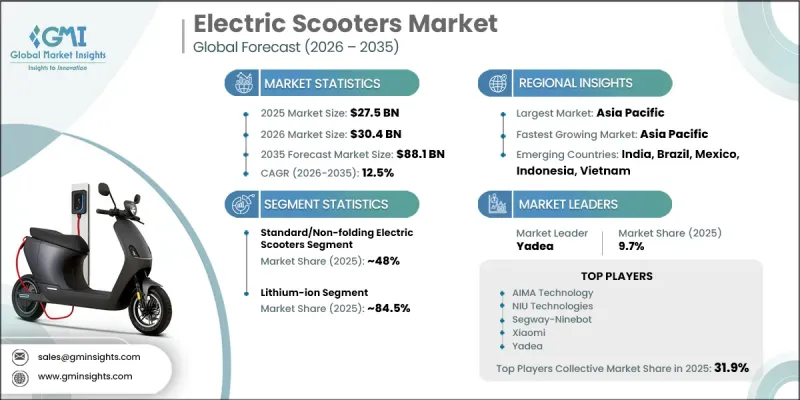
정부, 소비자, 기업이 지속가능하고 효율적인 도시 모빌리티 솔루션으로 점점 더 전환함에 따라, 전동 스쿠터 시장은 눈에 띄게 확대되고 있습니다. 구매 인센티브, 세제 혜택, 소유 비용 절감, 국내 배터리 생산 촉진 노력 등 정부의 지원책 덕분에 더 폭넓은 소비자층이 전동 스쿠터를 이용하기 쉬워지고 있습니다. 환경 문제에 대한 관심 증가와 배출 감축 목표의 강화로 인해 기존의 이륜차에서 전기 차량으로의 전환이 촉진되고 있습니다. 충전 네트워크와 배터리 교환 인프라 확충은 전동 스쿠터의 실용성과 보급을 한층 더 높이고 있습니다. 도시화의 진전, 교통 체증의 악화, 합리적인 가격의 단거리 이동 수단에 대한 수요 증가가 콤팩트하고 편의성이 높은 이동 수단에 대한 수요를 견인하고 있습니다. 전동 스쿠터는 이동 시간 단축과 교통비 절감을 통해 도시 지역의 통근에 있어 효과적인 해결책으로 자리 잡고 있습니다. 스마트 시티 구상, 공유 모빌리티 서비스, 마이크로모빌리티 생태계의 전개가 시장 성장을 더욱 뒷받침하고 있습니다. 또한, 배송 서비스와 E-Commerce(EC) 사업의 급속한 확대로 인해 효율적이고 경제적인 전기 운송 솔루션에 대한 수요가 증가하고 있습니다.
| 시장 범위 | |
|---|---|
| 시작 연도 | 2025년 |
| 예측 기간 | 2026-2035년 |
| 시작 시점 시장 규모 | 275억 달러 |
| 예측액 | 881억 달러 |
| CAGR | 12.5% |
배터리 기술의 지속적인 발전으로 인해 전동 스쿠터의 전반적인 성능, 신뢰성 및 사용 편의성이 향상되고 있습니다. 리튬이온 배터리, 배터리 관리 시스템 및 차세대 배터리 기술 분야의 혁신을 통해 제조사들은 주행 거리 연장, 안전 기능 향상, 충전 시간 단축을 실현하고 있습니다. 이러한 기술적 진보는 소비자의 신뢰를 높이고, 다양한 용도에서 전동 스쿠터의 보급을 촉진하고 있습니다.
표준형/비접이식 전동 스쿠터 부문은 2025년에 48%의 시장 점유율을 차지했으며, 2035년까지 연평균 성장률(CAGR) 12.1%로 성장할 것으로 전망됩니다. 이 부문은 내구성, 대용량 배터리, 높은 적재 능력, 그리고 편안한 승차감과 같은 장점 덕분에 주도적인 위치를 유지하고 있습니다. 표준형 전동 스쿠터는 접이식 모델에 비해 안정성이 높고 주행 거리도 길기 때문에 일상적인 통근, 상업적 이용, 공유 서비스에서 점점 더 선호되고 있습니다. 각 제조사는 효율성과 종합적인 성능을 향상시키기 위해 배터리 기술, 커넥티비티 기능, 차량 부품의 개선을 지속적으로 추진하고 있습니다.
리튬이온 배터리 부문은 2025년에 84.5%의 점유율을 차지했으며, 2026년부터 2035년까지 연평균 성장률(CAGR) 12.8% 이상으로 성장할 것으로 전망됩니다. 리튬이온 배터리는 다른 배터리 기술에 비해 에너지 밀도가 높고, 가볍고, 수명이 길며, 충전 효율이 뛰어나기 때문에 계속해서 시장을 주도하고 있습니다. 이러한 배터리는 주행 거리가 길고, 충전 속도가 빠르며, 유지보수가 거의 필요하지 않아 고급 모델부터 합리적인 가격대의 전동 스쿠터 모델에 이르기까지 폭넓게 적합합니다. 배터리 비용의 하락과 배터리 관리 기술의 지속적인 개선으로 인해 리튬이온 배터리를 탑재한 전동 스쿠터의 보급이 더욱 가속화되고 있습니다.
중국 전동 스쿠터 시장은 52.3%의 점유율을 차지하며, 2025년에는 108억 달러의 시장 규모를 기록했습니다. 중국의 견고한 시장 지위는 광범위한 전기이륜차 제조 생태계, 대규모 소비자 기반, 잘 구축된 배터리 공급망, 그리고 확대되는 충전 인프라에 의해 뒷받침되고 있습니다. 친환경 교통 수단에 대한 수요 증가, 공유 모빌리티 서비스의 확산, 그리고 경제적인 통근 수단에 대한 선호도 상승이 시장 확대에 기여하고 있습니다. 배터리 성능 및 커넥티드 모빌리티 기술 분야의 지속적인 발전은 전동 스쿠터 업계에서 중국의 리더십을 더욱 공고히 하고 있습니다.
자주 묻는 질문
목차
제1장 조사 방법
제2장 주요 요약
제3장 업계 인사이트
제4장 경쟁 구도
제5장 시장 추정 및 예측 : 제품별, 2022-2035년
제6장 시장 추정 및 예측 : 배터리 기술별, 2022-2035년
제7장 시장 추정 및 예측 : 용도별, 2022-2035년
제8장 시장 추정 및 예측 : 출력별, 2022-2035년
제9장 시장 추정 및 예측 : 범위별, 2022-2035년
제10장 시장 추정 및 예측 : 속도별, 2022-2035년
제11장 시장 추정 및 예측 : 유통 채널별, 2022-2035년
제12장 시장 추정 및 예측 : 지역별, 2022-2035년
제13장 기업 개요
KSM 26.08.05The Global Electric Scooters Market was valued at USD 27.5 billion in 2025 and is estimated to grow at a CAGR of 12.5% to reach USD 88.1 billion by 2035.
The electric scooters market is witnessing significant expansion as governments, consumers, and businesses increasingly shift toward sustainable and efficient urban mobility solutions. Supportive government programs, including purchase incentives, tax advantages, reduced ownership costs, and initiatives promoting domestic battery production, are improving the accessibility of electric scooters for a wider consumer base. Growing environmental concerns and stricter emission reduction targets are encouraging the transition from conventional two-wheelers to electric alternatives. The expansion of charging networks and battery-swapping infrastructure is further improving the practicality and adoption of electric scooters. Increasing urbanization, rising traffic congestion, and the need for affordable short-distance transportation are driving demand for compact and convenient mobility options. Electric scooters are becoming an effective solution for urban commuting by reducing travel time and lowering transportation expenses. The development of smart city initiatives, shared mobility services, and micro-mobility ecosystems is further supporting market growth. In addition, the rapid expansion of delivery services and e-commerce operations is increasing demand for efficient and economical electric transportation solutions.
| Market Scope | |
|---|---|
| Start Year | 2025 |
| Forecast Year | 2026-2035 |
| Start Value | $27.5 Billion |
| Forecast Value | $88.1 Billion |
| CAGR | 12.5% |
Continuous advancements in battery technologies are improving the overall performance, reliability, and usability of electric scooters. Innovations in lithium-ion batteries, battery management systems, and next-generation battery technologies are helping manufacturers achieve longer riding ranges, improved safety features, and shorter charging durations. These technological improvements are enhancing consumer confidence and supporting broader adoption of electric scooters across multiple applications.
The standard/non-folding electric scooters segment accounted for 48% share in 2025 and is expected to grow at a CAGR of 12.1% through 2035. This segment maintains the leading position due to its advantages in terms of durability, larger battery capacity, stronger load-handling capability, and enhanced riding comfort. Standard electric scooters are increasingly preferred for daily commuting, commercial operations, and shared mobility services because they provide better stability and longer travel distances compared with folding models. Manufacturers are continuously introducing improvements in battery technology, connectivity features, and vehicle components to enhance efficiency and overall performance.
The lithium-ion battery segment 84.5% share in 2025 and is projected to grow at a CAGR of over 12.8% from 2026 to 2035. Lithium-ion batteries continue to lead the market because of their high energy density, lightweight structure, extended lifespan, and efficient charging performance compared with alternative battery technologies. These batteries provide longer travel ranges, faster charging capabilities, and lower maintenance requirements, making them suitable for both premium and affordable electric scooter models. Falling battery costs and continuous improvements in battery management technologies are further accelerating the adoption of lithium-ion-powered electric scooters.
China Electric Scooters Market held 52.3% share, generating USD 10.8 billion in 2025. The country's strong market position is supported by its extensive electric two-wheeler manufacturing ecosystem, large consumer base, developed battery supply chain, and expanding charging infrastructure. Rising demand for environmentally friendly transportation solutions, increased adoption of shared mobility services, and growing preference for economical commuting options are contributing to market expansion. Ongoing advancements in battery performance and connected mobility technologies are further strengthening China's leadership in the electric scooters industry.
Major players operating in the global electric scooters market include Yadea, AIMA Technology, Ather Energy, Bajaj Auto, Hero MotoCorp, Honda Motor, NIU Technologies, Segway-Ninebot, TVS Motor (iQube), and Xiaomi. Companies operating in the electric scooters market are strengthening their competitive position through continuous product innovation, technology upgrades, strategic partnerships, and geographic expansion initiatives. Manufacturers are investing in advanced battery solutions, connected vehicle technologies, and smart mobility features to improve product performance and enhance user experience. Companies are also expanding their manufacturing capabilities, strengthening supply chain networks, and developing cost-effective models to attract a broader customer base. Strategic collaborations, investments in charging infrastructure, and expansion into emerging markets are helping businesses increase market penetration.
Table of Contents
Chapter 1 Methodology
- 1.1 Research approach
- 1.2 Quality Commitments
- 1.2.1 GMI AI policy & data integrity commitment
- 1.2.1.1 Source consistency protocol
- 1.2.1 GMI AI policy & data integrity commitment
- 1.3 Research Trail & Confidence Scoring
- 1.3.1 Research Trail Components
- 1.3.2 Scoring Components
- 1.4 Data Collection
- 1.4.1 Partial list of primary sources
- 1.5 Data mining sources
- 1.5.1 Paid sources
- 1.5.1.1 Sources, by region
- 1.5.1 Paid sources
- 1.6 Base estimates and calculations
- 1.6.1 Base year calculation
- 1.7 Forecast Model
- 1.7.1 Quantified market impact analysis
- 1.7.1.1 Mathematical impact of growth parameters on forecast
- 1.7.1 Quantified market impact analysis
- 1.8 Research transparency addendum
- 1.8.1 Source attribution framework
- 1.8.2 Quality assurance metrics
- 1.8.3 Our commitment to trust
Chapter 2 Executive Summary
- 2.1 Industry 360° synopsis, 2022 – 2035
- 2.2 Key market trends
- 2.2.1 Regional
- 2.2.2 Product
- 2.2.3 Battery technology
- 2.2.4 Application
- 2.2.5 Power output
- 2.2.6 Range
- 2.2.7 Speed
- 2.2.8 Distribution channel
- 2.3 TAM Analysis, 2026-2035
- 2.4 CXO perspectives: Strategic imperatives
Chapter 3 Industry Insights
- 3.1 Industry ecosystem analysis
- 3.1.1 Supplier landscape
- 3.1.2 Profit margin analysis
- 3.1.3 Cost structure
- 3.1.4 Value addition at each stage
- 3.1.5 Factor affecting the value chain
- 3.1.6 Disruptions
- 3.2 Industry impact forces
- 3.2.1 Growth drivers
- 3.2.1.1 Rising government incentives and supportive policies promoting electric mobility
- 3.2.1.2 Increasing fuel prices and lower operating costs compared to conventional scooters
- 3.2.1.3 Growing urbanization and demand for affordable last-mile transportation
- 3.2.1.4 Advancements in battery technology improving range, safety, and charging speed
- 3.2.2 Industry pitfalls and challenges
- 3.2.2.1 Limited charging infrastructure in developing and rural regions
- 3.2.2.2 High upfront purchase cost compared to internal combustion engine (ICE) scooters
- 3.2.3 Market opportunities
- 3.2.3.1 Expansion of battery swapping ecosystems and fast-charging infrastructure
- 3.2.3.2 Increasing adoption of electric scooters for e-commerce and last-mile delivery fleets
- 3.2.3.3 Growing penetration in emerging markets across Asia, Latin America, and Africa
- 3.2.3.4 Development of connected, AI-enabled, and autonomous mobility features
- 3.2.1 Growth drivers
- 3.3 Growth potential analysis
- 3.4 Technology and Innovation landscape
- 3.4.1 Current technological trends
- 3.4.2 Emerging technologies
- 3.5 Pricing Analysis (Driven by Primary Research)
- 3.5.1 Historical Price Trend Analysis
- 3.5.2 Pricing Strategy by Player Type (Premium / Value / Cost-plus)
- 3.6 Regulatory guideline
- 3.6.1 North America
- 3.6.1.1 U.S.: Consumer Product Safety Commission (CPSC) Safety Standards & UL 2272/UL 2849 Certification Requirements
- 3.6.1.2 Canada: Motor Vehicle Safety Act (where applicable), Provincial Micromobility Regulations & Transport Canada Safety Guidelines.
- 3.6.2 Europe
- 3.6.2.1 Germany: eKFV (Electric Small Vehicles Ordinance) & EU Machinery Regulation Compliance
- 3.6.2.2 UK: Department for Transport (DfT) E-scooter Trial Regulations & Road Traffic Act
- 3.6.2.3 France: Code de la Route (French Highway Code) & Personal Mobility Device Regulations
- 3.6.2.4 Italy: Highway Code (Codice della Strada) & Electric Scooter Operational Regulations
- 3.6.3 Asia Pacific
- 3.6.3.1 China: GB National Standards for Electric Scooters & CCC (China Compulsory Certification)
- 3.6.3.2 India: Central Motor Vehicles Rules (CMVR), AIS Standards & FAME II/FAME PM E-DRIVE Scheme
- 3.6.3.3 Japan: Road Traffic Act & Specified Small Motorized Bicycle Regulations
- 3.6.3.4 South Korea: Personal Mobility Device Safety Regulations & KCs Certification Standards
- 3.6.3.5 Australia: Australian Consumer Law (ACL) Product Safety Requirements & State/Territory E-scooter Regulations
- 3.6.4 Latin America
- 3.6.4.1 Brazil: CONTRAN Electric Mobility Regulations & INMETRO Product Certification
- 3.6.4.2 Mexico: NOM Safety Standards & State-Level Micromobility Regulations
- 3.6.4.3 Argentina: National Road Safety Agency (ANSV) Electric Scooter Operating Guidelines
- 3.6.5 MEA
- 3.6.5.1 UAE: Dubai RTA E-scooter Regulations & UAE Standardization Requirements
- 3.6.5.2 Saudi Arabia: SASO Electric Vehicle Product Standards & Municipal Micromobility Regulations
- 3.6.5.3 South Africa: National Road Traffic Act & SABS Electrical Safety Standards for Electric Scooters
- 3.6.1 North America
- 3.7 Porter’s analysis
- 3.8 PESTEL analysis
- 3.9 Patent Landscape (Driven by Primary Research)
- 3.10 Trade data analysis (Driven by Paid Research)
- 3.10.1 Import/export volume & value trends
- 3.10.2 Key trade corridors & tariff impact
- 3.11 Capacity & production landscape (Driven by Primary Research)
- 3.11.1 Installed capacity by region & key producer
- 3.11.2 Capacity utilization rates & expansion pipelines
- 3.12 Impact of AI & Generative AI on the Market (Driven by Primary Research)
- 3.12.1 AI-Driven Disruption of Existing Business Models
- 3.12.2 GenAI Use Cases & Adoption Roadmap by Segment
- 3.12.3 Risks, Limitations & Regulatory Considerations
- 3.13 Charging technology standards and infrastructure ecosystem
- 3.13.1 Dc fast charging standards regional adoption analysis
- 3.13.2 Proprietary charging solutions and market fragmentation
- 3.13.3 Vehicle-to-grid integration and smart charging
- 3.14 Forecast assumptions & scenario analysis (Driven by Primary Research)
- 3.14.1 Base Case - Key Macro & Industry Variables Driving CAGR
- 3.14.2 Optimistic Scenarios - Favourable macro and industry tailwinds
- 3.14.3 Pessimistic Scenario - Macroeconomic slowdown or industry headwinds
Chapter 4 Competitive Landscape, 2025
- 4.1 Introduction
- 4.2 Company market share analysis
- 4.2.1 North America
- 4.2.2 Europe
- 4.2.3 Asia Pacific
- 4.2.4 Latin America
- 4.2.5 MEA
- 4.3 Competitive analysis of major market players
- 4.4 Competitive positioning matrix
- 4.5 Key developments
- 4.5.1 Mergers & acquisitions
- 4.5.2 Partnerships & collaborations
- 4.5.3 New Product Launches
- 4.5.4 Expansion Plans and funding
- 4.6 Company Tier Benchmarking
- 4.6.1 Tier Classification Criteria & Qualifying Thresholds
- 4.6.2 Tier Positioning Matrix by Revenue, Geography & Innovation
Chapter 5 Market Estimates & Forecast, By Product, 2022 - 2035 ($Bn, Units)
- 5.1 Key trends
- 5.2 Standard/non-folding electric scooters
- 5.3 Folding electric scooters
- 5.4 Seated electric scooters
- 5.5 Self-balancing electric scooters
- 5.6 Three-wheeled electric scooters
Chapter 6 Market Estimates & Forecast, By Battery Technology, 2022 - 2035 ($Bn, Units)
- 6.1 Key trends
- 6.2 Lithium-ion (Li-ion)
- 6.3 Sealed lead acid (SLA)
- 6.4 Nickel metal hydride (NiMH)
- 6.5 Others
Chapter 7 Market Estimates & Forecast, By Application, 2022 - 2035 ($Bn, Units)
- 7.1 Key trends
- 7.2 Personal mobility
- 7.3 Recreational
- 7.4 Ride sharing
- 7.5 Last-mile delivery
- 7.6 Fleet operations
Chapter 8 Market Estimates & Forecast, By Power Output, 2022 – 2035 ($Bn, Units)
- 8.1 Key trends
- 8.2 Below 250W
- 8.3 250W–500W
- 8.4 Above 500W
Chapter 9 Market Estimates & Forecast, By Range, 2022 – 2035 ($Bn, Units)
- 9.1 Key trends
- 9.2 Below 50 km
- 9.3 50–100 km
- 9.4 Above 100 km
Chapter 10 Market Estimates & Forecast, By Speed, 2022 – 2035 ($Bn, Units)
- 10.1 Key trends
- 10.2 Below 25 km/h
- 10.3 25–50 km/h
- 10.4 Above 50 km/h
Chapter 11 Market Estimates & Forecast, By Distribution Channel, 2022 – 2035 ($Bn, Units)
- 11.1 Key trends
- 11.2 Online
- 11.3 Offline
Chapter 12 Market Estimates & Forecast, By Region, 2022 - 2035 ($Bn, Units)
- 12.1 Key trends
- 12.2 North America
- 12.2.1 US
- 12.2.2 Canada
- 12.3 Europe
- 12.3.1 Germany
- 12.3.2 UK
- 12.3.3 France
- 12.3.4 Italy
- 12.3.5 Spain
- 12.3.6 Russia
- 12.3.7 Netherlands
- 12.3.8 Belgium
- 12.4 Asia Pacific
- 12.4.1 China
- 12.4.2 India
- 12.4.3 Japan
- 12.4.4 Australia
- 12.4.5 South Korea
- 12.4.6 New Zealand
- 12.5 Latin America
- 12.5.1 Brazil
- 12.5.2 Mexico
- 12.5.3 Argentina
- 12.6 MEA
- 12.6.1 South Africa
- 12.6.2 Saudi Arabia
- 12.6.3 UAE
Chapter 13 Company Profiles
- 13.1 Global Players
- 13.1.1 AIMA Technology
- 13.1.2 Gogoro
- 13.1.3 Honda Motor
- 13.1.4 Ninebot
- 13.1.5 NIU Technologies
- 13.1.6 Piaggio
- 13.1.7 Vmoto
- 13.1.8 Xiaomi
- 13.1.9 Yadea
- 13.1.10 Yamaha Motor
- 13.2 Regional Players
- 13.2.1 Ather Energy
- 13.2.2 Bajaj Auto
- 13.2.3 Hero MotoCorp
- 13.2.4 Horwin Global
- 13.2.5 Ola Electric Mobility
- 13.2.6 Silence Urban Ecomobility
- 13.2.7 TVS Motor Company
- 13.3 Emerging Players
- 13.3.1 Askoll EVA
- 13.3.2 BGauss Electric
- 13.3.3 Simple Energy


