|
시장보고서
상품코드
1502202
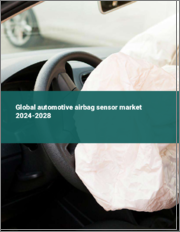
자동차용 에어백 센서 시장(2024-2028년)Global automotive airbag sensor market 2024-2028 |
||||||
Technavio사는 자동차용 에어백 센서 시장이 2023-2028년간 2억 2,700만 달러 확대되고, 예측 기간 중 연평균 복합 성장률(CAGR)은 6.22%로 성장할 것으로 예측했습니다.
자동차용 에어백 센서 시장에 대한 전체적인 분석, 시장 규모와 예측, 동향, 성장 촉진요인, 과제, 약 25개 벤더를 대상으로 한 벤더 분석 등의 정보를 게재했습니다.
현재의 시장 시나리오, 최신 동향과 촉진요인, 시장 환경 전체에 관한 최신 분석을 제공합니다. 저비용 국가로의 생산 이동, 에어백 증가에 의한 차량 안전성 향상, 충돌 시험이나 NCAP 평가의 중요성 증가에 의해 시장 성장이 촉진되고 있습니다.
| 시장 범위 | |
|---|---|
| 기준년 | 2024년 |
| 종료년 | 2028년 |
| 예측 기간 | 2024-2028년 |
| 성장 모멘텀 | 가속 |
| YOY 2024 | 5.76% |
| CAGR | 6.22% |
| 증분액 | 2억 2,700만 달러 |
본 조사에서는 센서 기술 진보가 향후 몇 년간 자동차용 에어백 센서 시장 성장을 가속하는 주요인 중 하나로 보고 있습니다. 또한 커튼 에어백에 관한 향후 규제가 시장 성장을 뒷받침하고, 에어백용 MEMS 센서는 시장의 큰 수요로 연결될 것입니다.
목차
제1장 주요 요약
- 시장 개요
제2장 시장 구도
- 시장 생태계
- 시장 특징
- 밸류체인 분석
제3장 시장 규모 평가
- 시장의 정의
- 시장 부문 분석
- 시장 규모(2023년)
- 시장 전망(2023-2028년)
제4장 시장 규모 실적
- 세계 자동차용 에어백 센서 시장(2018-2022년)
- 용도별 부문 분석(2018-2022년)
- 최종사용자별 부문 분석(2018-2022년)
- 지역별 부문 분석(2018-2022년)
- 국가별 부문 분석(2018-2022년)
제5장 Five Forces 분석
- Five Forces 요약
- 바이어의 교섭력
- 공급 기업의 교섭력
- 신규 진출업체의 위협
- 대체품의 위협
- 경쟁 위협
- 시장 현황
제6장 시장 세분화 : 용도별
- 시장 세분화
- 비교 : 용도별
- 승용차 : 시장 규모와 예측(2023-2028년)
- LCV : 시장 규모와 예측(2023-2028년)
- MCV/HCV : 시장 규모와 예측(2023-2028년)
- 시장 기회 : 용도별
제7장 시장 세분화 : 최종사용자별
- 시장 세분화
- 비교 : 최종사용자별
- OEM : 시장 규모와 예측(2023-2028년)
- 애프터마켓 : 시장 규모와 예측(2023-2028년)
- 시장 기회 : 최종사용자별
제8장 고객 상황
- 고객 상황 개요
제9장 지역별 상황
- 지역별 세분화
- 지역별 비교
- 아시아태평양 : 시장 규모와 예측(2023-2028년)
- 유럽 : 시장 규모와 예측(2023-2028년)
- 북미 : 시장 규모와 예측(2023-2028년)
- 남미 : 시장 규모와 예측(2023-2028년)
- 중동 및 아프리카 : 시장 규모와 예측(2023-2028년)
- 중국 : 시장 규모와 예측(2023-2028년)
- 미국 : 시장 규모와 예측(2023-2028년)
- 일본 : 시장 규모와 예측(2023-2028년)
- 독일 : 시장 규모와 예측(2023-2028년)
- 한국 : 시장 규모와 예측(2023-2028년)
- 시장 기회 : 지역별
제10장 성장 촉진요인, 과제, 기회 및 억제요인
- 시장 성장 촉진요인
- 시장이 해결해야 할 과제
- 성장 촉진요인과 과제의 영향
- 시장 기회 및 성장 억제요인
제11장 경쟁 구도
- 개요
- 경쟁 구도
- 혼란 상황
- 업계 리스크
제12장 경쟁 분석
- 기업 개요
- 기업의 시장 포지셔닝
- Analog Devices Inc.
- Ashimori Industry Co. Ltd.
- Autoliv Inc.
- Continental AG
- DENSO Corp.
- HELLA GmbH and Co. KGaA
- Hyundai Motor Group
- Infineon Technologies AG
- Mitsubishi Electric Corp.
- Nihon Plast Co. Ltd.
- Ningbo Joyson Electronics Corp.
- NXP Semiconductors NV
- Robert Bosch GmbH
- Toyoda Gosei Co. Ltd.
- ZF Friedrichshafen AG
제13장 부록
LSH 24.07.04Technavio has been monitoring the automotive airbag sensor market and is forecast to grow by USD 227 mn during 2023-2028, accelerating at a CAGR of 6.22% during the forecast period. Our report on the automotive airbag sensor market provides a holistic analysis, market size and forecast, trends, growth drivers, and challenges, as well as vendor analysis covering around 25 vendors.
The report offers an up-to-date analysis regarding the current market scenario, the latest trends and drivers, and the overall market environment. The market is driven by production shift to low-cost countries, enhanced vehicle safety with more airbags, and growing importance of crash tests and NCAPratings.
Technavio's automotive airbag sensor market is segmented as below:
| Market Scope | |
|---|---|
| Base Year | 2024 |
| End Year | 2028 |
| Series Year | 2024-2028 |
| Growth Momentum | Accelerate |
| YOY 2024 | 5.76% |
| CAGR | 6.22% |
| Incremental Value | $227mn |
By Application
- Passenger cars
- LCVs
- MCVs and HCVs
By End-user
- OEMs
- Aftermarket
By Geography
- APAC
- Europe
- North America
- South America
- Middle East and Africa
This study identifies the advancements in sensor technology as one of the prime reasons driving the automotive airbag sensor market growth during the next few years. Also, future regulations on curtain airbags to boost market growth and mems sensors for airbags will lead to sizable demand in the market.
Technavio presents a detailed picture of the market by the way of study, synthesis, and summation of data from multiple sources by an analysis of key parameters. Our report on the automotive airbag sensor market covers the following areas:
- Automotive airbag sensor market sizing
- Automotive airbag sensor market forecast
- Automotive airbag sensor market industry analysis
Technavio's robust vendor analysis is designed to help clients improve their market position, and in line with this, this report provides a detailed analysis of several leading automotive airbag sensor market vendors that include Analog Devices Inc., Aptiv Plc, Ashimori Industry Co. Ltd., Autoliv Inc., Continental AG, Daicel Corp., DENSO Corp., Dorman Products Inc., HELLA GmbH and Co. KGaA, Hyundai Motor Group, Infineon Technologies AG, Magna International Inc., Mitsubishi Electric Corp., Nihon Plast Co. Ltd., Ningbo Joyson Electronics Corp., NXP Semiconductors NV, Robert Bosch GmbH, TaiHangChangQing Automobile Safety System Co. Ltd., Toyoda Gosei Co. Ltd., and ZF Friedrichshafen AG. Also, the automotive airbag sensor market analysis report includes information on upcoming trends and challenges that will influence market growth. This is to help companies strategize and leverage all forthcoming growth opportunities.
The study was conducted using an objective combination of primary and secondary information including inputs from key participants in the industry. The report contains a comprehensive market and vendor landscape in addition to an analysis of the key vendors.
Technavio presents a detailed picture of the market by the way of study, synthesis, and summation of data from multiple sources by an analysis of key parameters such as profit, pricing, competition, and promotions. It presents various market facets by identifying the key industry influencers. The data presented is comprehensive, reliable, and a result of extensive research - both primary and secondary. Technavio's market research reports provide a complete competitive landscape and an in-depth vendor selection methodology and analysis using qualitative and quantitative research to forecast accurate market growth.
Table of Contents
1 Executive Summary
- 1.1 Market overview
- Executive Summary - Chart on Market Overview
- Executive Summary - Data Table on Market Overview
- Executive Summary - Chart on Global Market Characteristics
- Executive Summary - Chart on Market by Geography
- Executive Summary - Chart on Market Segmentation by Application
- Executive Summary - Chart on Market Segmentation by End-user
- Executive Summary - Chart on Incremental Growth
- Executive Summary - Data Table on Incremental Growth
- Executive Summary - Chart on Company Market Positioning
2 Market Landscape
- 2.1 Market ecosystem
- Parent Market
- Data Table on - Parent Market
- 2.2 Market characteristics
- Market characteristics analysis
- 2.3 Value chain analysis
- Value Chain Analysis
3 Market Sizing
- 3.1 Market definition
- Offerings of companies included in the market definition
- 3.2 Market segment analysis
- Market segments
- 3.3 Market size 2023
- 3.4 Market outlook: Forecast for 2023-2028
- Chart on Global - Market size and forecast 2023-2028 ($ million)
- Data Table on Global - Market size and forecast 2023-2028 ($ million)
- Chart on Global Market: Year-over-year growth 2023-2028 (%)
- Data Table on Global Market: Year-over-year growth 2023-2028 (%)
4 Historic Market Size
- 4.1 Global Automotive Airbag Sensor Market 2018 - 2022
- Historic Market Size - Data Table on Global Automotive Airbag Sensor Market 2018 - 2022 ($ million)
- 4.2 Application segment analysis 2018 - 2022
- Historic Market Size - Application Segment 2018 - 2022 ($ million)
- 4.3 End-user segment analysis 2018 - 2022
- Historic Market Size - End-user Segment 2018 - 2022 ($ million)
- 4.4 Geography segment analysis 2018 - 2022
- Historic Market Size - Geography Segment 2018 - 2022 ($ million)
- 4.5 Country segment analysis 2018 - 2022
- Historic Market Size - Country Segment 2018 - 2022 ($ million)
5 Five Forces Analysis
- 5.1 Five forces summary
- Five forces analysis - Comparison between 2023 and 2028
- 5.2 Bargaining power of buyers
- Bargaining power of buyers - Impact of key factors 2023 and 2028
- 5.3 Bargaining power of suppliers
- Bargaining power of suppliers - Impact of key factors in 2023 and 2028
- 5.4 Threat of new entrants
- Threat of new entrants - Impact of key factors in 2023 and 2028
- 5.5 Threat of substitutes
- Threat of substitutes - Impact of key factors in 2023 and 2028
- 5.6 Threat of rivalry
- Threat of rivalry - Impact of key factors in 2023 and 2028
- 5.7 Market condition
- Chart on Market condition - Five forces 2023 and 2028
6 Market Segmentation by Application
- 6.1 Market segments
- Chart on Application - Market share 2023-2028 (%)
- Data Table on Application - Market share 2023-2028 (%)
- 6.2 Comparison by Application
- Chart on Comparison by Application
- Data Table on Comparison by Application
- 6.3 Passenger cars - Market size and forecast 2023-2028
- Chart on Passenger cars - Market size and forecast 2023-2028 ($ million)
- Data Table on Passenger cars - Market size and forecast 2023-2028 ($ million)
- Chart on Passenger cars - Year-over-year growth 2023-2028 (%)
- Data Table on Passenger cars - Year-over-year growth 2023-2028 (%)
- 6.4 LCVs - Market size and forecast 2023-2028
- Chart on LCVs - Market size and forecast 2023-2028 ($ million)
- Data Table on LCVs - Market size and forecast 2023-2028 ($ million)
- Chart on LCVs - Year-over-year growth 2023-2028 (%)
- Data Table on LCVs - Year-over-year growth 2023-2028 (%)
- 6.5 MCVs and HCVs - Market size and forecast 2023-2028
- Chart on MCVs and HCVs - Market size and forecast 2023-2028 ($ million)
- Data Table on MCVs and HCVs - Market size and forecast 2023-2028 ($ million)
- Chart on MCVs and HCVs - Year-over-year growth 2023-2028 (%)
- Data Table on MCVs and HCVs - Year-over-year growth 2023-2028 (%)
- 6.6 Market opportunity by Application
- Market opportunity by Application ($ million)
- Data Table on Market opportunity by Application ($ million)
7 Market Segmentation by End-user
- 7.1 Market segments
- Chart on End-user - Market share 2023-2028 (%)
- Data Table on End-user - Market share 2023-2028 (%)
- 7.2 Comparison by End-user
- Chart on Comparison by End-user
- Data Table on Comparison by End-user
- 7.3 OEMs - Market size and forecast 2023-2028
- Chart on OEMs - Market size and forecast 2023-2028 ($ million)
- Data Table on OEMs - Market size and forecast 2023-2028 ($ million)
- Chart on OEMs - Year-over-year growth 2023-2028 (%)
- Data Table on OEMs - Year-over-year growth 2023-2028 (%)
- 7.4 Aftermarket - Market size and forecast 2023-2028
- Chart on Aftermarket - Market size and forecast 2023-2028 ($ million)
- Data Table on Aftermarket - Market size and forecast 2023-2028 ($ million)
- Chart on Aftermarket - Year-over-year growth 2023-2028 (%)
- Data Table on Aftermarket - Year-over-year growth 2023-2028 (%)
- 7.5 Market opportunity by End-user
- Market opportunity by End-user ($ million)
- Data Table on Market opportunity by End-user ($ million)
8 Customer Landscape
- 8.1 Customer landscape overview
- Analysis of price sensitivity, lifecycle, customer purchase basket, adoption rates, and purchase criteria
9 Geographic Landscape
- 9.1 Geographic segmentation
- Chart on Market share By Geographical Landscape2023-2028 (%)
- Data Table on Market share By Geographical Landscape2023-2028 (%)
- 9.2 Geographic comparison
- Chart on Geographic comparison
- Data Table on Geographic comparison
- 9.3 APAC - Market size and forecast 2023-2028
- Chart on APAC - Market size and forecast 2023-2028 ($ million)
- Data Table on APAC - Market size and forecast 2023-2028 ($ million)
- Chart on APAC - Year-over-year growth 2023-2028 (%)
- Data Table on APAC - Year-over-year growth 2023-2028 (%)
- 9.4 Europe - Market size and forecast 2023-2028
- Chart on Europe - Market size and forecast 2023-2028 ($ million)
- Data Table on Europe - Market size and forecast 2023-2028 ($ million)
- Chart on Europe - Year-over-year growth 2023-2028 (%)
- Data Table on Europe - Year-over-year growth 2023-2028 (%)
- 9.5 North America - Market size and forecast 2023-2028
- Chart on North America - Market size and forecast 2023-2028 ($ million)
- Data Table on North America - Market size and forecast 2023-2028 ($ million)
- Chart on North America - Year-over-year growth 2023-2028 (%)
- Data Table on North America - Year-over-year growth 2023-2028 (%)
- 9.6 South America - Market size and forecast 2023-2028
- Chart on South America - Market size and forecast 2023-2028 ($ million)
- Data Table on South America - Market size and forecast 2023-2028 ($ million)
- Chart on South America - Year-over-year growth 2023-2028 (%)
- Data Table on South America - Year-over-year growth 2023-2028 (%)
- 9.7 Middle East and Africa - Market size and forecast 2023-2028
- Chart on Middle East and Africa - Market size and forecast 2023-2028 ($ million)
- Data Table on Middle East and Africa - Market size and forecast 2023-2028 ($ million)
- Chart on Middle East and Africa - Year-over-year growth 2023-2028 (%)
- Data Table on Middle East and Africa - Year-over-year growth 2023-2028 (%)
- 9.8 China - Market size and forecast 2023-2028
- Chart on China - Market size and forecast 2023-2028 ($ million)
- Data Table on China - Market size and forecast 2023-2028 ($ million)
- Chart on China - Year-over-year growth 2023-2028 (%)
- Data Table on China - Year-over-year growth 2023-2028 (%)
- 9.9 US - Market size and forecast 2023-2028
- Chart on US - Market size and forecast 2023-2028 ($ million)
- Data Table on US - Market size and forecast 2023-2028 ($ million)
- Chart on US - Year-over-year growth 2023-2028 (%)
- Data Table on US - Year-over-year growth 2023-2028 (%)
- 9.10 Japan - Market size and forecast 2023-2028
- Chart on Japan - Market size and forecast 2023-2028 ($ million)
- Data Table on Japan - Market size and forecast 2023-2028 ($ million)
- Chart on Japan - Year-over-year growth 2023-2028 (%)
- Data Table on Japan - Year-over-year growth 2023-2028 (%)
- 9.11 Germany - Market size and forecast 2023-2028
- Chart on Germany - Market size and forecast 2023-2028 ($ million)
- Data Table on Germany - Market size and forecast 2023-2028 ($ million)
- Chart on Germany - Year-over-year growth 2023-2028 (%)
- Data Table on Germany - Year-over-year growth 2023-2028 (%)
- 9.12 South Korea - Market size and forecast 2023-2028
- Chart on South Korea - Market size and forecast 2023-2028 ($ million)
- Data Table on South Korea - Market size and forecast 2023-2028 ($ million)
- Chart on South Korea - Year-over-year growth 2023-2028 (%)
- Data Table on South Korea - Year-over-year growth 2023-2028 (%)
- 9.13 Market opportunity by geography
- Market opportunity By Geographical Landscape($ million)
- Data Tables on Market opportunity By Geographical Landscape($ million)
10 Drivers, Challenges, and Opportunity/Restraints
- 10.1 Market drivers
- 10.2 Market challenges
- 10.3 Impact of drivers and challenges
- Impact of drivers and challenges in 2023 and 2028
- 10.4 Market opportunities/restraints
11 Competitive Landscape
- 11.1 Overview
- 11.2 Competitive Landscape
- Overview on criticality of inputs and factors of differentiation
- 11.3 Landscape disruption
- Overview on factors of disruption
- 11.4 Industry risks
- Impact of key risks on business
12 Competitive Analysis
- 12.1 Companies profiled
- Companies covered
- 12.2 Market positioning of companies
- Matrix on companies position and classification
- 12.3 Analog Devices Inc.
- Analog Devices Inc. - Overview
- Analog Devices Inc. - Business segments
- Analog Devices Inc. - Key news
- Analog Devices Inc. - Key offerings
- Analog Devices Inc. - Segment focus
- 12.4 Ashimori Industry Co. Ltd.
- Ashimori Industry Co. Ltd. - Overview
- Ashimori Industry Co. Ltd. - Business segments
- Ashimori Industry Co. Ltd. - Key offerings
- Ashimori Industry Co. Ltd. - Segment focus
- 12.5 Autoliv Inc.
- Autoliv Inc. - Overview
- Autoliv Inc. - Product / Service
- Autoliv Inc. - Key news
- Autoliv Inc. - Key offerings
- 12.6 Continental AG
- Continental AG - Overview
- Continental AG - Business segments
- Continental AG - Key news
- Continental AG - Key offerings
- Continental AG - Segment focus
- 12.7 DENSO Corp.
- DENSO Corp. - Overview
- DENSO Corp. - Business segments
- DENSO Corp. - Key news
- DENSO Corp. - Key offerings
- DENSO Corp. - Segment focus
- 12.8 HELLA GmbH and Co. KGaA
- HELLA GmbH and Co. KGaA - Overview
- HELLA GmbH and Co. KGaA - Business segments
- HELLA GmbH and Co. KGaA - Key news
- HELLA GmbH and Co. KGaA - Key offerings
- HELLA GmbH and Co. KGaA - Segment focus
- 12.9 Hyundai Motor Group
- Hyundai Motor Group - Overview
- Hyundai Motor Group - Business segments
- Hyundai Motor Group - Key news
- Hyundai Motor Group - Key offerings
- Hyundai Motor Group - Segment focus
- 12.10 Infineon Technologies AG
- Infineon Technologies AG - Overview
- Infineon Technologies AG - Business segments
- Infineon Technologies AG - Key news
- Infineon Technologies AG - Key offerings
- Infineon Technologies AG - Segment focus
- 12.11 Mitsubishi Electric Corp.
- Mitsubishi Electric Corp. - Overview
- Mitsubishi Electric Corp. - Business segments
- Mitsubishi Electric Corp. - Key news
- Mitsubishi Electric Corp. - Key offerings
- Mitsubishi Electric Corp. - Segment focus
- 12.12 Nihon Plast Co. Ltd.
- Nihon Plast Co. Ltd. - Overview
- Nihon Plast Co. Ltd. - Business segments
- Nihon Plast Co. Ltd. - Key offerings
- Nihon Plast Co. Ltd. - Segment focus
- 12.13 Ningbo Joyson Electronics Corp.
- Ningbo Joyson Electronics Corp. - Overview
- Ningbo Joyson Electronics Corp. - Product / Service
- Ningbo Joyson Electronics Corp. - Key offerings
- 12.14 NXP Semiconductors NV
- NXP Semiconductors NV - Overview
- NXP Semiconductors NV - Product / Service
- NXP Semiconductors NV - Key news
- NXP Semiconductors NV - Key offerings
- 12.15 Robert Bosch GmbH
- Robert Bosch GmbH - Overview
- Robert Bosch GmbH - Product / Service
- Robert Bosch GmbH - Key news
- Robert Bosch GmbH - Key offerings
- 12.16 Toyoda Gosei Co. Ltd.
- Toyoda Gosei Co. Ltd. - Overview
- Toyoda Gosei Co. Ltd. - Business segments
- Toyoda Gosei Co. Ltd. - Key offerings
- Toyoda Gosei Co. Ltd. - Segment focus
- 12.17 ZF Friedrichshafen AG
- ZF Friedrichshafen AG - Overview
- ZF Friedrichshafen AG - Business segments
- ZF Friedrichshafen AG - Key news
- ZF Friedrichshafen AG - Key offerings
- ZF Friedrichshafen AG - Segment focus
13 Appendix
- 13.1 Scope of the report
- 13.2 Inclusions and exclusions checklist
- Inclusions checklist
- Exclusions checklist
- 13.3 Currency conversion rates for US$
- Currency conversion rates for US$
- 13.4 Research methodology
- Research methodology
- 13.5 Data procurement
- Information sources
- 13.6 Data validation
- Data validation
- 13.7 Validation techniques employed for market sizing
- Validation techniques employed for market sizing
- 13.8 Data synthesis
- Data synthesis
- 13.9 360 degree market analysis
- 360 degree market analysis
- 13.10 List of abbreviations
- List of abbreviations