
|
시장보고서
상품코드
1494936
VLEO 위성 시장(2024-2030년)Global VLEO Satellites Market: 2024-2030 |
||||||
| 주요 통계 | |
|---|---|
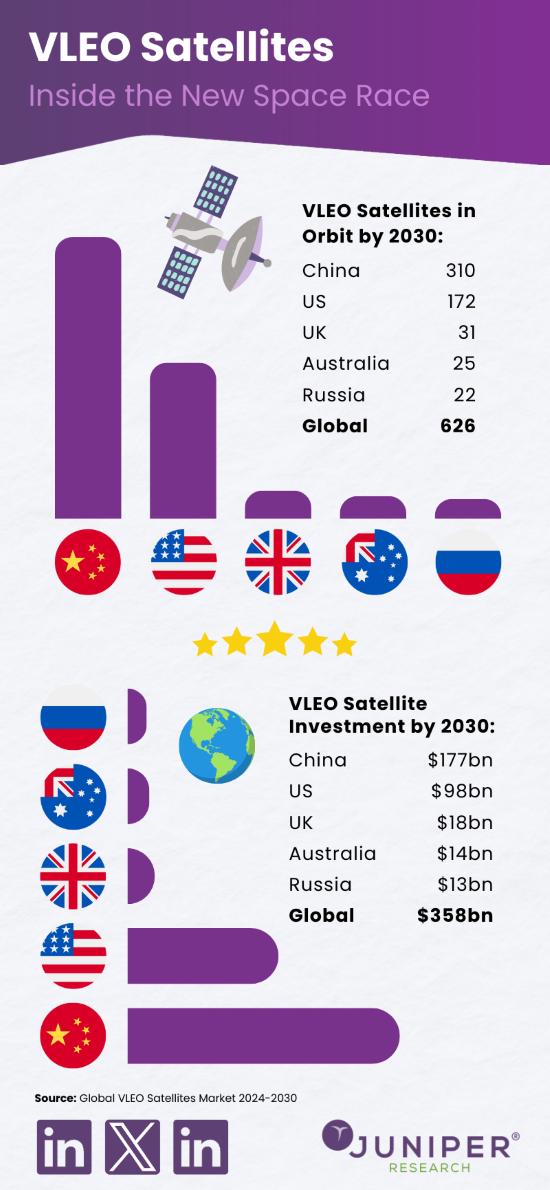
| 2030년 궤도의 VLEO 위성 수: | 626 |
| 2024년 VLEO 위성 발사에 대한 투자 금액: | 172억 달러 |
| 시장 성장률(2024-2030년) : | 66% |
| 예측 기간: | 2024-2030년 |
본 조사 패키지에서는 세계 VLEO 위성 시장을 조사했으며, 주요 동향, 현재의 이용 사례, 장래의 성장 기회, 주요 과제와 대책,제안, 용도, 지역별 위성 총수의 추이,예측, 주요 벤더 경쟁 리더 보드 등을 정리했습니다.
시장 데이터 및 예측
- 궤도상의 LEO 위성의 총수
- 궤도상의 VLEO 위성의 총수:
- 공공
- 상업
- 정부기관
- 군
- VLEO 위성 발사 1회당 평균 비용
- VLEO 위성 발사에 대한 투자 총액
SAMPLE VIEW
시장 동향 및 예측(PDF 보고서)

현재 시장 상황을 종합적으로 분석하고 전략적 권장 사항과 예측의 연습을 게재
목차
제1장 중요 포인트,전략적 권장 사항
- VLEO 위성: 중요 포인트
- VLEO 위성: 전략적 권장 사항
제2장 향후 시장 전망
- 소개
- VLEO 위성 개발
- VLEO 위성과 LEO 위성 및 MEO 위성
- 향후 시장 전망
- VLEO 위성의 장점
- 궤도상의 파편 충돌 위험 감소
- 비용 절감
- 낮은 레이턴시
- 지구 이미지
- 액티브 시스템
- 패시브 시스템
- VLEO 위성 도입의 수혜자와 장점
- 농업
- 환경 모니터링
- 도시계획?개발
- 재해 대응,관리
- 방위,안전 보장
- 리소스 관리
- 과학연구
- 수익화 기회
- 해상 감시/연결
- VLEO 위성의 구현
- 수익화 기회
- 기내 감시,접속
- VLEO 위성의 구현
- 수익화 기회
- 국제 보안
- VLEO 위성의 구현
- 수익화 기회
- 환경 모니터링
- VLEO 위성의 구현
- 수익화 기회
- 월액 이용료
- GPS 내비게이션
- VLEO 위성의 구현
- 수익화 기회
- 천체 물리학에의 응용
- VLEO 위성의 구현
- 수익화 기회
- VLEO 위성이 통신 및 접속 시장에 미치는 영향
- IoT 연결
- 5G가 VLEO 연결에 미치는 영향
- 디바이스에 직접/셀에 직접
- VLEO 위성과 관련된 과제
- 대기저항
- i.환경 스트레스
- 우주환경의 지속가능성
- i. 우주 태양에너지
- 위성 접근의 윤리
- 대기저항
- VLEO 위성 서비스 도입에 대한 규제와 시장 역학의 영향
제3장 국가별 준비지수
- 국가별 준비 지수: 개요
- 중점 시장
- CASIC
- CNSA(China National Space Administration)
- DARPA(Defense Advanced Research Projects Agency)
- The UK Space Agency
- LEO2VLEO
- DISCOVERER Project
- 홍콩
- 성장 시장
- 신흥국 시장
제4장 Future Leader Index
- 이 보고서를 읽는 이유
- Albedo
- Blue Canyon Technologies
- Cspace Intelligent Technology
- EOI Space
- LeoLabs
- Space Forge
- Thales Alenia
- Tyvak International
- 주니퍼 리서치 리더보드 평가방법
- 제한과 해석
제5장 시장 예측,중요 포인트
- VLEO 위성 예측 : 소개
- 발사된 VLEO 위성의 총수
- VLEO 위성 발사에 대한 총 투자액
- 주로 상용 이용을 목적으로 한 VLEO 위성의 총수
- 주로 민간 용도로 사용되는 VLEO 위성의 총수
- 주로 정부 용도로 사용되는 VLEO 위성의 총수
- 주로 군사 용도로 사용되는 VLEO 위성의 총수
| KEY STATISTICS | |
|---|---|
| VLEO satellites in orbit by 2030: | 626 |
| Investment into VLEO satellite launches in 2024: | $17.2bn |
| 2024 to 2030 market growth: | 66% |
| Forecast period: | 2024-2030 |
Overview
Our "VLEO (Very Low Earth Orbit) Satellites" research suite provides a detailed and insightful perspective into this upcoming lucrative space industry market; enabling stakeholders from operators, satellite network operators and technology vendors to understand its future growth opportunities in technological space capabilities (both on a country and global level), key trends, and the competitive environment in the commercial space. This space technology research assesses the current use cases providing the most immediate revenue opportunities (such as continuous coverage for telecommunications), as well as the use cases proving long-term investment opportunities, with adjacent markets such as LEO orbits also being considered. Additionally, it provides insight into the major challenges (including space environment, launch costs, atmospheric drag, sustainability and ethics) in the VLEO satellite market with bespoke recommendations on how to mitigate these challenges in the space economy.
From single satellite launches to full satellite constellations, this space economy research suite provides a thorough assessment of the VLEO satellite market and includes both a data deliverable; sizing the market, and providing key forecast data across 60 countries, as well as a Strategy & Trends document which gives a complete assessment of key trends, challenges, and recommendations for stakeholders. Collectively, the primary advantages of this data are in providing a critical tool for understanding this rapidly emerging market; supporting operators, OEMs, technology partners and satellite network operators to shape their future market strategy in space technology.
Key Features
- Market Dynamics: Insights into key trends and market expansion within the VLEO satellites market; addressing challenges posed by the highly technical nature of VLEO satellites, atmospheric conditions, and the potential use cases of increasing VLEO satellite deployment. Additionally, our VLEO satellite market research includes a regional market growth analysis on the current technological development and segment growth of VLEO satellites in 60 countries, as well as providing a future outlook.
- Key Takeaways & Strategic Recommendations: In-depth analysis of key development opportunities and findings within the VLEO satellites market; accompanied by strategic recommendations for stakeholders.
- Benchmark Industry Forecasts: Comprehensive forecast data including total number of VLEO satellite launches, split by four key use cases including commercial, civil, government, and military, as well as total and cumulative investments into VLEO satellite launches.
- Juniper Research Future Leader Index: Key player capability and capacity assessment for nine leading VLEO satellite vendors in the market space, via the Juniper Research Future Leaders Index, featuring corporate capabilities, innovation and future prospects.
- Albedo
- Blue Canyon Technologies
- Cspace Intelligent Technology
- Earth Observant (EOI Space)
- LeoLabs
- Redwire
- Space Forge
- Thales Alenia Space
- Tyvak International
Additionally, it includes a forecast summary of the total investment into VLEO satellite launches in 2030.
Market Data & Forecasts
The market-leading research suite for the VLEO satellites market includes access to the full set of forecast data of 20 tables and over 8,600 datapoints. Key metrics in the research suite include:
- Total Number of LEO (Low Earth Orbit) Satellites in Orbit
- Total Number of VLEO Satellites in Orbit, also split by:
- Civil
- Commercial
- Government Agencies
- Military
- Average Cost per VLEO Satellite Launch
- Total Investment into VLEO Satellite Launches
Juniper Research's Interactive Forecast Excel contains the following functionality:
- Statistics Analysis: Users benefit from the ability to search for specific metrics, displayed for all regions and countries across the data period. Graphs are easily modified and can be exported to the clipboard.
- Country Data Tool: This tool lets users look at metrics for all regions and countries in the forecast period. Users can refine the metrics displayed via a search bar.
- Country Comparison Tool: Users can select and compare specific countries. The ability to export graphs is included in this tool.
- What-if Analysis: Here, users can compare forecast metrics against their own assumptions, via 5 interactive scenarios.
A comprehensive analysis of the current market landscape, alongside strategic recommendations and a walk-through of the forecasts.
Table of Contents
1. Key Takeaways & Strategic Recommendations
- 1.1. VLEO Satellites: Key Takeaways
- 1.2. VLEO Satellites: Strategic Recommendations
2. Future Market Outlook
- 2.1. Introduction
- Figure 2.1: Satellite Orbits (Image not to Scale)
- 2.1.1. Development of VLEO Satellites
- 2.1.2. VLEO vs LEO and MEO Satellites
- i. LEO Satellites
- ii. MEO Satellites
- iii. VLEO Satellites
- 2.1.3. Future Market Prospects
- Figure 2.2: Total VLEO Satellite Launches, Split by 8 Key Regions, 2024-2030
- 2.2. Benefits of VLEO Satellites
- 2.2.1. Reduction in Orbital Debris Collision Risk
- 2.2.2. Lower Costs
- Figure 2.3: Van Allen Belt
- 2.2.3. Lower Latency
- Figure 2.4: M2M Use Cases and their Latency
- 2.3. Earth Imaging
- i. Active Systems
- ii. Passive Systems
- 2.3.2. Beneficiaries and Benefits of VLEO Satellite Implementation
- i. Agriculture
- ii. Environmental Monitoring
- iii. Urban Planning and Development
- iv. Disaster Response and Management
- v. Defence and Security
- vi. Resource Management
- vii. Scientific Research
- 2.3.3. Monetisation Opportunities
- 2.4. Maritime Surveillance/Connectivity
- 2.4.1. VLEO Satellite Implementation
- 2.4.2. Monetisation Opportunities
- 2.5. Inflight Surveillance & Connectivity
- 2.5.1. VLEO Satellite Implementation
- 2.5.2. Monetisation Opportunities
- 2.6. National Security
- 2.6.1. VLEO Satellite Implementation
- 2.6.2. Monetisation Opportunities
- 2.7. Environmental Monitoring
- 2.7.1. VLEO Satellite Implementation
- 2.7.2. Monetisation Opportunities
- i. Monthly Subscription Fee
- 2.8. GPS Navigation
- 2.8.1. VLEO Satellite Implementation
- 2.8.2. Monetisation Opportunities
- 2.9. Astrophysics Applications
- 2.9.1. VLEO Satellite Implementation
- 2.9.2. Monetisation Opportunities
- 2.10. Impact of VLEO Satellites on the Telecommunications and Connectivity Markets
- 2.10.1. IoT Connectivity
- Figure 2.5: Total Number of Cellular IoT Connections (m), Split by 8 Key Regions, 2024-2028
- 2.10.2. Impact of 5G on VLEO Connectivity
- Figure 2.6: Global Mobile 5G Active Connections (m), Split by 8 Key Regions, 2024-2029
- Figure 2.7: Spectrum Bands for Satellite Communications
- 2.10.3. Direct-to-Device/Direct-to-Cell
- 2.10.1. IoT Connectivity
- 2.11. Challenges Associated with VLEO Satellites
- 2.11.1. Atmospheric Drag
- i. Environmental Stress
- 2.11.2. Sustainability of the Space Environment
- i. Space-based Solar Energy
- 2.11.3. Ethics of Satellite Access
- 2.11.1. Atmospheric Drag
- 2.12. The Impact of Regulatory and Market Dynamics on the Adoption of VLEO Satellite Services
3. Country Readiness Index
- 3.1. Introduction to the Country Readiness Index
- Figure 3.1: VLEO Satellites Country Readiness Index Regional Definitions
- Table 3.2: Juniper Research Country Readiness Index Scoring Criteria: VLEO Satellites
- Figure 3.3: Juniper Research Country Readiness Index: VLEO Satellites
- Table 3.4: VLEO Satellites Country Readiness Index: Market Segmentation
- 3.2. Focus Markets
- Figure 3.5: Map Displaying VLEO Satellite Launches in 2030
- i. CASIC
- ii. CNSA (China National Space Administration)
- iii. DARPA (Defense Advanced Research Projects Agency)
- iv. The UK Space Agency
- v. LEO2VLEO
- vi. DISCOVERER Project
- vii. Hong Kong
- 3.3. Growth Markets
- Figure 3.6: Total Number of Cellular IoT Connections in Growth Markets in 2028 (m), Split by 7 Key Countries
- 3.4. Developing Markets
- Table 3.7: VLEO Satellites Country Readiness Index: North America
- Table 3.8: VLEO Satellites Country Readiness Index: Latin America
- Table 3.9: VLEO Satellites Country Readiness Index: West Europe
- Table 3.10: VLEO Satellites Country Readiness Index: Central & Eastern Europe
- Table 3.11: VLEO Satellites Country Readiness Index: Far East & China
- Table 3.12: VLEO Satellites Country Readiness Index: Indian Subcontinent
- Table 3.13: VLEO Satellites Country Readiness Index: Rest of Asia Pacific
- Table 3.14: VLEO Satellites Country Readiness Index: Africa & Middle East
4. Future Leader Index
- 4.1. Why Read this Report
- Table 4.1: Juniper Research Future Leader Index: VLEO Vendor Solutions (Part 1)
- Table 4.2: Juniper Research Future Leader Index: VLEO Vendor Solutions (Part 2)
- Figure 4.3: Juniper Research Future Leader Index: VLEO Satellites Vendors
- Table 4.4: Juniper Research VLEO Satellites Vendors Ranking
- Table 4.5: Juniper Research Future Leader Index Heatmap: VLEO Satellite Vendors
- 4.2. Albedo
- i. Corporate Information
- ii. Geographical Spread
- iii. Key Clients & Strategic Partnerships
- iv. High-level View of Offerings
- v. Juniper Research's View: Key Strengths & Strategic Opportunities
- 4.3. Blue Canyon Technologies
- i. Corporate Information
- ii. Geographical Spread
- iii. Key Clients & Strategic Partnerships
- iv. High-level View of Offerings
- v. Juniper Research's View: Key Strengths & Strategic Opportunities
- 4.4. Cspace Intelligent Technology
- i. Corporate Information
- ii. Geographical Spread
- iii. Key Clients & Strategic Partnerships
- iv. High-level View of Offerings
- v. Juniper Research's View: Key Strengths & Strategic Opportunities
- 4.5. EOI Space
- i. Corporate Information
- ii. Geographical Spread
- iii. Key Clients & Strategic Partnerships
- iv. High-level of Offerings
- v. Juniper Research's View: Key Strengths & Strategic Opportunities
- 4.6. LeoLabs
- i. Corporate Information
- ii. Geographical Spread
- iii. High-level View of Offerings
- iv. Juniper Research's View: Key Strengths & Strategic Opportunities
- 4.7. Space Forge
- i. Corporate Information
- ii. Geographical Spread
- iii. Key Clients & Strategic Partnerships
- iv. High-level View of Offerings
- v. Juniper Research's View: Key Strengths & Strategic Opportunities
- 4.8. Thales Alenia
- i. Corporate Information
- ii. Geographical Spread
- iii. Key Clients & Strategic Partnerships
- iv. High-level View of Offerings
- v. Juniper Research's View: Key Strengths & Strategic Opportunities
- 4.9. Tyvak International
- i. Corporate Information
- ii. Geographical Spread
- iii. Key Clients & Strategic Partnerships
- iv. High-level View of Offerings
- v. Juniper Research's View: Key Strengths & Strategic Opportunities
- 4.10. Redwire
- i. Corporate Information
- ii. Geographical Spread
- iii. Key Clients & Strategic Partnerships
- iv. High-level View of Offerings
- v. Juniper Research's View: Key Strengths & Strategic Opportunities
- 4.1. Juniper Research Leaderboard Assessment Methodology
- 4.2. Limitations & Interpretations
- Table 4.6: Juniper Research Future Leader Index Criteria Table: VLEO Satellites
5. Market Forecasts and Key Takeaways
- 5.1. Introduction to VLEO Satellite Forecasts
- Figure 5.1: VLEO Satellites Forecast Methodology
- 5.2. Total Number of VLEO Satellites Launched
- Figure & Table 5.2: Total Number of VLEO Satellites Launched, Split by 8 Key Regions, 2024-2030
- 5.3. Total Investment into VLEO Satellite Launches
- Figure & Table 5.3: Total Investment into VLEO Satellite Launches ($m), Split by 8 Key Regions, 2024-2030
- Table 5.4: Cumulative Total Investment into VLEO Satellite Launches ($m), Split by 8 Key Regions, 2024-2030
- 5.4. Total VLEO Satellites Primarily for Used Commercial Applications
- Figure & Table 5.5: Total Number of VLEO Satellites Primarily Used for Commercial Applications, Split by 8 Key Regions, 2024-2030
- 5.5. Total VLEO Satellites Primarily Used for Civil Applications
- Figure & Table 5.6: Total Number of VLEO Satellites Primarily Used for Civil Applications, Split by 8 Key Regions, 2024-2030
- 5.6. Total VLEO Satellites Primarily Used for Government Applications
- Figure & Table 5.7: Total Number of VLEO Satellites Primarily Used for Government Applications, Split by 8 Key Regions, 2024-2030
- 5.7. Total VLEO Satellites Primarily Used for Military Applications
- Figure & Table 5.8: Total Number of VLEO Satellites Primarily Used for Military Applications, Split by 8 Key Regions, 2024-2030
