|
시장보고서
상품코드
1931748
공급망용 AI 시장 : 제공별, 전개별, 조직 규모별, 용도별, 최종 이용 산업별, 지역별 - 세계 예측(-2032년)AI in Supply Chain Market by Offering (Software, Services), Deployment (Cloud, On-premises, Hybrid), Application (Demand Planning & Forecasting, Warehouse & Transportation Management, Supply Chain Risk Management) - Global Forecast to 2032 |
||||||
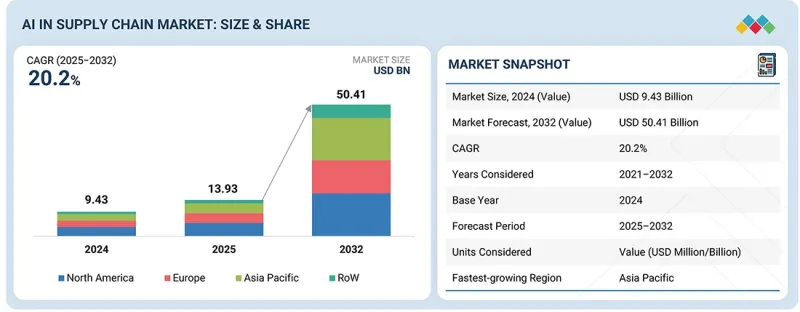
세계의 공급망용 AI 시장 규모는 2025년 139억 3,000만 달러에서 2032년까지 504억 1,000만 달러에 달할 것으로 예측되며, CAGR은 20.2%로 전망됩니다. 조직이 공급망의 복잡성, 수요의 변화, 잦은 업무 중단에 대응하면서 시장은 빠르게 성장하고 있습니다.
| 조사 범위 | |
|---|---|
| 조사 대상 기간 | 2021-2032년 |
| 기준 연도 | 2024년 |
| 예측 기간 | 2025-2032년 |
| 대상 단위 | 금액(10억 달러) |
| 부문 | 제공별, 전개별, 조직 규모별, 용도별, 최종 이용 산업별, 지역별 |
| 대상 지역 | 북미, 유럽, 아시아태평양, 기타 지역 |
기업들은 AI를 활용하여 수요 예측의 정확도 향상, 재고 관리, 물류 계획의 최적화를 추진하고 있습니다. 이를 통해 신속하고 정확한 의사결정을 내릴 수 있습니다. 클라우드 기반 시스템, 실시간 데이터 활용, 디지털 공급망 플랫폼의 보급이 성장을 더욱 가속화하고 있습니다. 세계 공급망의 탄력성 강화, 비용 절감, 전반적인 가시성 확보에 대한 관심이 높아짐에 따라 AI는 산업 전반의 데이터 기반 공급망 혁신에 필수적인 요소로 자리 잡고 있습니다.

공급망용 AI 시장에서 서비스 분야는 빠른 성장이 예상됩니다. 이러한 성장은 AI 프로젝트의 복잡성과 맞춤형 솔루션의 필요성에 의해 주도되고 있습니다. 조직은 데이터 준비, 모델 커스터마이징, 시스템 통합, 기존 ERP, 창고, 운송 시스템과의 AI 연계 등 전문적인 서비스를 요구합니다. 또한, 수요 패턴과 공급 상황의 변화에 따라 AI 모델의 정확성을 유지하기 위해 변경 관리, 사용자 교육, 지속적인 최적화도 서비스 분야가 담당하는 중요한 역할입니다. 기업들이 다양한 기능과 지역에 AI를 도입하면서 컨설팅, 매니지드 서비스, 성능 모니터링에 대한 수요가 증가하고 있습니다. 클라우드 및 구독 기반 AI 시스템으로의 전환은 장기적인 서비스 계약을 뒷받침하고 있으며, 서비스는 공급망 내 AI 시장의 주요 성장 요인으로 작용하고 있습니다.
대규모 조직은 복잡한 업무 프로세스, 세계 공급업체 네트워크, 기술에 대한 높은 예산 배분으로 인해 공급망용 AI 시장에서 가장 큰 점유율을 차지했습니다. 이러한 기업들은 수요 변동에 대한 대응, 재고 최적화, 여러 지역에 걸친 물류 조정 등의 과제에 직면하고 있으며, AI를 활용한 계획 수립 및 최적화가 필수적입니다. 대기업은 수요 예측, 시나리오 계획, 예측 리스크 분석, 실시간 공급망 가시성과 같은 고급 툴을 일찍이 도입한 경우가 많으며, 강력한 데이터 시스템, 클라우드 서비스, 조직 전반의 통합에 대한 투자 능력으로 AI를 신속하고 광범위하게 활용할 수 있습니다. 또한, 대기업은 일반적으로 조달, 제조, 유통에 AI를 통합하는 장기적인 디지털 혁신 계획을 추진하고 있으며, 이를 통해 시장에서의 주도적 지위를 강화하고 있습니다.
유럽은 긴밀한 무역 네트워크, 강력한 수출 지향적 산업 기반, 공급망 복원력 강화 노력으로 인해 공급망용 AI 시장에서 큰 비중을 차지할 것으로 예상됩니다. 유럽 전역의 기업들은 공급업체 리스크 관리, 생산 계획 강화, 다국적 기업 간 협업 개선을 위해 AI를 점점 더 많이 활용하고 있습니다. 인건비 상승과 노동력 부족도 창고 관리, 운송, 수요 계획에서 AI 자동화의 도입을 촉진하고 있습니다. 또한, 추적성, 지속가능성, 보고에 관한 유럽의 규제는 컴플라이언스 및 투명성 확보를 위한 AI 분석 활용을 기업에 촉구하고 있습니다. 클라우드 플랫폼, 디지털 트윈, 데이터 공유 이니셔티브의 확대는 이 지역의 대규모 AI 도입을 더욱 촉진하고 있습니다. 이러한 요인들이 결합되어 유럽 전역의 공급망 업무에 AI를 지속적으로 활용하고 있으며, 강력한 시장 입지를 유지하고 있습니다.
공급망용 AI 시장 분야의 주요 업계 전문가를 대상으로 2차 조사에서 수집한 다양한 부문 및 하위 부문의 시장 규모를 확정하고 검증하기 위해 광범위한 1차 인터뷰를 실시했습니다. 본 보고서의 1차 조사 대상자 내역은 다음과 같습니다.
이번 조사에는 부품 공급업체부터 Tier 1 기업, OEM에 이르기까지 다양한 업계 전문가들의 의견이 포함되어 있습니다. 1차 조사 대상자 내역은 다음과 같습니다:
공급망용 AI 시장에는 SAP SE(독일), Oracle(미국), Blue Yonder Group, Inc.(미국), Kinaxis Inc.(캐나다), Manhattan Associates(미국), IBM(미국), Microsoft(미국), Amazon Web Services, Inc.(미국), Anaplan, Inc.(미국), Logility Supply Chain Solutions, Inc.(미국) 등이 있습니다.
공급망 내 AI 시장의 주요 기업들에 대해 기업 프로파일, 최근 동향, 주요 시장 전략 등 상세한 경쟁 분석을 실시했으며, 향후 시장 전망에 대해 조사했습니다.
조사 범위
이 보고서는 공급망용 AI 시장을 오퍼링, 배포, 조직 규모, 애플리케이션, 최종 사용 산업별로 세분화하여 분석합니다. 또한, 시장 촉진요인 및 과제, 시장 억제요인에 대해서도 논의하고 있습니다. 북미, 유럽, 아시아태평양, 기타 지역 등 4개 주요 지역에 대한 상세한 시장 전망을 제공합니다. 본 보고서에는 주요 진입기업에 대한 생태계 분석도 포함되어 있습니다.
본 보고서 구매의 주요 이점
- 주요 촉진요인 분석(빅데이터 및 AI 기술 도입 확대, 공급망 프로세스 가시성 향상 필요성, 고객 만족도 향상을 위한 AI 신속 도입, 클라우드 기반 공급망 솔루션으로의 전환, 공급망 회복력 및 리스크 감소에 대한 강조), 제약요인(숙련된 인력 부족, 보안 및 개인 정보 보호에 대한 우려, 지능형 비즈니스 프로세스 및 자동화에 대한 수요 급증), 기회(AI별 업무 효율성 향상에 대한 수요 급증) 제약요인(숙련된 인력 부족, 보안 및 데이터 프라이버시 우려, 높은 도입 및 통합 비용), 기회(지능형 비즈니스 프로세스 및 자동화에 대한 수요 급증, AI에 의한 업무 효율성 향상, 실시간 의사결정 인텔리전스를 위한 생성형 AI의 부상), 도전과제(원활한 데이터 통합의 어려움) 원활한 데이터 통합의 어려움, 데이터 품질 및 가용성 편차)
- 서비스 개발/혁신 : 공급망용 AI 시장의 향후 기술 동향, 연구개발 활동, 신제품 및 서비스 출시에 대한 상세 분석
- 시장 개발 : 다양한 지역의 공급망용 AI 시장 분석을 통해 수익성 높은 시장에 대한 종합적인 정보를 제공합니다.
- 시장 다각화 : 공급망용 AI 시장의 새로운 소프트웨어 및 서비스, 미개척 지역, 최근 동향, 투자 동향에 대한 종합적인 정보를 제공합니다.
- 경쟁사 평가 : SAP SE(독일), Oracle(미국), Blue Yonder Group, Inc. Services, Inc.(미국), Anaplan, Inc.(미국), Logility Supply Chain Solutions, Inc.(미국) 등 주요 기업의 시장 점유율, 성장 전략, 제품 라인업에 대한 상세한 분석
자주 묻는 질문
목차
제1장 소개
제2장 주요 요약
제3장 주요 인사이트
제4장 시장 개요
- 시장 역학
- 성장 촉진요인
- 성장 억제요인
- 기회
- 과제
- 상호 접속된 시장과 분야 횡단적인 기회
- 상호 접속된 시장
- 크로스 부문 기회
- Tier 1/2/3 기업의 전략적 활동
- 시장 역학
제5장 업계 동향
- Porter's Five Forces 분석
- 거시경제 지표
- 밸류체인 분석
- 생태계 분석
- 가격 분석
- 2025-2027년의 주요 회의와 이벤트
- 고객 비즈니스에 영향을 미치는 동향/혼란
- 투자와 자금 조달 시나리오
- 사례 연구 분석
- 2025년 미국 관세의 영향 - 공급망용 AI 시장
제6장 기술의 진보, AI에 의한 영향, 특허, 혁신, 향후 응용
- 주요 신기술
- 보완적 기술
- 인접 기술
- 기술/제품 로드맵
- 특허 분석
제7장 규제 상황
- 규제기관, 정부기관, 기타 조직
- 표준
- 정부 규제
제8장 고객 상황과 구매 행동
- 의사결정 프로세스
- 구매 프로세스에 관여하는 주요 이해관계자와 그 평가 기준
- 구매 프로세스의 주요 이해관계자
- 구입 기준
- 채용 장벽과 내부 과제
- 다양한 최종 이용 산업 미충족 수요
제9장 공급망용 AI 시장(제공별)
- 소프트웨어
- 서비스
제10장 공급망용 AI 시장(전개별)
- 클라우드
- 온프레미스
- 하이브리드
제11장 공급망용 AI 시장(조직 규모별)
- 대규모 조직
- 중소기업
제12장 공급망용 AI 시장(용도별)
- 수요 계획과 예측
- 조달
- 재고 관리
- 생산 계획과 스케줄링
- 창고·운송 관리
- 공급망 리스크 관리
- 기타
제13장 공급망용 AI 시장(최종 이용 산업별)
- 소매
- 헬스케어·의약품
- 식품 및 음료
- 자동차
- 물류·운송
- 항공우주 및 방위
- 화학제품
- 일렉트로닉스·반도체
- 에너지·유틸리티
- 제조
- 기타
제14장 공급망용 AI 시장(지역별)
- 북미
- 미국
- 캐나다
- 멕시코
- 유럽
- 독일
- 영국
- 프랑스
- 이탈리아
- 기타 유럽
- 아시아태평양
- 중국
- 일본
- 한국
- 인도
- 기타
- 기타 지역
- 중동 및 아프리카
- 남미
제15장 경쟁 구도
- 개요
- 주요 진출 기업의 경쟁 전략/강점, 2021-2025년
- 매출 분석, 2021-2024년
- 시장 점유율 분석, 2024년
- 기업 평가와 재무 지표
- 브랜드/제품 비교
- 기업 평가 매트릭스 : 주요 진출 기업, 2024년
- 기업 평가 매트릭스 : 스타트업/중소기업, 2024년
- 경쟁 시나리오
제16장 기업 개요
- 주요 진출 기업
- SAP SE
- ORACLE
- BLUE YONDER GROUP, INC.
- MANHATTAN ASSOCIATES
- KINAXIS INC.
- IBM
- MICROSOFT
- AMAZON WEB SERVICES, INC.
- ANAPLAN, INC.
- LOGILITY SUPPLY CHAIN SOLUTIONS, INC.
- 기타 기업
- GEP
- COUPA
- O9 SOLUTIONS, INC.
- ALIBABA CLOUD
- ALTANA
- PROJECT44
- RESILINC CORPORATION
- FOURKITES, INC.
- FERO.AI
- INFOR
- CONVECT.AI, INC.
- LVRG, INC.
- EVERSTREAM ANALYTICS
- RELEX SOLUTIONS
- E2OPEN, LLC
제17장 조사 방법
제18장 부록
KSM 26.02.25The global AI in supply chain market is projected to reach USD 50.41 billion by 2032 from USD 13.93 billion in 2025 at a CAGR of 20.2%. The market is growing rapidly as organizations respond to greater supply chain complexity, demand changes, and regular operational disruptions.
| Scope of the Report | |
|---|---|
| Years Considered for the Study | 2021-2032 |
| Base Year | 2024 |
| Forecast Period | 2025-2032 |
| Units Considered | Value (USD Billion) |
| Segments | By Offering, Deployment, Application and Region |
| Regions covered | North America, Europe, APAC, RoW |
Businesses are using AI to improve demand forecasting, manage inventory, and plan logistics. This enables quicker and more accurate decisions. Growth is further boosted by cloud-based systems, real-time data use, and a rise in digital supply chain platforms. The focus on resilience, cost savings, and overall visibility in global supply networks is making AI essential for modern, data-driven supply chain changes across industries.
"Services segment to record highest CAGR during forecast period"
The services segment is expected to grow rapidly in the AI in supply chain market. This growth is driven by the increasing complexity of AI projects and the need for custom solutions. Organizations want specialized services for data preparation, customizing models, integrating systems, and making AI work with their existing ERP, warehouse, and transportation systems. Services are also crucial for managing change, training users, and ongoing optimization to keep AI models accurate as demand patterns and supply conditions shift. As businesses adopt AI across different functions and regions, the demand for consulting, managed services, and performance monitoring is increasing. The move toward cloud-based and subscription-based AI systems also supports long-term service contracts, making services a major growth factor in the AI in supply chain market.
"Large organizations captured largest market share in 2024"
Large organizations held the biggest market share in the AI in supply chain market, thanks to their complicated operations, global supplier networks, and higher budgets for technology. These businesses deal with more challenges around demand changes, balancing inventory, and coordinating logistics across many regions, making AI planning and optimization essential. Large organizations are often early adopters of advanced tools like demand sensing, scenario planning, predictive risk analytics, and real-time supply chain visibility. Their ability to invest in strong data systems, cloud services, and integration across the organization allows for faster and wider AI use. Furthermore, large businesses typically follow long-term digital transformation plans, embedding AI in procurement, manufacturing, and distribution, which reinforces their leading market position.
"Europe to account for a significant share of the AI in supply chain market in 2025"
Europe is expected to hold significant share in the AI in supply chain market due to its well-connected trade networks, strong export-focused industries, and commitment to supply chain resilience. Companies throughout Europe are increasingly turning to AI to manage supplier risks, enhance production planning, and improve coordination across operations in multiple countries. Rising labor costs and workforce shortages are also driving the adoption of AI automation in warehousing, transportation, and demand planning. Additionally, European regulations on traceability, sustainability, and reporting are prompting companies to use AI analytics for compliance and transparency. The growing use of cloud platforms, digital twins, and data-sharing initiatives in the region is further boosting AI adoption on a larger scale. Together, these factors are promoting ongoing use of AI in supply chain operations across Europe, maintaining its strong market presence.
Extensive primary interviews were conducted with key industry experts in the AI in supply chain market to determine and verify the market size for various segments and subsegments gathered through secondary research. The breakdown of primary participants for the report is shown below.
The study contains insights from various industry experts, from component suppliers to Tier 1 companies and OEMs. The break-up of the primaries is as follows:
- By Company Type: Tier 1 - 20%, Tier 2 - 40%, and Tier 3 - 40%
- By Designation: C-level Executives - 20%, Directors - 30%, and Others - 50%
- By Region: North America - 20%, Europe - 30%, Asia Pacific - 40%, and RoW - 10%
The AI in supply chain market is dominated by a few globally established players, such as SAP SE (Germany), Oracle (US), Blue Yonder Group, Inc. (US), Kinaxis Inc. (Canada), Manhattan Associates (US), IBM (US), Microsoft (US), Amazon Web Services, Inc. (US), Anaplan, Inc. (US), and Logility Supply Chain Solutions, Inc. (US).
The study includes an in-depth competitive analysis of these key players in the AI in supply chain market, with their company profiles, recent developments, and key market strategies.
Research Coverage
The report segments the AI in supply chain market based on offering (software, services), deployment (cloud, on-premises, hybrid), organization size (large organizations, small & medium organizations), application (demand planning & forecasting, procurement & sourcing, inventory management, production planning & scheduling, warehouse & transportation management, supply chain risk management, other applications), and end-use industry (retail, healthcare & pharmaceuticals, food & beverages, automotive, logistics & transportation, aerospace & defense, chemicals, electronics & semiconductor, energy & utilities, manufacturing, other end-use industries). It also discusses the market's drivers, restraints, opportunities, and challenges. It gives a detailed view of the market across four main regions (North America, Europe, Asia Pacific, and Rest of the World [RoW]). The report includes an ecosystem analysis of key players.
Key Benefits of Buying the Report
- Analysis of key drivers (growing implementation of big data and AI technologies, need for enhanced visibility in supply chain processes, rapid AI integration to improve customer satisfaction, shift toward cloud-based supply chain solutions, emphasis on supply chain resilience and risk mitigation post-disruptions), restraints (shortage of skilled workforce, security and data privacy concerns, high implementation and integration costs), opportunities (surge in demand for intelligent business processes and automation, improved operational efficiency with AI, emergence of generative AI for real-time decision intelligence), challenges (difficulties in seamless data integration, inconsistent data quality and availability)
- Service Development/Innovation: Detailed insights into upcoming technologies, research & development activities, and launches in the AI in supply chain market
- Market Development: Comprehensive information about lucrative markets through the analysis of the AI in supply chain market across varied regions
- Market Diversification: Exhaustive information about new software and services, untapped geographies, recent developments, and investments in the AI in supply chain market
- Competitive Assessment: In-depth assessment of market shares, growth strategies, and product offerings of leading players, such as SAP SE (Germany), Oracle (US), Blue Yonder Group, Inc. (US), Kinaxis Inc. (Canada), Manhattan Associates (US), IBM (US), Microsoft (US), Amazon Web Services, Inc. (US), Anaplan, Inc. (US), and Logility Supply Chain Solutions, Inc. (US)
TABLE OF CONTENTS
1 INTRODUCTION
- 1.1 STUDY OBJECTIVES
- 1.2 MARKET DEFINITION AND SCOPE
- 1.3 STUDY SCOPE
- 1.3.1 MARKETS COVERED
- 1.3.2 INCLUSIONS AND EXCLUSIONS
- 1.3.3 YEARS CONSIDERED
- 1.4 CURRENCY CONSIDERED
- 1.5 UNITS CONSIDERED
- 1.6 STAKEHOLDERS
- 1.7 SUMMARY OF CHANGES
2 EXECUTIVE SUMMARY
- 2.1 MARKET HIGHLIGHTS AND KEY INSIGHTS
- 2.2 KEY MARKET PARTICIPANTS: MAPPING OF STRATEGIC DEVELOPMENTS
- 2.3 DISRUPTIVE TRENDS IN AI IN SUPPLY CHAIN MARKET
- 2.4 HIGH-GROWTH SEGMENTS
- 2.5 REGIONAL SNAPSHOT: MARKET SIZE, GROWTH RATE, AND FORECAST
3 PREMIUM INSIGHTS
- 3.1 ATTRACTIVE OPPORTUNITIES FOR PLAYERS IN AI IN SUPPLY CHAIN MARKET
- 3.2 AI IN SUPPLY CHAIN MARKET, BY OFFERING
- 3.3 AI IN SUPPLY CHAIN MARKET, BY DEPLOYMENT AND ORGANIZATION SIZE
- 3.4 AI IN SUPPLY CHAIN MARKET, BY APPLICATION
- 3.5 AI IN SUPPLY CHAIN MARKET, BY END-USE INDUSTRY
- 3.6 AI IN SUPPLY CHAIN MARKET, BY COUNTRY
4 MARKET OVERVIEW
- 4.1 INTRODUCTION
- 4.2 MARKET DYNAMICS
- 4.2.1 DRIVERS
- 4.2.1.1 Growing implementation of big data and AI technologies
- 4.2.1.2 Need for enhanced visibility in supply chain processes
- 4.2.1.3 Rapid AI integration to improve customer satisfaction
- 4.2.1.4 Shift toward cloud-based supply chain solutions
- 4.2.1.5 Emphasis on supply chain resilience and risk mitigation post-disruptions
- 4.2.2 RESTRAINTS
- 4.2.2.1 Shortage of skilled workforce
- 4.2.2.2 Security and data privacy concerns
- 4.2.2.3 High implementation and integration costs
- 4.2.3 OPPORTUNITIES
- 4.2.3.1 Surge in demand for intelligent business processes and automation
- 4.2.3.2 Improved operational efficiency with AI
- 4.2.3.3 Emergence of generative AI for real-time decision intelligence
- 4.2.4 CHALLENGES
- 4.2.4.1 Difficulties in seamless data integration
- 4.2.4.2 Inconsistent data quality and availability
- 4.2.1 DRIVERS
- 4.3 INTERCONNECTED MARKETS AND CROSS-SECTOR OPPORTUNITIES
- 4.3.1 INTERCONNECTED MARKETS
- 4.3.2 CROSS-SECTOR OPPORTUNITIES
- 4.4 STRATEGIC MOVES BY TIER-1/2/3 PLAYERS
- 4.4.1 MARKET DYNAMICS
5 INDUSTRY TRENDS
- 5.1 INTRODUCTION
- 5.2 PORTER'S FIVE FORCES ANALYSIS
- 5.2.1 INTENSITY OF COMPETITIVE RIVALRY
- 5.2.2 BARGAINING POWER OF SUPPLIERS
- 5.2.3 BARGAINING POWER OF BUYERS
- 5.2.4 THREAT OF SUBSTITUTES
- 5.2.5 THREAT OF NEW ENTRANTS
- 5.3 MACROECONOMIC INDICATORS
- 5.3.1 INTRODUCTION
- 5.3.2 GDP TRENDS AND FORECAST
- 5.3.3 TRENDS IN FOOD & BEVERAGES INDUSTRY
- 5.3.4 TRENDS IN RETAIL INDUSTRY
- 5.4 VALUE CHAIN ANALYSIS
- 5.5 ECOSYSTEM ANALYSIS
- 5.6 PRICING ANALYSIS
- 5.6.1 INDICATIVE PRICING ANALYSIS OF KEY PLAYERS, BY DEPLOYMENT, 2024
- 5.6.1.1 Indicative pricing analysis of deployment types offered by key players, 2024
- 5.6.2 AVERAGE SELLING PRICE TREND, BY REGION, 2021-2024
- 5.6.1 INDICATIVE PRICING ANALYSIS OF KEY PLAYERS, BY DEPLOYMENT, 2024
- 5.7 KEY CONFERENCES AND EVENTS, 2025-2027
- 5.8 TRENDS/DISRUPTIONS IMPACTING CUSTOMER BUSINESS
- 5.9 INVESTMENT AND FUNDING SCENARIO
- 5.10 CASE STUDY ANALYSIS
- 5.10.1 SAP SE LEVERAGES AI TO BOOST FIELD SERVICE PRODUCTIVITY AND DISPATCH EFFICIENCY
- 5.10.2 WALMART IMPLEMENTS AI-ENHANCED SUPPLY CHAIN OPERATIONS TO DRIVE EFFICIENCY AND CUSTOMER EXPERIENCE
- 5.10.3 AEON OPTIMIZES LOCAL ASSORTMENTS WITH BLUE YONDER CATEGORY MANAGEMENT
- 5.10.4 ACCEL IMPROVES WAREHOUSE PRODUCTIVITY BY 35% WITH BLUE YONDER CLOUD MIGRATION
- 5.10.5 INTEL CORPORATION BRINGS GRAPHICS PROCESSING UNIT TO VEHICLE COCKPIT
- 5.10.6 IBM AND NABP DEVELOP BLOCKCHAIN-BASED PLATFORM TO ENHANCE DRUG SUPPLY CHAIN SECURITY
- 5.10.7 UNIPER SE ENHANCES ENERGY OPERATIONS WITH MICROSOFT COPILOT
- 5.10.8 NORGREN STREAMLINES SUPPLY CHAIN WITH SAP SE INTEGRATED SOLUTIONS
- 5.10.9 TERADYNE ENHANCES SUPPLY CHAIN EFFICIENCY WITH C.H. ROBINSON WORLDWIDE'S INTEGRATED LOGISTICS SOLUTIONS
- 5.11 IMPACT OF 2025 US TARIFF - AI IN SUPPLY CHAIN MARKET
- 5.11.1 INTRODUCTION
- 5.11.2 KEY TARIFF RATES
- 5.11.3 PRICE IMPACT ANALYSIS
- 5.11.4 IMPACT ON COUNTRIES/REGIONS
- 5.11.4.1 US
- 5.11.4.2 Europe
- 5.11.4.3 Asia Pacific
- 5.11.5 IMPACT ON END-USE INDUSTRIES
6 TECHNOLOGICAL ADVANCEMENTS, AI-DRIVEN IMPACT, PATENTS, INNOVATIONS, AND FUTURE APPLICATIONS
- 6.1 KEY EMERGING TECHNOLOGIES
- 6.1.1 MACHINE LEARNING
- 6.1.2 NATURAL LANGUAGE PROCESSING
- 6.1.3 COMPUTER VISION
- 6.2 COMPLEMENTARY TECHNOLOGIES
- 6.2.1 INTERNET OF THINGS (IOT) & IIOT SENSORS
- 6.2.2 CLOUD COMPUTING & EDGE COMPUTING
- 6.3 ADJACENT TECHNOLOGIES
- 6.3.1 ROBOTIC PROCESS AUTOMATION (RPA)
- 6.3.2 SMART FACTORIES
- 6.3.3 5G & NEXT-GENERATION CONNECTIVITY
- 6.4 TECHNOLOGY/PRODUCT ROADMAP
- 6.4.1 SHORT-TERM (2025-2027) | AI-AUGMENTED VISIBILITY & AUTOMATION SCALING
- 6.4.2 MID-TERM (2027-2030) | HETEROGENEOUS INTEGRATION & DESIGN ECOSYSTEM EXPANSION
- 6.4.3 LONG-TERM (2030-2035+) | UNIVERSAL RECONFIGURABLE COMPUTING & SYSTEM-LEVEL CONVERGENCE
- 6.5 PATENT ANALYSIS
7 REGULATORY LANDSCAPE
- 7.1 INTRODUCTION
- 7.1.1 REGULATORY BODIES, GOVERNMENT AGENCIES, AND OTHER ORGANIZATIONS
- 7.1.2 STANDARDS
- 7.1.3 GOVERNMENT REGULATIONS
8 CUSTOMER LANDSCAPE AND BUYER BEHAVIOR
- 8.1 DECISION-MAKING PROCESS
- 8.2 KEY STAKEHOLDERS INVOLVED IN BUYING PROCESS AND THEIR EVALUATION CRITERIA
- 8.2.1 KEY STAKEHOLDERS IN BUYING PROCESS
- 8.2.2 BUYING CRITERIA
- 8.3 ADOPTION BARRIERS AND INTERNAL CHALLENGES
- 8.4 UNMET NEEDS OF VARIOUS END-USE INDUSTRIES
9 AI IN SUPPLY CHAIN MARKET, BY OFFERING
- 9.1 INTRODUCTION
- 9.2 SOFTWARE
- 9.2.1 RISING SUPPLY CHAIN COMPLEXITY TO DRIVE ADOPTION OF AI IN SUPPLY CHAIN SOFTWARE
- 9.3 SERVICES
- 9.3.1 MANAGED SERVICES
- 9.3.1.1 Enterprise shift from AI pilots to scaled deployments to drive demand for managed services
- 9.3.2 PROFESSIONAL SERVICES
- 9.3.2.1 Critical role in business innovation to drive demand for professional services
- 9.3.1 MANAGED SERVICES
10 AI IN SUPPLY CHAIN MARKET, BY DEPLOYMENT
- 10.1 INTRODUCTION
- 10.2 CLOUD
- 10.2.1 DEMAND FOR SCALABLE AND CONTINUOUSLY UPDATED PLATFORMS TO DRIVE CLOUD AI ADOPTION IN SUPPLY CHAINS
- 10.3 ON-PREMISES
- 10.3.1 NEED FOR DATA SOVEREIGNTY AND REGULATORY COMPLIANCE TO DRIVE ON-PREMISES AI DEPLOYMENT
- 10.4 HYBRID
- 10.4.1 NEED FOR FLEXIBLE AI DEPLOYMENT ACROSS CLOUD AND ON-PREMISES TO DRIVE HYBRID ADOPTION
11 AI IN SUPPLY CHAIN MARKET, BY ORGANIZATION SIZE
- 11.1 INTRODUCTION
- 11.2 LARGE ORGANIZATIONS
- 11.2.1 GLOBAL SUPPLY CHAIN SCALE AND COMPLEXITY TO DRIVE AI ADOPTION AMONG LARGE ORGANIZATIONS
- 11.3 SMALL & MEDIUM ORGANIZATIONS
- 11.3.1 NEED FOR FASTER, DATA-DRIVEN DECISIONS TO DRIVE AI ADOPTION IN SUPPLY CHAINS FOR SMALL & MEDIUM ORGANIZATIONS
12 AI IN SUPPLY CHAIN MARKET, BY APPLICATION
- 12.1 INTRODUCTION
- 12.2 DEMAND PLANNING & FORECASTING
- 12.2.1 RISING DEMAND VOLATILITY TO DRIVE ADOPTION OF AI-POWERED SUPPLY CHAIN SOLUTIONS FOR FORECASTING
- 12.3 PROCUREMENT & SOURCING
- 12.3.1 GROWING NEED TO AUTOMATE PURCHASING DECISIONS AND OPTIMIZE SOURCING STRATEGIES TO DRIVE AI ADOPTION IN PROCUREMENT
- 12.4 INVENTORY MANAGEMENT
- 12.4.1 GROWING PRESSURE TO MINIMIZE MANUAL ERRORS AND OPERATIONAL COSTS TO BOOST AI-BASED INVENTORY MANAGEMENT ADOPTION
- 12.5 PRODUCTION PLANNING & SCHEDULING
- 12.5.1 RISING FOCUS ON THROUGHPUT OPTIMIZATION AND DOWNTIME REDUCTION TO DRIVE AI ADOPTION IN PRODUCTION SCHEDULING
- 12.6 WAREHOUSE & TRANSPORTATION MANAGEMENT
- 12.6.1 SHIFT TOWARD AUTOMATED WAREHOUSES AND INTELLIGENT LOGISTICS NETWORKS TO DRIVE DEMAND FOR AI IN SUPPLY CHAIN EXECUTION
- 12.7 SUPPLY CHAIN RISK MANAGEMENT
- 12.7.1 FOCUS OF ENTERPRISES ON RESILIENCE AND CONTINUITY TO DRIVE DEPLOYMENT OF AI-DRIVEN SUPPLY CHAIN RISK SOLUTIONS
- 12.8 OTHER APPLICATIONS
13 AI IN SUPPLY CHAIN MARKET, BY END-USE INDUSTRY
- 13.1 INTRODUCTION
- 13.2 RETAIL
- 13.2.1 EXPANSION OF AI ACROSS RETAIL PLANNING, INVENTORY OPTIMIZATION, AND LOGISTICS EXECUTION TO DRIVE MARKET
- 13.3 HEALTHCARE & PHARMACEUTICALS
- 13.3.1 NEED TO REDUCE SHORTAGES AND IMPROVE FORECAST ACCURACY TO DRIVE AI ADOPTION IN HEALTHCARE & PHARMACEUTICAL SUPPLY CHAIN
- 13.4 FOOD & BEVERAGES
- 13.4.1 NEED TO REDUCE WASTE AND IMPROVE INVENTORY TURNOVER TO DRIVE AI ADOPTION IN FOOD & BEVERAGES SUPPLY CHAIN
- 13.5 AUTOMOTIVE
- 13.5.1 SURGE IN DEMAND FOR ELECTRIC AND SOFTWARE-DEFINED VEHICLES TO DRIVE MARKET
- 13.6 LOGISTICS & TRANSPORTATION
- 13.6.1 NEED FOR REAL-TIME SHIPMENT VISIBILITY TO ACCELERATE AI ADOPTION IN LOGISTICS & TRANSPORTATION
- 13.7 AEROSPACE & DEFENSE
- 13.7.1 MISSION-CRITICAL PRODUCTION SCHEDULES TO ACCELERATE AI INTEGRATION IN AEROSPACE & DEFENSE SUPPLY CHAIN
- 13.8 CHEMICALS
- 13.8.1 NEED TO MANAGE COMPLEX, TIGHTLY COUPLED CHEMICAL PRODUCTION NETWORKS TO DRIVE AI ADOPTION IN SUPPLY CHAIN
- 13.9 ELECTRONICS & SEMICONDUCTOR
- 13.9.1 RAPID TECHNOLOGY TRANSITIONS AND MULTI-TIER SUPPLIER DEPENDENCE TO FUEL MARKET GROWTH
- 13.10 ENERGY & UTILITIES
- 13.10.1 RISING INFRASTRUCTURE COMPLEXITY TO DRIVE AI INTEGRATION IN ENERGY & UTILITIES SUPPLY CHAIN
- 13.11 MANUFACTURING
- 13.11.1 DEMAND FOR REAL-TIME PRODUCTION COORDINATION TO DRIVE AI-ENABLED SUPPLY CHAIN TRANSFORMATION IN MANUFACTURING
- 13.12 OTHER END-USE INDUSTRIES
14 AI IN SUPPLY CHAIN MARKET, BY REGION
- 14.1 INTRODUCTION
- 14.2 NORTH AMERICA
- 14.2.1 US
- 14.2.1.1 Integration of robotics and AI to transform supply chain productivity
- 14.2.2 CANADA
- 14.2.2.1 National AI strategy and ecosystem partnerships to propel intelligent supply chain transformation
- 14.2.3 MEXICO
- 14.2.3.1 Manufacturing expansion and cross-border trade to propel market growth
- 14.2.1 US
- 14.3 EUROPE
- 14.3.1 GERMANY
- 14.3.1.1 Automotive sector investments to strengthen AI-driven supply chain efficiency
- 14.3.2 UK
- 14.3.2.1 Government initiatives and policy support to drive AI adoption across supply chains
- 14.3.3 FRANCE
- 14.3.3.1 Life sciences and pharmaceutical expansion to boost AI deployment in supply chain ecosystem
- 14.3.4 ITALY
- 14.3.4.1 Government focus on accelerating industrial digital transformation across supply chains to drive market
- 14.3.5 REST OF EUROPE
- 14.3.1 GERMANY
- 14.4 ASIA PACIFIC
- 14.4.1 CHINA
- 14.4.1.1 AI-powered logistics and e-commerce ecosystems to propel supply chain efficiency and automation
- 14.4.2 JAPAN
- 14.4.2.1 AI-driven forecasting and automation to enhance resilience and efficiency in pharmaceutical supply chains
- 14.4.3 SOUTH KOREA
- 14.4.3.1 Digital twin and robotics integration to optimize electronics manufacturing supply chains
- 14.4.4 INDIA
- 14.4.4.1 Public-private partnerships to drive AI innovation and intelligent supply chain development
- 14.4.5 REST OF ASIA PACIFIC
- 14.4.1 CHINA
- 14.5 REST OF THE WORLD
- 14.5.1 MIDDLE EAST & AFRICA
- 14.5.1.1 Government AI strategies and smart logistics investments to drive supply chain modernization
- 14.5.1.2 GCC
- 14.5.1.3 Rest of Middle East & Africa
- 14.5.2 SOUTH AMERICA
- 14.5.2.1 Industrial automation and AI-driven manufacturing to enhance supply chain efficiency
- 14.5.1 MIDDLE EAST & AFRICA
15 COMPETITIVE LANDSCAPE
- 15.1 OVERVIEW
- 15.2 KEY PLAYER COMPETITIVE STRATEGIES/RIGHT TO WIN, 2021-2025
- 15.3 REVENUE ANALYSIS, 2021-2024
- 15.4 MARKET SHARE ANALYSIS, 2024
- 15.5 COMPANY VALUATION AND FINANCIAL METRICS
- 15.6 BRAND/PRODUCT COMPARISON
- 15.7 COMPANY EVALUATION MATRIX: KEY PLAYERS, 2024
- 15.7.1 STARS
- 15.7.2 EMERGING LEADERS
- 15.7.3 PERVASIVE PLAYERS
- 15.7.4 PARTICIPANTS
- 15.7.5 COMPANY FOOTPRINT: KEY PLAYERS, 2024
- 15.7.5.1 Company footprint
- 15.7.5.2 Regional footprint
- 15.7.5.3 Offering footprint
- 15.7.5.4 Deployment footprint
- 15.7.5.5 Organization size footprint
- 15.7.5.6 Application footprint
- 15.7.5.7 End-use industry footprint
- 15.8 COMPANY EVALUATION MATRIX: STARTUPS/SMES, 2024
- 15.8.1 PROGRESSIVE COMPANIES
- 15.8.2 RESPONSIVE COMPANIES
- 15.8.3 DYNAMIC COMPANIES
- 15.8.4 STARTING BLOCKS
- 15.8.5 COMPETITIVE BENCHMARKING: STARTUPS/SMES, 2024
- 15.8.5.1 Detailed list of key startups/SMEs
- 15.8.5.2 Competitive benchmarking of key startups/SMEs
- 15.9 COMPETITIVE SCENARIO
- 15.9.1 PRODUCT LAUNCHES/ENHANCEMENTS
- 15.9.2 DEALS
16 COMPANY PROFILES
- 16.1 KEY PLAYERS
- 16.1.1 SAP SE
- 16.1.1.1 Business overview
- 16.1.1.2 Products/Services/Solutions offered
- 16.1.1.3 Recent developments
- 16.1.1.3.1 Product launches/enhancements
- 16.1.1.3.2 Deals
- 16.1.1.4 MnM view
- 16.1.1.4.1 Key strengths
- 16.1.1.4.2 Strategic choices
- 16.1.1.4.3 Weaknesses & competitive threats
- 16.1.2 ORACLE
- 16.1.2.1 Business overview
- 16.1.2.2 Products/Services/Solutions offered
- 16.1.2.3 Recent developments
- 16.1.2.3.1 Product launches/enhancements
- 16.1.2.3.2 Deals
- 16.1.2.4 MnM view
- 16.1.2.4.1 Key strengths
- 16.1.2.4.2 Strategic choices
- 16.1.2.4.3 Weaknesses & competitive threats
- 16.1.3 BLUE YONDER GROUP, INC.
- 16.1.3.1 Business overview
- 16.1.3.2 Products/Services/Solutions offered
- 16.1.3.3 Recent developments
- 16.1.3.3.1 Product launches/enhancements
- 16.1.3.3.2 Deals
- 16.1.3.4 MnM view
- 16.1.3.4.1 Key strengths
- 16.1.3.4.2 Strategic choices
- 16.1.3.4.3 Weaknesses & competitive threats
- 16.1.4 MANHATTAN ASSOCIATES
- 16.1.4.1 Business overview
- 16.1.4.2 Products/Services/Solutions offered
- 16.1.4.3 Recent developments
- 16.1.4.3.1 Product launches/enhancements
- 16.1.4.3.2 Deals
- 16.1.4.4 MnM view
- 16.1.4.4.1 Key strengths
- 16.1.4.4.2 Strategic choices
- 16.1.4.4.3 Weaknesses & competitive threats
- 16.1.5 KINAXIS INC.
- 16.1.5.1 Business overview
- 16.1.5.2 Products/Services/Solutions offered
- 16.1.5.3 Recent developments
- 16.1.5.3.1 Product launches/enhancements
- 16.1.5.3.2 Deals
- 16.1.5.4 MnM view
- 16.1.5.4.1 Key strengths
- 16.1.5.4.2 Strategic choices
- 16.1.5.4.3 Weaknesses & competitive threats
- 16.1.6 IBM
- 16.1.6.1 Business overview
- 16.1.6.2 Products/Services/Solutions offered
- 16.1.6.3 Recent developments
- 16.1.6.3.1 Deals
- 16.1.7 MICROSOFT
- 16.1.7.1 Business overview
- 16.1.7.2 Products/Services/Solutions offered
- 16.1.7.3 Recent developments
- 16.1.7.3.1 Deals
- 16.1.8 AMAZON WEB SERVICES, INC.
- 16.1.8.1 Business overview
- 16.1.8.2 Products/Services/Solutions offered
- 16.1.8.3 Recent developments
- 16.1.8.3.1 Product launches/enhancements
- 16.1.8.3.2 Deals
- 16.1.9 ANAPLAN, INC.
- 16.1.9.1 Business overview
- 16.1.9.2 Products/Services/Solutions offered
- 16.1.9.3 Recent developments
- 16.1.9.3.1 Product launches/enhancements
- 16.1.9.3.2 Deals
- 16.1.10 LOGILITY SUPPLY CHAIN SOLUTIONS, INC.
- 16.1.10.1 Business overview
- 16.1.10.2 Products/Services/Solutions offered
- 16.1.10.3 Recent developments
- 16.1.10.3.1 Product launches/enhancements
- 16.1.10.3.2 Deals
- 16.1.1 SAP SE
- 16.2 OTHER PLAYERS
- 16.2.1 GEP
- 16.2.2 COUPA
- 16.2.3 O9 SOLUTIONS, INC.
- 16.2.4 ALIBABA CLOUD
- 16.2.5 ALTANA
- 16.2.6 PROJECT44
- 16.2.7 RESILINC CORPORATION
- 16.2.8 FOURKITES, INC.
- 16.2.9 FERO.AI
- 16.2.10 INFOR
- 16.2.11 CONVECT.AI, INC.
- 16.2.12 LVRG, INC.
- 16.2.13 EVERSTREAM ANALYTICS
- 16.2.14 RELEX SOLUTIONS
- 16.2.15 E2OPEN, LLC
17 RESEARCH METHODOLOGY
- 17.1 RESEARCH DATA
- 17.1.1 SECONDARY DATA
- 17.1.1.1 Major secondary sources
- 17.1.1.2 Key data from secondary sources
- 17.1.2 PRIMARY DATA
- 17.1.2.1 List of primary interview participants
- 17.1.2.2 Breakdown of primaries
- 17.1.2.3 Key data from primary sources
- 17.1.2.4 Key industry insights
- 17.1.3 SECONDARY AND PRIMARY RESEARCH
- 17.1.1 SECONDARY DATA
- 17.2 MARKET SIZE ESTIMATION
- 17.2.1 BOTTOM-UP APPROACH
- 17.2.1.1 Approach to estimate market size using bottom-up analysis (supply side)
- 17.2.2 TOP-DOWN APPROACH
- 17.2.2.1 Approach to estimate market size using top-down analysis (demand side)
- 17.2.1 BOTTOM-UP APPROACH
- 17.3 MARKET BREAKDOWN AND DATA TRIANGULATION
- 17.4 RESEARCH ASSUMPTIONS
- 17.5 RISK ASSESSMENT
- 17.6 RESEARCH LIMITATIONS
18 APPENDIX
- 18.1 DISCUSSION GUIDE
- 18.2 KNOWLEDGESTORE: MARKETSANDMARKETS' SUBSCRIPTION PORTAL
- 18.3 CUSTOMIZATION OPTIONS
- 18.4 RELATED REPORTS
- 18.5 AUTHOR DETAILS
