

|
시장보고서
상품코드
2079662
자동차용 센서 시장 : 센서 유형별, 판매 채널별, 차종별, 용도별, 지역별 - 세계 예측(-2032년)Automotive Sensors Market by Sales Channel (OEM, Aftermarket), Type (Temperature, Pressure, Oxygen, Position, Speed, Inertial, Image, Level, Chemical, Lidar, Current Sensors), Vehicle Type (Passenger Car, LCV, HCV), Application - Global Forecast to 2032 |
||||||

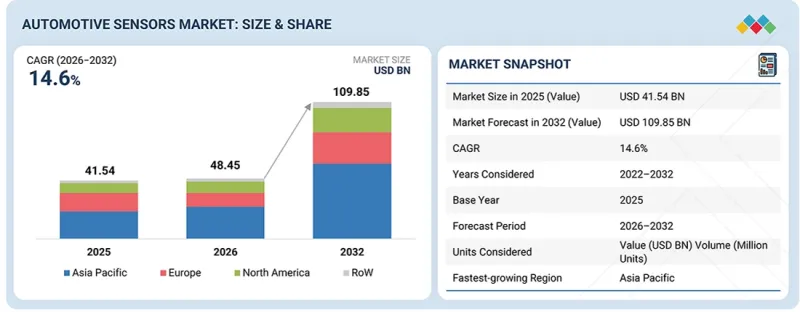
자동차용 센서 시장 규모는 2026년 484억 5,000만 달러에서 2032년까지 1,098억 5,000만 달러로 성장할 것으로 예상되며, CAGR은 14.6%에 달할 것으로 추정됩니다.
주요 성장 요인은 자율주행 및 커넥티드카 기술의 발전이며, 이에 따라 환경 인식, 내비게이션, V2X(Vehicle-to-Everything) 통신을 가능하게 하는 고성능 센싱 솔루션에 대한 수요가 발생하고 있습니다.
| 조사 범위 | |
|---|---|
| 조사 대상 기간 | 2021-2032년 |
| 기준 연도 | 2025년 |
| 예측 기간 | 2026-2032년 |
| 대상 단위 | 금액(10억 달러) |
| 부문 | 센서 유형별, 판매 채널별, 차종별, 용도별, 지역별 |
| 대상 지역 | 북미, 유럽, 아시아태평양, 기타 지역 |
또한, 차량의 안전성, 배기가스, 연비에 관한 엄격한 정부 규제로 인해 현대 차량 전반에 첨단 센서의 탑재가 지속적으로 촉진되고 있습니다.
2025년에는 파워트레인 시스템이 가장 큰 시장 점유율을 차지했습니다.
2025년에는 용도별 시장 점유율에서 파워트레인 시스템이 금액 기준으로 압도적인 점유율을 차지했습니다. 이는 센서를 활용한 파워트레인 시스템이 차량 성능, 연비 및 배기가스 제어 매개변수의 개선에 있어 매우 중요한 역할을 하고 있기 때문입니다. 이러한 시스템은 엔진 기능, 변속기, 연료 분사 및 배기 과정을 모니터링하고 제어하는 데 있어 센서에 크게 의존하고 있습니다. 배기가스 규제의 강화, 연비 향상 및 구동계 효율 향상에 대한 수요가 증가함에 따라, 파워트레인 분야 전반에 걸쳐 압력 센서, 온도 센서, 위치 센서, 산소 센서 등의 채택이 더욱 확대되고 있습니다.
예측 기간 동안 승용차가 가장 높은 연평균 성장률(CAGR)을 기록할 것으로 전망됩니다.
차종별로는 승용차가 예측 기간 동안 가장 빠르게 성장할 것으로 전망됩니다. 이러한 성장 추세는 주로 전 세계적으로 견조한 생산 대수와 ADAS, 차세대 인포테인먼트 플랫폼, 첨단 배기가스 제어 메커니즘 등 첨단 기술 시스템의 통합이 가속화되고 있는 데 기인합니다. 차량 성능의 향상, 뛰어난 안전 기준, 그리고 더욱 풍성한 운전 경험에 대한 소비자들의 기대감이 높아지면서, 이 부문의 시장 확대가 더욱 가속화되고 있습니다. 또한, 연비 향상과 차량 배기가스 감축을 의무화하는 엄격한 정부 규제로 인해 자동차 제조사들은 점점 더 복잡해지는 전자 아키텍처와 반도체를 많이 활용한 설계를 채택할 수밖에 없는 상황에 처해 있습니다. 승용차 분야의 전동화 동향, 커넥티비티의 발전, 그리고 자율주행 기능의 융합은 앞으로도 큰 수요를 뒷받침할 것으로 예상되며, 전 세계 자동차 산업 전반에서 승용차가 주도적인 성장 위치를 유지하도록 뒷받침할 것입니다.
예측 기간 동안 아시아태평양이 가장 높은 연평균 성장률(CAGR)을 보일 것으로 전망됩니다.
아시아태평양, 특히 중국에서 급속히 확대되고 있는 전기자동차 생태계가 배터리 관리, 온도 모니터링, 파워트레인 제어에 사용되는 센서의 수요를 견인하고 있습니다. 동시에, ADAS(첨단 운전자 보조 시스템) 및 커넥티드카 기술의 도입 확대에 따라 해당 지역 전체에서 차량 1대당 센서 장착 수가 증가하고 있습니다. 또한, 차량의 전기화, 교통 안전, 스마트 모빌리티 인프라를 촉진하기 위한 정부의 지원책 역시 센서 도입을 가속화하고 있습니다. 해당 지역의 생산 규모, 견고한 공급망 생태계, 반도체 기술력이 결합되어, 이러한 요인들로 인해 아시아태평양은 예측 기간 동안 자동차용 센서 시장에서 주도적인 위치를 유지할 것으로 전망됩니다.
2차 조사를 통해 수집된 각종 부문 및 하위 부문의 시장 규모를 확정하고 검증하기 위해 자동차용 센서 업계의 주요 전문가들을 대상으로 광범위한 1차 인터뷰가 실시되었습니다. 본 보고서의 1차 인터뷰 대상자 구성은 다음과 같습니다:
본 보고서에서는 자동차용 센서 시장의 주요 기업들을 각각의 순위 분석과 함께 소개하고 있습니다. 본 보고서에서 다루고 있는 주요 기업으로는 Robert Bosch GmbH(독일), DENSO Corporation(일본), Aptiv PLC(아일랜드), Valeo SA(프랑스), Sensata Technologies Holding plc(미국) 등이 포함됩니다.
이 밖에도 Niterra(NGK Spark Plug)(일본), AUMOVIO SE(독일), ZF Friedrichshafen AG(독일), Hyundai Mobis(한국) 등이 자동차용 센서 시장의 주요 기업으로 꼽힙니다.
조사 범위:
본 조사 보고서에서는 자동차용 센서 시장을 센서 종류, 차량 유형, 판매 채널, 용도 및 지역별로 분류하고 있습니다. 본 보고서에서는 자동차용 센서 시장과 관련된 주요 시장 촉진요인, 제약요인, 과제 및 기회에 대해 설명하고, 2032년까지의 시장 전망을 제시하고 있습니다. 이 외에도 본 보고서에는 자동차용 센서 생태계에 속한 모든 기업에 대한 리더십 매핑 및 분석이 포함되어 있습니다.
본 보고서를 구매할 때의 주요 이점
본 보고서는 자동차용 센서 시장 전체 및 각 하위 부문의 수치에 대한 가장 정확한 추정치를 제공함으로써, 이 시장의 선도 기업과 신규 진입 기업을 지원합니다. 또한, 이해관계자들이 경쟁 구도를 이해하고, 자사의 비즈니스를 더 나은 위치로 이끌며, 적절한 시장 진입 전략을 수립하기 위한 추가적인 인사이트를 얻는 데 도움이 됩니다. 또한, 본 보고서는 이해관계자들이 시장 동향을 파악하는 데 도움을 주며, 주요 시장 촉진요인, 억제요인, 과제 및 기회에 대한 정보를 제공합니다.
본 보고서에서는 다음 사항에 대한 인사이트를 제공합니다:
- 주요 촉진요인(안전 규제 및 자율주행 동향에 힘입어 멀티센서형 ADAS 아키텍처에 대한 수요가 크게 증가, 차량 및 탑승자의 안전성을 높이기 위한 최첨단 전자기기 및 소프트웨어의 보급) , 제약요인(신흥국 내 애프터마켓 서비스 전문 인력 부족, 자동차용 LiDAR 센서의 높은 비용), 기회(자율주행차 및 커넥티드카의 급속한 확대; 자동차 애프터마켓 서비스에 대한 수요 증가), 및 과제(자율주행차의 안전성·보안상 위협; 기능의 정확성을 확보하기 위한 관련 기술에 대한 의존)
- 제품 개발 및 혁신 : 자동차용 센서 시장의 향후 기술, 연구개발 활동, 거래 및 제품 출시에 대한 심층적인 인사이트
- 시장 개발 : 다양한 지역의 자동차용 센서 시장을 분석하여, 수익성이 높은 시장에 대한 종합적인 정보를 제공합니다.
- 시장의 다양화 : 자동차용 센서 시장의 신제품, 미개척 지역, 최근 동향 및 투자에 관한 종합적인 정보
- 경쟁사 분석 : Robert Bosch GmbH(독일), DENSO Corporation(일본), Aptiv PLC(아일랜드), Valeo SA(프랑스), Sensata Technologies Holding plc(미국) 등 주요 시장 참여 기업의 시장 점유율, 성장 전략 및 서비스 제공 내용에 대한 상세한 평가.
자주 묻는 질문
목차
제1장 소개
제2장 주요 요약
제3장 주요 인사이트
제4장 시장 개요
제5장 업계 동향
제6장 기술 진보, AI에 의한 영향, 특허, 그리고 혁신
제7장 규제 상황
제8장 고객 상황과 구매 행동
제9장 자동차용 센서 시장(센서 유형별)
제10장 자동차용 센서 시장(판매 채널별)
제11장 자동차용 센서 시장(차종별)
제12장 자동차용 센서 시장(용도별)
제13장 자동차용 센서 시장(지역별)
제14장 경쟁 구도
제15장 기업 개요
제16장 조사 방법
제17장 부록
KSM 26.07.10The automotive sensors market is estimated to grow from 48.45 billion in 2026 to USD 109.85 billion by 2032, at a CAGR of 14.6%. The major drivers are advancements in autonomous driving and connected vehicle technologies, creating the need for high-performance sensing solutions that enable environmental perception, navigation, and vehicle-to-everything (V2X) communication.
| Scope of the Report | |
|---|---|
| Years Considered for the Study | 2021-2032 |
| Base Year | 2025 |
| Forecast Period | 2026-2032 |
| Units Considered | Value (USD Billion) |
| Segments | By Sales Channel, Type, Application and Region |
| Regions covered | North America, Europe, APAC, RoW |
Additionally, stringent government regulations related to vehicle safety, emissions, and fuel efficiency continue to encourage the integration of advanced sensors across modern vehicles.
Powertrain systems held the largest market share in 2025
Powertrain systems accounted for a prominent market share by application in 2025, in terms of value, due to the critical role of sensor-powered powertrain systems in improving vehicle performance, fuel efficiency, and emission control parameters. These systems rely heavily on sensors for monitoring and controlling engine functions, transmission, fuel injection, and exhaust processes. Increasing demand for stricter emission compliance, improved fuel economy, and enhanced drivetrain efficiency has further driven the adoption of sensors such as pressure, temperature, position, and oxygen sensors across powertrain applications.
Passenger cars to record the highest CAGR during the forecast period
By vehicle type, passenger cars are expected to emerge as the fastest-growing segment throughout the forecast period. This growth trajectory is primarily attributed to robust global production volumes and the accelerating integration of advanced technological systems, including ADAS, next-generation infotainment platforms, and sophisticated emission control mechanisms. Rising consumer expectations for enhanced vehicle performance, superior safety standards, and elevated driving experiences are further propelling market expansion within this segment. Additionally, stringent government regulations mandating improved fuel efficiency and reduced vehicular emissions are compelling automotive OEMs to adopt increasingly complex electronic architectures and semiconductor-intensive designs. The convergence of electrification trends, connectivity advancements, and autonomous driving capabilities within the passenger car category is anticipated to sustain significant demand, reinforcing its dominant growth position across the global automotive landscape.
Asia Pacific to exhibit highest CAGR during forecast period
Asia Pacific's rapidly expanding electric vehicle ecosystem, particularly in China, is driving demand for sensors used in battery management, thermal monitoring, and powertrain control. At the same time, increasing adoption of ADAS and connected vehicle technologies is raising sensor content per vehicle across the region. Furthermore, supportive government initiatives promoting vehicle electrification, road safety, and smart mobility infrastructure are accelerating sensor adoption. Combined with the region's manufacturing scale, robust supply chain ecosystem, and semiconductor capabilities, these factors are expected to help Asia Pacific maintain its leadership in the automotive sensors market throughout the forecast period.
Extensive primary interviews were conducted with key experts in the automotive sensors industry to determine and verify the market size for various segments and subsegments gathered through secondary research. The breakdown of primary participants for the report is provided below:
The study contains insights from various industry experts, from component suppliers to Tier 1 companies and OEMs. The break-up of the primaries is as follows:
- By Company Type: Tier 1 - 20%, Tier 2 - 30%, and Tier 3 - 50%
- By Designation: C-level Executives - 40%, Directors - 30%, and Others - 30%
- By Region: North America - 45%, Europe - 22%, Asia Pacific - 22%, and RoW - 11%
The report profiles the key players in the automotive sensors market with their respective ranking analysis. Prominent players profiled in this report are Robert Bosch GmbH (Germany), DENSO Corporation (Japan), Aptiv PLC (Ireland), Valeo SA (France), and Sensata Technologies Holding plc (US), among others.
Apart from this, Niterra (NGK Spark Plug) (Japan), AUMOVIO SE (Germany), ZF Friedrichshafen AG (Germany), and Hyundai Mobis (South Korea) are among a few other players in the automotive sensors market.
Research Coverage:
This research report categorizes the automotive sensors market based on sensor type, vehicle type, sales channel, application, and region. The report describes the major drivers, restraints, challenges, and opportunities pertaining to the automotive sensors market and forecasts the same till 2032. Apart from these, the report also consists of leadership mapping and analysis of all the companies included in the automotive sensor ecosystem.
Key Benefits of Buying the Report
The report will help the market leaders/new entrants in this market with information on the closest approximations of the numbers for the overall automotive sensors market and the subsegments. This report will help stakeholders understand the competitive landscape and gain more insights to position their businesses better and plan suitable go-to-market strategies. The report also helps stakeholders understand the pulse of the market and provides them with information on key market drivers, restraints, challenges, and opportunities.
The report provides insights into the following pointers:
- Analysis of key drivers (significant demand for multi-sensor ADAS architectures fueled by safety mandates and autonomous driving trend; high adoption of cutting-edge electronics and software to enhance vehicle and passenger safety), restraints (shortage of aftermarket service professionals in emerging economies; high cost of lidar automotive sensors), opportunities (rapid expansion of autonomous and connected vehicles; rising demand for automotive aftermarket services), and challenges (safety and security threats in autonomous vehicles; reliance on associated technologies to ensure functional accuracy)
- Product Development/Innovation: Detailed insights on upcoming technologies, research & development activities, deals, and product launches in the automotive sensors market
- Market Development: Comprehensive information about lucrative markets by analyzing the automotive sensors market across varied regions
- Market Diversification: Exhaustive information about new products, untapped geographies, recent developments, and investments in the automotive sensors market
- Competitive Assessment: In-depth assessment of market shares, growth strategies, and service offerings of leading market players such as Robert Bosch GmbH (Germany), DENSO Corporation (Japan), Aptiv PLC (Ireland), Valeo SA (France), and Sensata Technologies Holding plc (US).
TABLE OF CONTENTS
1 INTRODUCTION
- 1.1 STUDY OBJECTIVES
- 1.2 MARKET DEFINITION
- 1.3 MARKET SCOPE
- 1.3.1 MARKET SEGMENTATION AND REGIONAL SCOPE
- 1.3.2 INCLUSIONS AND EXCLUSIONS
- 1.3.3 YEARS CONSIDERED
- 1.4 CURRENCY CONSIDERED
- 1.5 STAKEHOLDERS
- 1.6 SUMMARY OF CHANGES
2 EXECUTIVE SUMMARY
- 2.1 MARKET HIGHLIGHTS AND KEY INSIGHTS
- 2.2 KEY MARKET PARTICIPANTS: MAPPING OF STRATEGIC DEVELOPMENTS
- 2.3 DISRUPTIVE TRENDS IN AUTOMOTIVE SENSORS MARKET
- 2.4 HIGH-GROWTH SEGMENTS
- 2.5 REGIONAL SNAPSHOT: MARKET SIZE, GROWTH RATE, AND FORECAST
3 PREMIUM INSIGHTS
- 3.1 ATTRACTIVE OPPORTUNITIES FOR PLAYERS IN AUTOMOTIVE SENSORS MARKET
- 3.2 AUTOMOTIVE SENSORS MARKET, BY SENSOR TYPE
- 3.3 AUTOMOTIVE SENSORS MARKET, BY SALES CHANNEL
- 3.4 AUTOMOTIVE SENSORS MARKET, BY APPLICATION
- 3.5 AUTOMOTIVE SENSORS MARKET IN NORTH AMERICA, BY SENSOR TYPE AND COUNTRY
- 3.6 AUTOMOTIVE SENSORS MARKET, BY GEOGRAPHY
4 MARKET OVERVIEW
- 4.1 INTRODUCTION
- 4.2 MARKET DYNAMICS
- 4.2.1 DRIVERS
- 4.2.1.1 Significant demand for multi-sensor ADAS architectures fueled by safety mandates and autonomous driving trend
- 4.2.1.2 High adoption of cutting-edge electronics and software to enhance vehicle and passenger safety
- 4.2.1.3 Government incentives and grants to support R&D in automotive sensors and harmonize standards
- 4.2.1.4 Rapid advancements in automotive sensors to meet customer requirements
- 4.2.2 RESTRAINTS
- 4.2.2.1 Shortage of aftermarket service professionals in emerging economies
- 4.2.2.2 High cost of lidar automotive sensors
- 4.2.3 OPPORTUNITIES
- 4.2.3.1 Increasing investments by automobile manufacturers in lidar technology
- 4.2.3.2 Growing adoption of EVs and HEVs to reduce CO2 emissions
- 4.2.3.3 Rapid expansion of autonomous and connected vehicles
- 4.2.3.4 Rising demand for automotive aftermarket services
- 4.2.4 CHALLENGES
- 4.2.4.1 Safety and security threats in autonomous vehicles
- 4.2.4.2 Elevated sensor design and development costs due to stringent performance requirements
- 4.2.4.3 Reliance on associated technologies to ensure functional accuracy
- 4.2.1 DRIVERS
- 4.3 INTERCONNECTED MARKETS AND CROSS-SECTOR OPPORTUNITIES
- 4.4 STRATEGIC MOVES BY TIER 1/2/3 PLAYERS
5 INDUSTRY TRENDS
- 5.1 PORTER'S FIVE FORCES ANALYSIS
- 5.1.1 THREAT OF NEW ENTRANTS
- 5.1.2 THREAT OF SUBSTITUTES
- 5.1.3 BARGAINING POWER OF SUPPLIERS
- 5.1.4 BARGAINING POWER OF BUYERS
- 5.1.5 INTENSITY OF COMPETITIVE RIVALRY
- 5.2 MACROECONOMIC OUTLOOK
- 5.2.1 INTRODUCTION
- 5.2.2 GDP TRENDS AND FORECAST
- 5.2.3 TRENDS IN GLOBAL AUTOMOTIVE SENSOR INDUSTRY
- 5.2.3.1 Rapid integration of advanced sensors in ADAS and autonomous vehicles
- 5.2.3.2 Growing adoption of smart and AI-enabled sensors by automakers
- 5.2.3.3 Rising use of sensors in EVs
- 5.3 VALUE CHAIN ANALYSIS
- 5.4 ECOSYSTEM ANALYSIS
- 5.5 PRICING ANALYSIS
- 5.5.1 PRICING RANGE OF AUTOMOTIVE SENSORS, BY SENSOR TYPE, 2025
- 5.5.2 PRICING RANGE OF AUTOMOTIVE SENSOR TYPES, BY KEY PLAYER, 2025
- 5.5.3 AVERAGE SELLING PRICE TREND OF AUTOMOTIVE SENSORS, BY SENSOR TYPE, 2021-2025
- 5.5.4 AVERAGE SELLING PRICE TREND OF AUTOMOTIVE SENSORS, BY REGION, 2021-2025
- 5.6 TRADE ANALYSIS
- 5.6.1 IMPORT SCENARIO (HS CODE 903290)
- 5.6.2 EXPORT SCENARIO (HS CODE 903290)
- 5.7 KEY CONFERENCES AND EVENTS, 2026-2027
- 5.8 TRENDS/DISRUPTIONS IMPACTING CUSTOMER BUSINESS
- 5.9 INVESTMENT AND FUNDING SCENARIO
- 5.10 CASE STUDY ANALYSIS
- 5.10.1 DEVELOPMENT OF AUTOMOTIVE SENSOR INTERFACE CHIP FOR ELECTRIC VEHICLES
- 5.10.2 INTEGRATION OF SENSORS IN PRINTED CIRCUIT BOARDS TO WITHSTAND EXTREME TEMPERATURES AND SENSE ROAD CONDITIONS
- 5.10.3 INTRODUCTION OF PRESSURE SENSOR FOR HIGH-PERFORMANCE APPLICATIONS
- 5.10.4 IMPLEMENTATION OF RAIN SENSORS TO ADJUST WIPER SPEED BASED ON RAINFALL INTENSITY
- 5.10.5 ADOPTION OF IMAGE SENSORS TO ENHANCE STORAGE EFFICIENCY AND PRODUCT TRACEABILITY
- 5.11 IMPACT OF US TARIFF - OVERVIEW
- 5.11.1 INTRODUCTION
- 5.11.2 PRICE IMPACT ANALYSIS
- 5.11.3 IMPACT ON COUNTRIES/REGIONS
- 5.11.3.1 US
- 5.11.4 EUROPE
- 5.11.5 ASIA PACIFIC
- 5.11.6 IMPACT ON AUTOMOTIVE INDUSTRY, BY VEHICLE TYPE
6 TECHNOLOGICAL ADVANCEMENTS, AI-DRIVEN IMPACT, PATENTS, AND INNOVATIONS
- 6.1 KEY/EMERGING TECHNOLOGIES
- 6.1.1 AI-ENABLED SMART SENSORS
- 6.1.2 MEMS-BASED SENSORS
- 6.1.3 SOLID-STATE LIDAR SYSTEMS
- 6.1.4 4D IMAGING RADAR
- 6.2 COMPLEMENTARY TECHNOLOGIES
- 6.2.1 SENSOR FUSION TECHNOLOGY
- 6.2.2 VEHICLE-TO-EVERYTHING (V2X) COMMUNICATION
- 6.2.3 EDGE COMPUTING PLATFORMS
- 6.3 ADJACENT TECHNOLOGIES
- 6.3.1 AUTOMOTIVE SEMICONDUCTOR TECHNOLOGY
- 6.3.2 BATTERY MANAGEMENT SYSTEMS
- 6.3.3 AUTOMOTIVE CYBERSECURITY TECHNOLOGY
- 6.4 TECHNOLOGY ROADMAP
- 6.5 PATENT ANALYSIS
- 6.6 IMPACT OF AI ON AUTOMOTIVE SENSORS MARKET
- 6.6.1 TOP USE CASES AND MARKET POTENTIALS
- 6.6.1.1 Tesla: AI-driven battery and vehicle sensing intelligence
- 6.6.1.2 NVIDIA: AI-enabled autonomous perception systems
- 6.6.1.3 Robert Bosch GmbH: AI-based predictive sensing and ADAS optimization
- 6.6.2 BEST PRACTICES FOLLOWED BY MANUFACTURERS IN AUTOMOTIVE SENSORS MARKET
- 6.6.3 CASE STUDIES RELATED TO AI IMPLEMENTATION IN AUTOMOTIVE SENSORS MARKET
- 6.6.4 INTERCONNECTED/ADJACENT ECOSYSTEM AND IMPACT ON MARKET PLAYERS
- 6.6.5 CLIENTS' READINESS TO ADOPT AI IN AUTOMOTIVE SENSORS MARKET
- 6.6.1 TOP USE CASES AND MARKET POTENTIALS
- 6.7 SUCCESS STORIES AND REAL-WORLD APPLICATIONS
7 REGULATORY LANDSCAPE
- 7.1 REGIONAL REGULATIONS AND COMPLIANCE
- 7.1.1 REGULATORY BODIES, GOVERNMENT AGENCIES, AND OTHER ORGANIZATIONS
- 7.1.2 INDUSTRY STANDARDS AND CERTIFICATIONS
- 7.1.3 REGULATIONS
8 CUSTOMER LANDSCAPE AND BUYER BEHAVIOR
- 8.1 DECISION-MAKING PROCESS
- 8.2 KEY STAKEHOLDERS INVOLVED IN BUYING PROCESS AND THEIR EVALUATION CRITERIA
- 8.2.1 KEY STAKEHOLDERS IN BUYING PROCESS
- 8.2.2 BUYING CRITERIA
- 8.3 ADOPTION BARRIERS AND INTERNAL CHALLENGES
- 8.4 UNMET NEEDS OF VARIOUS END-USE INDUSTRIES
- 8.5 MARKET PROFITABILITY
- 8.5.1 REVENUE POTENTIAL
- 8.5.2 COST DYNAMICS
- 8.5.3 MARGIN OPPORTUNITIES, BY SALES CHANNEL
9 AUTOMOTIVE SENSORS MARKET, BY SENSOR TYPE
- 9.1 INTRODUCTION
- 9.2 TEMPERATURE SENSORS
- 9.2.1 INCREASING USE OF TEMPERATURE SENSORS IN ENGINE MANAGEMENT AND HVAC SYSTEMS TO DRIVE MARKET
- 9.3 PRESSURE SENSORS
- 9.3.1 RISING FOCUS ON IMPROVING FUEL EFFICIENCY AND REDUCING VEHICLE EMISSIONS TO ACCELERATE SEGMENTAL GROWTH
- 9.4 OXYGEN SENSORS
- 9.4.1 STRINGENT GOVERNMENT MANDATES RELATED TO VEHICLE EMISSION MONITORING TO FUEL SEGMENTAL GROWTH
- 9.5 NOX SENSORS
- 9.5.1 INCREASING PRODUCTION OF COMMERCIAL AND HYBRID VEHICLES TO SUPPORT SEGMENTAL GROWTH
- 9.6 POSITION SENSORS
- 9.6.1 ELEVATING DEMAND FOR REAL-TIME VEHICLE CONTROL TO BOOST ADOPTION OF POSITION SENSORS
- 9.7 SPEED SENSORS
- 9.7.1 GROWING EMPHASIS OF AUTOMAKERS ON ENHANCING VEHICLE STABILITY AND SAFETY TO SPIKE DEMAND FOR SPEED SENSORS
- 9.8 INERTIAL SENSORS
- 9.8.1 ESCALATING ADOPTION OF CONNECTED, AUTONOMOUS, AND ELECTRIC VEHICLES TO CREATE GROWTH OPPORTUNITIES
- 9.8.1.1 Accelerometers
- 9.8.1.2 Gyroscopes
- 9.8.1.3 Inertial measurement units
- 9.8.1 ESCALATING ADOPTION OF CONNECTED, AUTONOMOUS, AND ELECTRIC VEHICLES TO CREATE GROWTH OPPORTUNITIES
- 9.9 IMAGE SENSORS
- 9.9.1 RISING INCLINATION TOWARD IMPROVING PASSENGER SAFETY AND DRIVING CONVENIENCE TO ELEVATE IMAGE SENSOR DEMAND
- 9.9.1.1 Complementary metal-oxide-semiconductor (CMOS)
- 9.9.1.2 Charge-coupled device (CCD)
- 9.9.1 RISING INCLINATION TOWARD IMPROVING PASSENGER SAFETY AND DRIVING CONVENIENCE TO ELEVATE IMAGE SENSOR DEMAND
- 9.10 LEVEL SENSORS
- 9.10.1 PRESSING NEED TO MONITOR ENGINE EFFICIENCY AND ENSURE VEHICLE MAINTENANCE TO AUGMENT DEPLOYMENT
- 9.11 CHEMICAL SENSORS
- 9.11.1 ABILITY TO MONITOR CONCENTRATION OF GASES AND VOLATILE COMPOUNDS IN VEHICLE SYSTEMS TO DRIVE DEMAND
- 9.12 RADAR SENSORS
- 9.12.1 POTENTIAL TO BOOST VEHICLE INTELLIGENCE AND STRENGTHEN VEHICLE SAFETY TO SPUR DEMAND
- 9.13 ULTRASONIC SENSORS
- 9.13.1 GROWING USE OF ULTRASONIC SENSORS IN PARKING ASSISTANCE AND PROXIMITY SENSING APPLICATIONS TO DRIVE MARKET
- 9.14 LIDAR SENSORS
- 9.14.1 BETTER COMPETENCY IN DETECTING AND RECOGNIZING OBSTACLES TO ENSURE SMOOTH AND SAFE RIDE TO EXPEDITE DEMAND
- 9.15 CURRENT SENSORS
- 9.15.1 INCREASING DEMAND FOR BATTERY-OPERATED VEHICLES TO ACCELERATE CURRENT SENSOR DEPLOYMENT
- 9.16 OTHER SENSORS
- 9.16.1 RAIN SENSORS
- 9.16.2 RELATIVE HUMIDITY SENSORS
- 9.16.3 PROXIMITY SENSORS
- 9.16.4 PARTICULATE MATTER SENSORS
10 AUTOMOTIVE SENSORS MARKET, BY SALES CHANNEL
- 10.1 INTRODUCTION
- 10.2 ORIGINAL EQUIPMENT MANUFACTURERS
- 10.2.1 STRINGENT VEHICLE SAFETY AND EMISSION REGULATIONS TO PROMOTE ADOPTION OF ADVANCED AUTOMOTIVE SENSORS BY OEMS
- 10.3 AFTERMARKET
- 10.3.1 GROWING USE OF AUTOMOTIVE SENSORS IN VEHICLE MAINTENANCE, CUSTOMIZATION, AND REPAIR ACTIVITIES TO DRIVE AFTERMARKET SEGMENT
11 AUTOMOTIVE SENSORS MARKET, BY VEHICLE TYPE
- 11.1 INTRODUCTION
- 11.2 PASSENGER CARS
- 11.2.1 RAPID URBANIZATION AND HIGH DISPOSABLE INCOME TO PROMOTE SEGMENTAL GROWTH
- 11.3 LIGHT COMMERCIAL VEHICLES
- 11.3.1 GROWING USE IN LAST-MILE DELIVERY AND E-COMMERCE LOGISTICS TO FUEL MARKET GROWTH
- 11.4 HEAVY COMMERCIAL VEHICLES
- 11.4.1 RISING LOGISTICS AND FREIGHT DEMAND TO PROMOTE SENSOR INTEGRATION IN HEAVY COMMERCIAL VEHICLES
12 AUTOMOTIVE SENSORS MARKET, BY APPLICATION
- 12.1 INTRODUCTION
- 12.2 POWERTRAIN SYSTEMS
- 12.2.1 RAPID ELECTRIFICATION OF POWERTRAINS ACROSS HYBRID, HYDROGEN, AND ALTERNATIVE FUEL VEHICLES TO DRIVE SENSOR ADOPTION
- 12.3 CHASSIS
- 12.3.1 STRICTER SAFETY MANDATES AND HEIGHTENED CONSUMER EXPECTATIONS TO PROPEL CHASSIS SENSOR ADOPTION
- 12.4 EXHAUST SYSTEMS
- 12.4.1 STRINGENT EMISSION NORMS TO SPIKE DEMAND FOR SENSOR-POWERED EXHAUST SYSTEMS
- 12.5 SAFETY & CONTROL SYSTEMS
- 12.5.1 GROWING EMPHASIS ON ROAD SAFETY AND ACCIDENT PREVENTION TO SUPPORT MARKET GROWTH
- 12.6 VEHICLE BODY ELECTRONICS
- 12.6.1 INTENSE COMPETITION AMONG AUTOMAKERS TO DEVELOP ADVANCED COMFORT FEATURES TO FUEL SENSOR INNOVATION IN BODY ELECTRONICS
- 12.7 TELEMATICS SYSTEMS
- 12.7.1 RISING CONNECTIVITY AND FLEET MANAGEMENT NEEDS TO CONTRIBUTE TO MARKET GROWTH
- 12.8 DRIVER-ASSISTANCE & AUTOMATION SYSTEMS
- 12.8.1 GROWING ADOPTION OF ADAS AND AUTONOMOUS DRIVING TECHNOLOGIES TO FUEL MARKET GROWTH
- 12.9 OTHER APPLICATIONS
13 AUTOMOTIVE SENSORS MARKET, BY REGION
- 13.1 INTRODUCTION
- 13.2 NORTH AMERICA
- 13.2.1 MACROECONOMIC OUTLOOK FOR NORTH AMERICA
- 13.2.2 US
- 13.2.2.1 Rapid adoption of electric vehicles and hybrid vehicles to accelerate market growth
- 13.2.3 CANADA
- 13.2.3.1 Strong focus on electric mobility and zero-emission transportation to foster market growth
- 13.2.4 MEXICO
- 13.2.4.1 Increasing production facilities of automakers and sensor manufacturers to support market growth
- 13.3 EUROPE
- 13.3.1 MACROECONOMIC OUTLOOK FOR EUROPE
- 13.3.2 GERMANY
- 13.3.2.1 Presence of strong advanced automotive R&D ecosystem to drive consistent demand
- 13.3.3 UK
- 13.3.3.1 High demand for luxury, premium, and connected vehicles to facilitate market expansion
- 13.3.4 FRANCE
- 13.3.4.1 Government subsidies and strategic investments in EV infrastructure to contribute to market growth
- 13.3.5 ITALY
- 13.3.5.1 University-led intelligent mobility and sensor innovation research to propel market
- 13.3.6 REST OF EUROPE
- 13.4 ASIA PACIFIC
- 13.4.1 MACROECONOMIC OUTLOOK FOR ASIA PACIFIC
- 13.4.2 CHINA
- 13.4.2.1 Substantial investments in autonomous mobility and lidar sensor innovations for ADAS and robotaxi applications to drive market
- 13.4.3 JAPAN
- 13.4.3.1 Autonomous mobility and smart transportation initiatives to stimulate market growth
- 13.4.4 SOUTH KOREA
- 13.4.4.1 Strong focus on smart mobility and connected transportation to increase automotive sensor uptake
- 13.4.5 INDIA
- 13.4.5.1 Government initiatives and rising FDI in automotive sector to create growth opportunities
- 13.4.6 REST OF ASIA PACIFIC
- 13.5 ROW
- 13.5.1 MACROECONOMIC OUTLOOK FOR ROW
- 13.5.2 MIDDLE EAST
- 13.5.2.1 Government regulations related to road safety, vehicle efficiency, and sustainable transport to support market growth
- 13.5.3 AFRICA
- 13.5.3.1 Rising demand for safe and fuel-efficient vehicles to drive market
- 13.5.4 SOUTH AMERICA
- 13.5.4.1 Flexible export-import policies to support market growth
14 COMPETITIVE LANDSCAPE
- 14.1 OVERVIEW
- 14.2 KEY PLAYER COMPETITIVE STRATEGIES/RIGHT TO WIN, 2023-2026
- 14.3 REVENUE ANALYSIS
- 14.4 MARKET SHARE ANALYSIS, 2025
- 14.5 BRAND/PRODUCT COMPARISON
- 14.5.1 ROBERT BOSCH GMBH (GERMANY)
- 14.5.2 DENSO CORPORATION (JAPAN)
- 14.5.3 AUMOVIO SE (GERMANY)
- 14.5.4 VALEO SA (FRANCE)
- 14.5.5 SENSATA TECHNOLOGIES (US)
- 14.6 COMPANY EVALUATION MATRIX: KEY PLAYERS, 2025
- 14.6.1 STARS
- 14.6.2 EMERGING LEADERS
- 14.6.3 PERVASIVE PLAYERS
- 14.6.4 PARTICIPANTS
- 14.6.5 COMPANY FOOTPRINT: KEY PLAYERS, 2025
- 14.6.5.1 Company footprint
- 14.6.5.2 Region footprint
- 14.6.5.3 Vehicle type footprint
- 14.6.5.4 Sales channel footprint
- 14.6.5.5 Application footprint
- 14.7 COMPANY EVALUATION MATRIX: STARTUPS/SMES, 2025
- 14.7.1 PROGRESSIVE COMPANIES
- 14.7.2 RESPONSIVE COMPANIES
- 14.7.3 DYNAMIC COMPANIES
- 14.7.4 STARTING BLOCKS
- 14.7.5 COMPETITIVE BENCHMARKING: STARTUPS/SMES, 2025
- 14.7.5.1 Detailed list of key startups/SMEs
- 14.7.5.2 Competitive benchmarking of startups/SMEs
- 14.8 COMPANY VALUATION & FINANCIAL METRICS
- 14.9 COMPETITIVE SCENARIO
- 14.9.1 PRODUCT LAUNCHES
- 14.9.2 DEALS
15 COMPANY PROFILES
- 15.1 KEY PLAYERS
- 15.1.1 ROBERT BOSCH GMBH
- 15.1.1.1 Business overview
- 15.1.1.2 Products offered
- 15.1.1.3 Recent developments
- 15.1.1.4 Strategic intelligence
- 15.1.1.4.1 Market position
- 15.1.1.4.2 Financial strategy
- 15.1.1.4.3 Operational strategy
- 15.1.1.4.4 Market expansion strategy
- 15.1.1.4.5 Strategic DNA
- 15.1.1.4.6 Right to win
- 15.1.1.4.7 Product USP
- 15.1.1.4.8 Win-loss analysis
- 15.1.1.4.9 Recent strategic moves (2023-2026)
- 15.1.1.4.10 Potential moves (2026-2028)
- 15.1.1.4.11 Risks, constraints, and blindspots
- 15.1.1.4.12 Revenue tardown
- 15.1.1.5 SWOT analysis
- 15.1.1.6 MNM view
- 15.1.1.6.1 Key strengths
- 15.1.1.6.2 Strategic choices
- 15.1.1.6.3 Weaknesses & competitive threats
- 15.1.2 DENSO CORPORATION
- 15.1.2.1 Business overview
- 15.1.2.2 Products offered
- 15.1.2.3 Recent developments
- 15.1.2.4 Strategic intelligence
- 15.1.2.4.1 Market position
- 15.1.2.4.2 Financial strategy
- 15.1.2.4.3 Operational strategy
- 15.1.2.4.4 Market expansion strategy
- 15.1.2.4.5 Strategic DNA
- 15.1.2.4.6 Right to win
- 15.1.2.4.7 Product USP
- 15.1.2.4.8 Win-loss analysis
- 15.1.2.4.9 Recent strategic moves (2023-2026)
- 15.1.2.4.10 Potential moves (2026-2028)
- 15.1.2.4.11 Risks, constraints, and blindspots
- 15.1.2.4.12 Revenue teardown
- 15.1.2.5 SWOT analysis
- 15.1.2.6 MNM view
- 15.1.2.6.1 Key strengths
- 15.1.2.6.2 Strategic choices
- 15.1.2.6.3 Weaknesses & competitive threats
- 15.1.3 AUMOVIO SE
- 15.1.3.1 Business overview
- 15.1.3.2 Products offered
- 15.1.3.3 Recent developments
- 15.1.3.4 Strategic intelligence
- 15.1.3.4.1 Market position
- 15.1.3.4.2 Financial strategy
- 15.1.3.4.3 Operational strategy
- 15.1.3.4.4 Market expansion strategy
- 15.1.3.4.5 Strategic DNA
- 15.1.3.4.6 Right to win
- 15.1.3.4.7 Product USP
- 15.1.3.4.8 Win-loss analysis
- 15.1.3.4.9 Recent strategic moves (2023-2026)
- 15.1.3.4.10 Potential moves (2026-2028)
- 15.1.3.4.11 Risks, constraints, & blindspots
- 15.1.3.4.12 Revenue teardown
- 15.1.3.5 SWOT analysis
- 15.1.3.6 MNM view
- 15.1.3.6.1 Key strengths
- 15.1.3.6.2 Strategic choices
- 15.1.3.6.3 Weaknesses & competitive threats
- 15.1.4 VALEO SA
- 15.1.4.1 Business overview
- 15.1.4.2 Products offered
- 15.1.4.3 Recent developments
- 15.1.4.4 Strategic intelligence
- 15.1.4.4.1 Market position
- 15.1.4.4.2 Financial strategy
- 15.1.4.4.3 Operational strategy
- 15.1.4.4.4 Market expansion strategy
- 15.1.4.4.5 Strategic DNA
- 15.1.4.4.6 Right to win
- 15.1.4.4.7 Product USP
- 15.1.4.4.8 Win-loss analysis
- 15.1.4.4.9 Recent strategic moves (2023-2026)
- 15.1.4.4.10 Potential moves (2026-2028)
- 15.1.4.4.11 Risks, constraints, & blindspots
- 15.1.4.4.12 Revenue teardown
- 15.1.4.5 SWOT analysis
- 15.1.4.6 MNM view
- 15.1.4.6.1 Key strengths
- 15.1.4.6.2 Strategic choices
- 15.1.4.6.3 Weaknesses & competitive threats
- 15.1.5 SENSATA TECHNOLOGIES, INC.
- 15.1.5.1 Business overview
- 15.1.5.2 Products offered
- 15.1.5.3 Recent developments
- 15.1.5.4 Strategic intelligence
- 15.1.5.4.1 Market position
- 15.1.5.4.2 Financial strategy
- 15.1.5.4.3 Operational strategy
- 15.1.5.4.4 Market expansion strategy
- 15.1.5.4.5 Strategic DNA
- 15.1.5.4.6 Right to win
- 15.1.5.4.7 Product USP
- 15.1.5.4.8 Win-loss analysis
- 15.1.5.4.9 Recent strategic moves (2023-2026)
- 15.1.5.4.10 Potential moves (2026-2028)
- 15.1.5.4.11 Risks, constraints, & blindspots
- 15.1.5.4.12 Revenue teardown
- 15.1.5.5 SWOT analysis
- 15.1.5.6 MNM view
- 15.1.5.6.1 Key strengths
- 15.1.5.6.2 Strategic choices
- 15.1.5.6.3 Weaknesses & competitive threats
- 15.1.6 NITERRA CO., LTD.
- 15.1.6.1 Business overview
- 15.1.6.2 Products offered
- 15.1.6.3 Recent developments
- 15.1.6.4 Strategic intelligence
- 15.1.6.4.1 Market position
- 15.1.6.4.2 Financial strategy
- 15.1.6.4.3 Operational strategy
- 15.1.6.4.4 Market expansion strategy
- 15.1.6.4.5 Strategic DNA
- 15.1.6.4.6 Right to win
- 15.1.6.4.7 Product USP
- 15.1.6.4.8 Win-loss analysis
- 15.1.6.4.9 Recent strategic moves (2023-2026)
- 15.1.6.4.10 Potential moves (2026-2028)
- 15.1.6.4.11 Risks, constraints, & blindspots
- 15.1.6.4.12 Revenue teardown
- 15.1.6.5 SWOT analysis
- 15.1.6.6 MNM view
- 15.1.6.6.1 Key strengths
- 15.1.6.6.2 Strategic choices
- 15.1.6.6.3 Weaknesses & competitive threats
- 15.1.7 APTIV PLC
- 15.1.7.1 Business overview
- 15.1.7.2 Products offered
- 15.1.7.3 Recent developments
- 15.1.7.4 Strategic intelligence
- 15.1.7.4.1 Market position
- 15.1.7.4.2 Financial strategy
- 15.1.7.4.3 Operational strategy
- 15.1.7.4.4 Market expansion strategy
- 15.1.7.4.5 Strategic DNA
- 15.1.7.4.6 Right to win
- 15.1.7.4.7 Product USP
- 15.1.7.4.8 Win-loss analysis
- 15.1.7.4.9 Recent strategic moves (2023-2026)
- 15.1.7.4.10 Potential moves (2026-2028)
- 15.1.7.4.11 Risks, constraints, & blindspots
- 15.1.7.4.12 Revenue teardown
- 15.1.7.5 SWOT analysis
- 15.1.7.6 MNM view
- 15.1.7.6.1 Key strengths
- 15.1.7.6.2 Strategic choices
- 15.1.7.6.3 Weaknesses & competitive threats
- 15.1.8 ZF FRIEDRICHSHAFEN AG
- 15.1.8.1 Business overview
- 15.1.8.2 Products offered
- 15.1.8.3 Recent developments
- 15.1.8.4 Strategic intelligence
- 15.1.8.4.1 Market position
- 15.1.8.4.2 Financial strategy
- 15.1.8.4.3 Operational strategy
- 15.1.8.4.4 Market expansion strategy
- 15.1.8.4.5 Strategic DNA
- 15.1.8.4.6 Right to win
- 15.1.8.4.7 Product USP
- 15.1.8.4.8 Win-loss analysis
- 15.1.8.4.9 Recent strategic moves (2023-2026)
- 15.1.8.4.10 Potential moves (2026-2028)
- 15.1.8.4.11 Risks, constraints, & blindspots
- 15.1.8.4.12 Revenue teardown
- 15.1.8.5 SWOT analysis
- 15.1.8.6 MNM view
- 15.1.8.6.1 Key strengths
- 15.1.8.6.2 Strategic choices
- 15.1.8.6.3 Weaknesses & competitive threats
- 15.1.9 HELLA GMBH & CO. KGAA (FORVIA)
- 15.1.9.1 Business overview
- 15.1.9.2 Products offered
- 15.1.9.3 Recent developments
- 15.1.9.4 Strategic intelligence
- 15.1.9.4.1 Market position
- 15.1.9.4.2 Financial strategy
- 15.1.9.4.3 Operational strategy
- 15.1.9.4.4 Market expansion strategy
- 15.1.9.4.5 Strategy DNA
- 15.1.9.4.6 Right to win
- 15.1.9.4.7 Product USP
- 15.1.9.4.8 Win-loss analysis
- 15.1.9.4.9 Recent strategic moves (2023-2026)
- 15.1.9.4.10 Potential moves (2026-2028)
- 15.1.9.4.11 Risks, constraints, & blindspots
- 15.1.9.4.12 Revenue teardown
- 15.1.9.5 SWOT analysis
- 15.1.9.6 MNM view
- 15.1.9.6.1 Key strengths
- 15.1.9.6.2 Strategic choices
- 15.1.9.6.3 Weaknesses & competitive threats
- 15.1.10 HYUNDAI MOBIS CO., LTD.
- 15.1.10.1 Business overview
- 15.1.10.2 Products offered
- 15.1.10.3 Recent developments
- 15.1.10.4 Strategic intelligence
- 15.1.10.4.1 Market position
- 15.1.10.4.2 Financial strategy
- 15.1.10.4.3 Operational strategy
- 15.1.10.4.4 Market expansion strategy
- 15.1.10.4.5 Strategic DNA
- 15.1.10.4.6 Right to win
- 15.1.10.4.7 Product USP
- 15.1.10.4.8 Win-loss analysis
- 15.1.10.4.9 Recent strategic moves (2023-2026)
- 15.1.10.4.10 Potential moves (2026-2028)
- 15.1.10.4.11 Risks, constraints, & blindspots
- 15.1.10.4.12 Revenue teardown
- 15.1.10.5 SWOT analysis
- 15.1.10.6 MNM view
- 15.1.10.6.1 Key strengths
- 15.1.10.6.2 Strategic choices
- 15.1.10.6.3 Weaknesses & competitive threats
- 15.1.11 HITACHI ASTEMO
- 15.1.11.1 Business overview
- 15.1.11.2 Products offered
- 15.1.11.3 Recent developments
- 15.1.11.4 Strategic intelligence
- 15.1.11.4.1 Market position
- 15.1.11.4.2 Financial strategy
- 15.1.11.4.3 Operational strategy
- 15.1.11.4.4 Market expansion strategy
- 15.1.11.4.5 Strategic DNA
- 15.1.11.4.6 Right to win
- 15.1.11.4.7 Product USP
- 15.1.11.4.8 Win-loss analysis
- 15.1.11.4.9 Recent strategic moves (2023-2026)
- 15.1.11.4.10 Potential moves (2026-2028)
- 15.1.11.4.11 Risks, constraints, & blindspots
- 15.1.11.4.12 Revenue teardown
- 15.1.11.5 SWOT analysis
- 15.1.11.6 MNM view
- 15.1.11.6.1 Key strengths
- 15.1.11.6.2 Strategic choices
- 15.1.11.6.3 Weaknesses & competitive threats
- 15.1.12 MAGNA INTERNATIONAL
- 15.1.12.1 Business overview
- 15.1.12.2 Products offered
- 15.1.12.3 Recent developments
- 15.1.12.4 Strategic intelligence
- 15.1.12.4.1 Market position
- 15.1.12.4.2 Financial strategy
- 15.1.12.4.3 Operational strategy
- 15.1.12.4.4 Market expansion strategy
- 15.1.12.4.5 Strategic DNA
- 15.1.12.4.6 Right to win
- 15.1.12.4.7 Product USP
- 15.1.12.4.8 Win-loss analysis
- 15.1.12.4.9 Recent strategic moves (2023-2026)
- 15.1.12.4.10 Potential moves (2026-2028)
- 15.1.12.4.11 Risks, constraints, & blindspots
- 15.1.12.4.12 Revenue teardown
- 15.1.12.5 SWOT analysis
- 15.1.12.6 MNM view
- 15.1.12.6.1 Key strengths
- 15.1.12.6.2 Strategic choices
- 15.1.12.6.3 Weaknesses & competitive threats
- 15.1.13 MURATA MANUFACTURING CO., LTD. (MODULES DIVISION)
- 15.1.13.1 Business overview
- 15.1.13.2 Products offered
- 15.1.13.3 Recent developments
- 15.1.13.4 Strategic intelligence
- 15.1.13.4.1 Market position
- 15.1.13.4.2 Financial strategy
- 15.1.13.4.3 Operational strategy
- 15.1.13.4.4 Market expansion strategy
- 15.1.13.4.5 Strategic DNA
- 15.1.13.4.6 Right to win
- 15.1.13.4.7 Product USP
- 15.1.13.4.8 Win-loss analysis
- 15.1.13.4.9 Recent strategic moves (2023-2026)
- 15.1.13.4.10 Potential moves (2026-2028)
- 15.1.13.4.11 Risks, constraints, & blindspots
- 15.1.13.4.12 Revenue teardown
- 15.1.13.5 SWOT analysis
- 15.1.13.6 MNM view
- 15.1.13.6.1 Key strengths
- 15.1.13.6.2 Strategic choices
- 15.1.13.6.3 Weaknesses & competitive threats
- 15.1.14 TE CONNECTIVITY
- 15.1.14.1 Business overview
- 15.1.14.2 Products offered
- 15.1.14.3 Recent developments
- 15.1.14.4 Strategic intelligence
- 15.1.14.4.1 Market position
- 15.1.14.4.2 Financial strategy
- 15.1.14.4.3 Operational strategy
- 15.1.14.4.4 Market expansion strategy
- 15.1.14.4.5 Strategic DNA
- 15.1.14.4.6 Right to win
- 15.1.14.4.7 Product USP
- 15.1.14.4.8 Win-loss analysis
- 15.1.14.4.9 Recent strategic moves (2023-2026)
- 15.1.14.4.10 Potential moves (2026-2028)
- 15.1.14.4.11 Risks, constraints, & blindspots
- 15.1.14.4.12 Revenue teardown
- 15.1.14.5 SWOT analysis
- 15.1.14.6 MNM view
- 15.1.14.6.1 Key strengths
- 15.1.14.6.2 Strategic choices
- 15.1.14.6.3 Weaknesses & competitive threats
- 15.1.1 ROBERT BOSCH GMBH
- 15.2 OTHER PLAYERS
- 15.2.1 MOBILEYE GLOBAL INC.
- 15.2.1.1 Business overview
- 15.2.1.2 Market position
- 15.2.1.3 Product portfolio
- 15.2.1.4 Operational strategy
- 15.2.1.5 Market expansion strategy
- 15.2.1.6 Product USP
- 15.2.1.7 Recent developments
- 15.2.1.8 MnM analyst view
- 15.2.1.9 Strategic DNA/win-loss analysis
- 15.2.1.10 Recent strategic moves (2023-2026)
- 15.2.2 BORGWARNER INC.
- 15.2.2.1 Business overview
- 15.2.2.2 Market position
- 15.2.2.3 Product portfolio
- 15.2.2.4 Operational strategy
- 15.2.2.5 Market expansion strategy
- 15.2.2.6 Product USP
- 15.2.2.7 Recent developments
- 15.2.2.8 MnM analyst view
- 15.2.2.9 Strategic DNA/win-loss analysis
- 15.2.2.10 Recent strategic moves (2023-2026)
- 15.2.3 HL MANDO CORPORATION
- 15.2.3.1 Business overview
- 15.2.3.2 Market position
- 15.2.3.3 Product portfolio
- 15.2.3.4 Operational strategy
- 15.2.3.5 Market expansion strategy
- 15.2.3.6 Product USP
- 15.2.3.7 Recent developments
- 15.2.3.8 MnM analyst view
- 15.2.3.9 Strategic DNA/win-loss analysis
- 15.2.3.10 Recent strategic moves (2023-2026)
- 15.2.4 VEONEER INC. (SSW PARTNERS)
- 15.2.4.1 Business overview
- 15.2.4.2 Market position
- 15.2.4.3 Product portfolio
- 15.2.4.4 Operational strategy
- 15.2.4.5 Market expansion strategy
- 15.2.4.6 Product USP
- 15.2.4.7 Recent developments
- 15.2.4.8 MnM analyst view
- 15.2.4.9 Strategic DNA/win-loss analysis
- 15.2.4.10 Recent strategic moves (2023-2026)
- 15.2.5 ALPS ALPINE CO., LTD.
- 15.2.5.1 Business overview
- 15.2.5.2 Market position
- 15.2.5.3 Product portfolio
- 15.2.5.4 Operational strategy
- 15.2.5.5 Market expansion strategy
- 15.2.5.6 Product USP
- 15.2.5.7 Recent developments
- 15.2.5.8 MnM analyst view
- 15.2.5.9 Strategic DNA/win-loss analysis
- 15.2.5.10 Recent strategic moves (2023-2026)
- 15.2.6 ISABELLENHUTTE HEUSLER GMBH & CO. KG
- 15.2.6.1 Business overview
- 15.2.6.2 Market position
- 15.2.6.3 Product portfolio
- 15.2.6.4 Operational strategy
- 15.2.6.5 Market expansion strategy
- 15.2.6.6 Product USP
- 15.2.6.7 Recent developments
- 15.2.6.8 MnM analyst view
- 15.2.6.9 Strategic DNA/win-loss analysis
- 15.2.6.10 Recent strategic moves (2023-2026)
- 15.2.7 LEM INTERNATIONAL SA
- 15.2.7.1 Business overview
- 15.2.7.2 Market position
- 15.2.7.3 Product portfolio
- 15.2.7.4 Operational strategy
- 15.2.7.5 Market expansion strategy
- 15.2.7.6 Product USP
- 15.2.7.7 Recent developments
- 15.2.7.8 MnM analyst view
- 15.2.7.9 Strategic DNA/win-loss analysis
- 15.2.7.10 Recent strategic moves (2023-2026)
- 15.2.8 HUF HULSBECK & FURST GMBH & CO. KG
- 15.2.8.1 Business overview
- 15.2.8.2 Market position
- 15.2.8.3 Product portfolio
- 15.2.8.4 Operational strategy
- 15.2.8.5 Market expansion strategy
- 15.2.8.6 Product USP
- 15.2.8.7 Recent developments
- 15.2.8.8 MnM analyst view
- 15.2.8.9 Strategic DNA/win-loss analysis
- 15.2.8.10 Recent strategic moves (2023-2026)
- 15.2.9 AMPHENOL ADVANCED SENSORS
- 15.2.9.1 Business overview
- 15.2.9.2 Market position
- 15.2.9.3 Product portfolio
- 15.2.9.4 Operational strategy
- 15.2.9.5 Market expansion strategy
- 15.2.9.6 Product USP
- 15.2.9.7 Recent developments
- 15.2.9.8 MnM analyst view
- 15.2.9.9 Strategic DNA/win-loss analysis
- 15.2.9.10 Recent strategic moves (2023-2026)
- 15.2.10 CTS CORPORATION
- 15.2.10.1 Business overview
- 15.2.10.2 Market position
- 15.2.10.3 Product portfolio
- 15.2.10.4 Operational strategy
- 15.2.10.5 Market expansion strategy
- 15.2.10.6 Product USP
- 15.2.10.7 Recent developments
- 15.2.10.8 MnM analyst view
- 15.2.10.9 Strategic DNA/win-loss analysis
- 15.2.10.10 Recent strategic moves (2023-2026)
- 15.2.11 BOURNS, INC.
- 15.2.11.1 Business overview
- 15.2.11.2 Market position
- 15.2.11.3 Product portfolio
- 15.2.11.4 Operational strategy
- 15.2.11.5 Market expansion strategy
- 15.2.11.6 Product USP
- 15.2.11.7 Recent developments
- 15.2.11.8 MnM analyst view
- 15.2.11.9 Strategic DNA/win-loss analysis
- 15.2.11.10 Recent strategic moves (2023-2026)
- 15.2.1 MOBILEYE GLOBAL INC.
16 RESEARCH METHODOLOGY
- 16.1 RESEARCH APPROACH
- 16.1.1 SECONDARY AND PRIMARY RESEARCH
- 16.1.2 SECONDARY DATA
- 16.1.2.1 List of major secondary sources
- 16.1.2.2 Key data from secondary sources
- 16.1.3 PRIMARY DATA
- 16.1.3.1 Breakdown of primaries
- 16.1.3.2 Key data from primary sources
- 16.1.3.3 Key primary participants
- 16.1.3.4 Key industry insights
- 16.2 MARKET SIZE ESTIMATION
- 16.2.1 BOTTOM-UP APPROACH
- 16.2.2 TOP-DOWN APPROACH
- 16.2.3 MARKET SIZE CALCULATION FOR BASE YEAR
- 16.3 MARKET FORECAST APPROACH
- 16.3.1 SUPPLY SIDE
- 16.3.2 DEMAND SIDE
- 16.4 MARKET BREAKDOWN AND DATA TRIANGULATION
- 16.5 RESEARCH ASSUMPTIONS
- 16.6 RISK ASSESSMENT
17 APPENDIX
- 17.1 KNOWLEDGESTORE: MARKETSANDMARKETS' SUBSCRIPTION PORTAL
- 17.2 AUTHOR DETAILS


