|
시장보고서
상품코드
1444408
발전용 증기 터빈 시장 : 점유율 분석, 산업 동향 및 통계, 성장 예측(2024-2029년)Steam Turbine For Power Generation - Market Share Analysis, Industry Trends & Statistics, Growth Forecasts (2024 - 2029) |
||||||
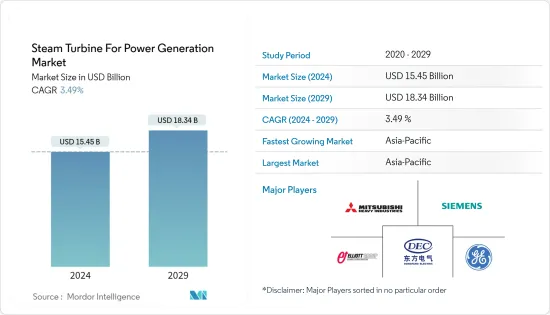
발전용 증기 터빈(Steam Turbine For Power Generation) 시장 규모는 2024년에 154억 5,000만 달러로 추정되고, 2029년까지 183억 4,000만 달러에 이를 것으로 예측되고 있으며, 예측 기간(2024-2029년) 중에 3.49%의 CAGR을 기록 할 전망입니다.
발전용 증기 터빈 시장은 올해 말까지 149억 3,000만 달러에 이를 것으로 추정되며, 향후 5년간 177억 2,000만 달러에 이를 것으로 예측되며, 예측 기간 동안 3.49% 이상의 CAGR을 기록 할 전망입니다.
주요 하이라이트
- 중기적으로는 향후 천연가스 복합화력 발전소 및 화력 석탄 발전소, 무정전 전력 공급에 대한 강조 증가와 같은 요인이 발전용 증기 터빈 시장을 견인할 것으로 예상됩니다.
- 반면에 재생 에너지 발전의 채택 증가와 청정 에너지원에 대한 수요는 예측 기간 동안 시장 성장을 저해할 것으로 예상됩니다.
- 그럼에도 불구하고 대부분의 수요가 북미 및 아시아 태평양 지역에서 발생하는 복합 사이클 발전소의 효율성이 증가하면 예측 기간 동안 시장에 수익성있는 성장 기회가 창출 될 것입니다.
- 아시아 태평양 지역은 에너지 수요 증가로 인해 예측 기간 동안 가장 빠르게 성장하는 시장입니다. 이러한 성장은 인도, 중국, 호주를 포함한 이 지역 국가에 대한 투자 증가에 기인합니다.
발전용 증기 터빈 시장 동향
상당한 성장을 이루는 천연가스 플랜트
- 가스 복합화력 발전소(CCP)는 가스와 증기 터빈을 함께 사용하여 기존 단순 사이클 발전소보다 동일한 연료로 최대 50% 더 많은 전기를 생산합니다. 가스 터빈의 폐열은 근처의 증기 터빈으로 보내져 추가 전력을 생산합니다.
- 천연가스 복합화력발전소는 석탄화력발전소에 비해 이산화탄소(CO2)와 같은 온실가스뿐만 아니라 이산화황(SO2) 및 질소산화물(NOx)과 같은 기타 오염물질 배출량이 현저히 낮습니다. 따라서 더 깨끗한 발전 옵션이 되어 대기질 개선과 환경 영향 감소에 기여합니다.
- 전 세계적으로 재생 에너지에 대한 수요가 증가하면서 천연가스 발전소의 인기도 높아졌습니다. 특히 아시아 태평양 지역에서 석탄에서 천연가스로의 전환으로 인해 가스 수요가 증가하고 있습니다. 예를 들어, 에너지 연구소의 세계 에너지 통계에 따르면 2022년 전 세계 천연가스 소비량은 약 3,941.3억 입방미터를 기록했습니다. 이는 발전원으로서 천연가스에 대한 상당한 수요를 창출할 것으로 예상됩니다.
- 천연가스 복합화력발전소는 운영 유연성이 뛰어나 전력 수요 변화에 신속하게 대응할 수 있습니다. 비교적 빠르게 전력 출력을 높이거나 낮출 수 있어 태양광과 풍력 같은 재생 에너지원의 간헐적인 특성과 균형을 맞추는 데 적합합니다.
- 도시화, 에너지 수요 증가, 산업화 및 인프라 개발 활동을 촉진하려는 정부의 노력으로 인해 전 세계적으로 가스 복합 발전 사이클에 대한 필요성이 증가하고 있습니다. 대부분의 국가는 증가하는 전력 수요를 충족하기 위해 이러한 발전 시설에 투자하고 있습니다.
- 예를 들어, 미국에서는 2021년 현재 약 32.3GW의 신규 천연가스 화력 발전소가 2025년에 가동을 시작할 예정이고 개발 단계에 있습니다. 현재 14.2GW가 건설 중이고, 3.4GW가 건설 전 단계에 있으며, 14.7GW가 인허가 진행 단계에 있습니다.
- 천연가스 공급 및 송전 인프라를 활용하여 기존 부지에 많은 천연가스 복합화력 발전소를 건설하거나 개조할 수 있습니다. 이는 새로운 발전 용량을 신속하게 배치하는 데 도움이 될 수 있습니다.
- 예를 들어, 아시아개발은행은 2023년 3월 인도 트리푸라에 120MW 규모의 가스 연소 복합화력발전소를 설립할 것이라고 발표했습니다. 마찬가지로 같은 달 몬테네그로 정부는 미국의 Enerflex Energy Systems 및 Wethington Energy Innovation과 같은 기업과 액화천연가스(LNG) 터미널 및 가스 화력발전소 건설에 관한 양해각서를 체결했습니다. CCGP 발전소의 용량은 240MW에서 440MW 사이가 될 가능성이 높습니다.
- 천연가스 복합화력 발전소는 효율성, 낮은 배출량, 유연성, 신뢰성, 비용 효율성 사이에서 균형을 이루고 있어 발전용으로 인기가 높아 전 세계적으로 증기 터빈에 대한 수요가 증가하고 있습니다.
아시아 태평양이 시장을 독점할 것으로 예상
- 아시아 태평양 지역은 이미 증기 터빈의 최대 시장이며 향후 몇 년 동안 증기 터빈에 대한 상당한 수요가 창출될 것으로 예상됩니다. 아시아 태평양 지역의 화력발전은 전체 전력 생산량의 50% 이상을 차지합니다.
- 중국전력위원회(CEC)에 따르면 2021년 화력발전소의 발전량은 약 5646.3TWh, 원자력은 약 407.5TWh로, 2021년 발전량 점유율은 약 72.2%를 차지했습니다. 지난 몇 년 동안 이와 유사한 추세가 목격되었으며 향후 몇 년 동안 비슷한 성장 추세를 보일 것으로 예상됩니다.
- 2023년 1월 현재 중국은 전 세계에서 가장 많은 석탄 화력발전소를 운영하고 있습니다. 2023년 1월까지 중국은 약 3092기의 가동 중인 석탄 화력발전소, 499기의 건설 중인 석탄 화력발전소, 112기의 발표 석탄 화력발전소를 보유하고 있습니다. 따라서 이러한 추세는 향후 몇 년 동안 증기 터빈 시장을 견인할 것입니다.
- 중앙전력청(CEA)에 따르면 인도에는 205.2GW의 석탄, 6.62GW의 갈탄, 24.8GW의 천연가스, 0.58GW의 디젤 화력발전소가 있습니다. 나머지 6.7GW의 원자력 발전소와 172.5GW의 재생 가능 발전소는 2023년 4월까지 인도에 존재합니다.
- 인도 전력부에 따르면 인도에는 약 28460MW의 화력발전소가 건설 중이며, 향후 5년 동안 가동될 것으로 예상됩니다. 건설 중인 화력발전소 중 약 12830MW는 중앙정부가, 15630MW는 주정부가 운영할 것으로 예상됩니다. 따라서 이러한 향후 화력발전소 건설은 향후 몇 년 동안 증기 터빈 시장에 대한 수요를 증가시킬 것입니다.
- 지속 가능한 에너지 정책 연구소(ISEP)에 따르면 2022년 화석 연료는 일본 전체 발전량의 72.4%를 차지하여 전년도 수치인 71.7%보다 소폭 증가했습니다. 액화천연가스(LNG) 발전 비중은 전년의 31.7%에서 29.9%로 감소했는데, 이는 부분적으로 가격 상승의 영향을 받은 것으로 보입니다.
- 그러나 일본의 석탄 발전량은 27.8%로 전년의 26.5%에 비해 증가세를 보였습니다. 반면, 원자력은 4.8%의 발전량을 기록해 전년의 5.9%보다 감소했습니다.
- 따라서 위와 같은 발전과 향후 화력발전소 건설로 인해 아시아 태평양 지역이 예측 기간 동안 시장을 지배할 것으로 예상됩니다.
발전 산업용 증기 터빈 개요
발전용 증기 터빈 시장은 반 통합되어 있습니다. 시장의 주요 업체 중 일부는, Siemens Energy AG, General Electric Company, Dongfang Turbine Company Limited, Bharat Heavy Electricals Limited, Mitsubishi Heavy Industries Ltd. 등이 있습니다.
기타 혜택
- 엑셀 형식 시장 예측(ME) 시트
- 3개월의 애널리스트 서포트
목차
제1장 서론
- 조사 범위
- 시장 정의
- 조사 전제 조건
제2장 조사 방법
제3장 주요 요약
제4장 시장 개요
- 소개
- 시장 규모 및 수요 예측(-2028년)(USD)
- 최근 동향 및 발전
- 정부 정책 및 규제
- 시장 역학
- 성장 촉진 요인
- 24시간 365일 지속적인 전력 공급 필요성
- 발전용 천연가스의 보급 확대
- 억제 요인
- 석탄화력발전소의 탄소 배출량
- 에너지 믹스에서 재생 가능 에너지 비율 증가
- 성장 촉진 요인
- 공급망 분석
- Porter's Five Forces 분석
- 공급기업의 협상력
- 소비자의 협상력
- 신규 참가업체의 위협
- 대체 제품 및 서비스의 위협
- 경쟁 기업간 경쟁 관계
제5장 시장 세분화
- 공장 유형
- 가스
- 석탄
- 기타 플랜트 유형(원자력, CHP 등)
- 용량
- 20MW 미만
- 20-40MW
- 40MW 이상
- 지역(지역 시장 분석 : 시장 규모 및 수요 예측(-2028년))
- 북미
- 미국
- 캐나다
- 기타 북미
- 아시아 태평양
- 중국
- 인도
- 일본
- 기타 아시아 태평양
- 유럽
- 독일
- 프랑스
- 영국
- 이탈리아
- 기타 유럽
- 중동 및 아프리카
- 사우디아라비아
- 아랍에미리트(UAE)
- 남아프리카공화국
- 카타르
- 남미
- 브라질
- 아르헨티나
- 기타 남미
- 북미
제6장 경쟁 구도
- 인수 합병, 합작사업, 협업, 계약
- 유력 기업이 채택한 전략
- 기업 개요
- Siemens Energy AG
- Mitsubishi Heavy Industries Limited
- Bharat Heavy Electricals Limited
- General Electric Company
- Dongfang Turbine Company Limited
- Toshiba Corporation
- Doosan Enerbility Co., Ltd.
- Elliot Group
- WEG SA
- MAN Energy Solutions SE
제7장 시장 기회 및 향후 동향
- 복합 사이클 발전소의 효율 향상
The Steam Turbine For Power Generation Market size is estimated at USD 15.45 billion in 2024, and is expected to reach USD 18.34 billion by 2029, growing at a CAGR of 3.49% during the forecast period (2024-2029).

The steam turbine for power generation market is estimated to be at USD 14.93 billion by the end of this year and is projected to reach USD 17.72 billion in the next five years, registering a CAGR of over 3.49% during the forecast period.
Key Highlights
- Over the medium term, factors such as upcoming natural gas combined cycle plants and thermal coal plants and growing emphasis on uninterrupted power supply are expected to drive the steam turbine for power generation market.
- On the other hand, the increasing adoption of renewable energy power generation and the demand for clean energy sources is expected to hinder the market growth during the forecast period.
- Nevertheless, increasing efficiency of combined cycle power plants with most of the demand coming from the North America and Asia Pacific region will likely create lucrative growth opportunities for the market during the forecast period.
- Asia-Pacific is the fastest-growing market during the forecast period due to the rising energy demand. This growth is attributed to increasing investments in the countries of this region, including India, China, and Australia.
Steam Turbine For Power Generation Market Trends
Natural Gas Plants to Witness Significant Growth
- A gas combined-cycle power plant (CCP) uses gas and a steam turbine together to produce up to 50% more electricity from the same fuel than a traditional simple-cycle plant. The waste heat from the gas turbine is routed to the nearby steam turbine, which generates extra power.
- Compared to coal-fired power plants, natural gas combined cycle plants produce significantly lower emissions of greenhouse gases, such as carbon dioxide (CO2), as well as other pollutants like sulfur dioxide (SO2) and nitrogen oxides (NOx). This makes them a cleaner option for electricity generation, contributing to improved air quality and reduced environmental impact.
- The rising global demand for renewable energy has increased the popularity of natural gas power plants. The demand for gas is increasing, especially in Asia-Pacific, due to the shift from coal to natural gas. For instance, according to the Energy Institute Statistical Review of World Energy statistics, in 2022, the total natural gas consumption recorded about 3941.3 billion cubic meters across the globe. This is expected to create significant demand for natural gas as a power generation source.
- Natural gas combined cycle plants offer operational flexibility, allowing them to respond quickly to changes in electricity demand. They can ramp up or down their power output relatively quickly, making them well-suited for balancing the intermittent nature of renewable energy sources like solar and wind.
- With growing urbanization, rising demand for energy, and government efforts to boost industrialization and infrastructure development activities, the need for a global gas-combined power cycle is increasing. Most countries invest in these generation facilities to meet the rising electricity demand.
- For instance, in the United States, as of 2021, approximately 32.3 GW of new natural gas-fired power plants are scheduled to begin operations in 2025 and are in advanced stages of development. 14.2 GW is currently under construction, 3.4 GW is in pre-construction, and 14.7 GW is in advanced permitting.
- Many natural gas combined cycle plants can be built or retrofitted at existing sites, leveraging the infrastructure for natural gas supply and electricity transmission. This can help to expedite the deployment of new power generation capacity.
- For instance, In March 2023, the Asian Development Bank announced that it would set up a 120 MW gas-fired combined cycle power plant in Tripura, India. Similarly, in the same month, the government of Montenegro signed an MoU with companies like Enerflex Energy Systems and Wethington Energy Innovation from the United States on the construction of a liquefied natural gas (LNG) terminal and a gas-fired power plant. The CCGP plant will likely have a capacity between 240 MW to 440 MW.
- Therefore, natural gas combined cycle power plants offer a balance between efficiency, lower emissions, flexibility, reliability, and cost-effectiveness, making them a popular choice for electricity generation and hence increasing the demand for steam turbines across the globe.
Asia-Pacific Expected to Dominate the Market
- Asia-Pacific is already the largest market for steam turbines and is expected to create significant demand for steam turbines over the coming years. Thermal power generation in the Asia-Pacific contributes to more than 50% of their electricity generation.
- As per the China Electricity Council (CEC), electricity generation from thermal power plants was around 5646.3 TWh, and nuclear was about 407.5 TWh in 2021, representing an electricity generation share of approximately 72.2% in 2021. Such a similar trend was witnessed during the past several years and is expected to have a similar growth trend during the upcoming years.
- As of January 2023, the country has the highest number of operating coal thermal power plants worldwide. Till January 2023, China has around 3092 units of operating coal thermal power plants, 499 under-construction coal power plants, and 112 announced coal power plants. Hence, such a trend would propel the steam turbine market in the upcoming years.
- As per the Central Electricity Authority (CEA), India has 205.2 GW of coal, 6.62 GW of lignite, 24.8 GW of natural gas, and 0.58 GW of diesel thermal power plants. Rest, 6.7 GW of nuclear and 172.5 GW of renewable power plants are present in India till April 2023.
- As per the Ministry of Power, there are nearly 28460 MW of under-construction thermal power plants in India, expected to come online during the next five years. Among all the under-construction, about 12830 MW is likely to be operated by the Central Ministry, while 15630 MW is expected to be operated by the State Ministry. Hence, such upcoming thermal power plants would increase demand for the steam turbine market in the forthcoming years.
- According to the Institute for Sustainable Energy Policies (ISEP), in 2022, fossil fuels constituted 72.4% of the overall electricity generation in Japan, marking a slight increase from the previous year's figure of 71.7%. The proportion of electricity generated from liquefied natural gas (LNG) decreased to 29.9%, down from 31.7% recorded in the previous year, partly influenced by price escalations.
- However, Japan's coal-based electricity generation saw an increase, rising to 27.8% compared to the previous year's 26.5%. Conversely, nuclear power contributed 4.8% to electricity generation, declining from the previous year's 5.9%.
- Thus, with the above developments and upcoming thermal power plants, the Asia-Pacific region is expected to dominate the market during the forecast period.
Steam Turbine For Power Generation Industry Overview
The steam turbine for power generation market is semi consolidated. Some of the major players in the market (in no particular order) include Siemens Energy AG, General Electric Company, Dongfang Turbine Company Limited, Bharat Heavy Electricals Limited, and Mitsubishi Heavy Industries Ltd.
Additional Benefits:
- The market estimate (ME) sheet in Excel format
- 3 months of analyst support
TABLE OF CONTENTS
1 INTRODUCTION
- 1.1 Scope of the Study
- 1.2 Market Definition
- 1.3 Study Assumptions
2 RESEARCH METHODOLOGY
3 EXECUTIVE SUMMARY
4 MARKET OVERVIEW
- 4.1 Introduction
- 4.2 Market Size and Demand Forecast in USD, till 2028
- 4.3 Recent Trends and Developments
- 4.4 Government Policies and Regulations
- 4.5 Market Dynamics
- 4.5.1 Drivers
- 4.5.1.1 Need for Continuous 24/7 Supply of Electricity
- 4.5.1.2 Increasing Penetration of Natural Gas for Power Generation
- 4.5.2 Restraint
- 4.5.2.1 Coal Fired Power Plants Carbon Emissions
- 4.5.2.2 Increasing Share of Renewables in Energy Mix
- 4.5.1 Drivers
- 4.6 Supply Chain Analysis
- 4.7 Porter's Five Forces Analysis
- 4.7.1 Bargaining Power of Suppliers
- 4.7.2 Bargaining Power of Consumers
- 4.7.3 Threat of New Entrants
- 4.7.4 Threat of Substitute Products and Services
- 4.7.5 Intensity of Competitive Rivalry
5 MARKET SEGMENTATION
- 5.1 Plant Type
- 5.1.1 Gas
- 5.1.2 Coal
- 5.1.3 Other Plant Types (Nuclear, CHP, etc.)
- 5.2 Capacity
- 5.2.1 Less than 20 MW
- 5.2.2 20 - 40 MW
- 5.2.3 Above 40 MW
- 5.3 Geography (Regional Market Analysis {Market Size and Demand Forecast till 2028 (for regions only)})
- 5.3.1 North America
- 5.3.1.1 United States
- 5.3.1.2 Canada
- 5.3.1.3 Rest of North America
- 5.3.2 Asia-Pacific
- 5.3.2.1 China
- 5.3.2.2 India
- 5.3.2.3 Japan
- 5.3.2.4 Rest of Asia-Pacific
- 5.3.3 Europe
- 5.3.3.1 Germany
- 5.3.3.2 France
- 5.3.3.3 United Kingdom
- 5.3.3.4 Italy
- 5.3.3.5 Rest of Europe
- 5.3.4 Middle-East and Africa
- 5.3.4.1 Saudi Arabia
- 5.3.4.2 United Arab Emirates
- 5.3.4.3 South Africa
- 5.3.4.4 Qatar
- 5.3.5 South America
- 5.3.5.1 Brazil
- 5.3.5.2 Argentina
- 5.3.5.3 Rest of South America
- 5.3.1 North America
6 COMPETITIVE LANDSCAPE
- 6.1 Mergers and Acquisitions, Joint Ventures, Collaborations, and Agreements
- 6.2 Strategies Adopted by Leading Players
- 6.3 Company Profiles
- 6.3.1 Siemens Energy AG
- 6.3.2 Mitsubishi Heavy Industries Limited
- 6.3.3 Bharat Heavy Electricals Limited
- 6.3.4 General Electric Company
- 6.3.5 Dongfang Turbine Company Limited
- 6.3.6 Toshiba Corporation
- 6.3.7 Doosan Enerbility Co., Ltd.
- 6.3.8 Elliot Group
- 6.3.9 WEG S.A.
- 6.3.10 MAN Energy Solutions SE
7 MARKET OPPORTUNITIES AND FUTURE TRENDS
- 7.1 Increasing Efficiency of Combined Cycle Power Plants


