

|
시장보고서
상품코드
2122452
산업용 요소 : 시장 점유율 분석, 업계 동향 및 통계, 성장 예측(2026-2031년)Industrial Grade Urea - Market Share Analysis, Industry Trends & Statistics, Growth Forecasts (2026 - 2031) |
||||||
 Mordor Intelligence
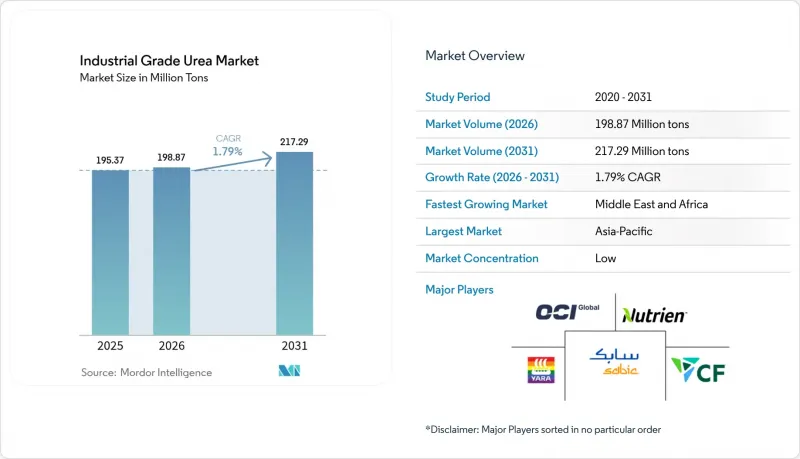
Mordor Intelligence에 의하면, 산업용 요소 시장 규모는 2025년에 1억 9,537만 톤으로 평가되었습니다. 2026년 1억 9,887만 톤에서 2031년까지 2억 1,729만 톤에 이를 것으로 예상되며, 예측 기간(2026-2031년) CAGR은 1.79%를 나타낼 전망입니다.

본 보고서는 등급별(비료 등급, 기술 등급, 사료 등급), 최종 사용자 산업별(농업, 화학, 자동차, 의료, 기타 최종 사용자 산업), 지역별(아시아태평양, 북미, 유럽, 남미, 중동 및 아프리카)로 분류되어 있습니다. 시장 예측은 수량(톤) 기준으로 제시되어 있습니다.
세계의 산업용 요소 시장 동향 및 인사이트
디젤 배기가스 처리액(DEF) 채택 확대에 따른 기술 등급 수요의 변화
상용차의 배기가스 규제가 DEF의 꾸준한 보급을 뒷받침하고 있으며, 중국의 ‘국가 VI’ 규제만으로도 2025년에는 DEF 소비량이 2,500만 톤에 달했습니다. 유럽 기업들은 기존 암모니아·요소 복합 시설에 DEF 생산 라인을 통합하고 있으며, 그 예로 CF 인더스트리즈의 ‘블루 포인트’ 프로젝트를 들 수 있습니다. 이 프로젝트에서는 2029년부터 연간 140만 톤의 저탄소 암모니아 생산이 추가될 예정입니다. 이는 비료 수요의 계절적 변동에 대한 방어적 헤지 역할을 하며, 프리미엄 가격 유지에도 기여할 것입니다. EPA의 2027년 규제를 준수하는 북미 차량 함대는 중기적인 수요 하한선을 더욱 공고히 하는 한편, 건설 및 광업 부문의 비도로용 기계는 대상 시장을 확대되고 있습니다. 전반적으로 DEF의 부상으로 산업용 요소 시장의 일부가 고순도 제품으로 이동하고 있으며, 이는 간접적으로 이익률을 끌어올리고 정제 인프라에 대한 투자를 촉진하고 있습니다.
그린 암모니아 통합을 통한 생산 경제성 재구축
유럽연합(EU)의 RED III가 정한 ‘2030년까지 재생 가능 수소 비율을 42%로 한다’는 요건은 저탄소 암모니아의 도입을 가속화하여, 전해조 비용과 재생 가능 전력 공급 가능성을 새로운 수익원으로 전환시키고 있습니다. 스타미카본의 ‘NX Stami Green Ammonia’ 모듈은 일일 50-500톤 규모에서 자본 지출(CAPEX)을 25-30% 절감하고, 운송 경로를 단축하며, 스코프 3 배출량을 억제하는 지역 공급 허브의 실현을 가능하게 합니다. 중동에서의 시범 프로젝트는 태양광 발전에 의한 전해와 요소 합성을 결합하는 것을 목표로 하고 있으며, 단일 부지 내 메가 플랜트로의 전환을 시사하고 있습니다. 조기 도입 기업은 탄소 규제가 적용되는 수출 시장에서 규정 준수 측면에서 우위를 점하고, 탄소 발자국이 낮은 공급망을 추구하는 식음료 기업으로부터 공급 계약을 확보할 수 있습니다. 장기적으로는 이러한 동향으로 인해 산업용 요소 시장이 천연가스 가격 급등이나 탄소 비용의 영향을 받을 위험이 완화될 가능성이 있습니다.
천연가스 가격 변동이 생산 수익성에 미치는 영향
현물 가스 가격은 2022년 6.54달러/MMBtu에서 2023년 2.66달러/MMBtu로 급락하여, 원료비가 현금 비용의 70-90%를 차지하는 생산자들을 어려운 상황에 몰아넣었습니다. 2022년 에너지 위기 당시, 유럽의 플랜트는 가동률을 75%로 억제했으며, 무역 흐름은 중동공급업체로 이동했습니다. 셰일가스를 기반으로 하는 미국 사업자들은 구조적인 비용 우위를 누리고 있는 반면, 순수입 지역에서는 가격 급등 시 마이너스 마진에 직면하고 있습니다. 헤지 전략, 듀얼 연료 대응, 그린 암모니아에 대한 투자가 새로운 대책으로 대두되고 있지만, 이를 위해서는 막대한 자본과 정책적 지원이 필요합니다.
부문별 분석
2025년, 비료용 등급은 산업용 요소 시장의 84.65%를 차지했으며, 2031년까지 연평균 성장률(CAGR) 1.83%로 확대될 것으로 예측됩니다. 기술 등급의 점유율은 작지만, DEF(디젤 배기가스 처리액) 수요에 힘입어 성장이 가속화되고 있으며, 예측 기간 내에 그 점유율을 130베이시스포인트 끌어올릴 가능성이 있습니다. 사료용 등급은 엄격한 순도 요건이 요구되는 반추동물의 영양 부문에 대응하고 있습니다. 풀형 응축 반응기 등의 공정 혁신을 통해 설비 투자(CAPEX)를 최대 30%까지 절감할 수 있으며, 변동하는 이익률에 신속하게 대응할 수 있는 다제품 생산 체제를 구축할 수 있습니다.
DEF 및 멜라민 수요는 농작물 수확 주기와 무관하기 때문에 수익의 계절적 변동이 완화되어 유연성이 중요해집니다. 자동차용 등급 요소 인증을 획득한 생산자는 ISO 22241 품질 기준을 충족하며, 지속적인 프리미엄 가격을 확보하고 있습니다. 반면, 비료 제조업체는 여전히 보조금 제도와 환경 규제로 인한 시비량 상한의 영향을 받고 있습니다. 이러한 차이야말로 예측 기간 동안 산업용 등급 요소 시장에서 기술 등급이 가장 빠르게 성장하는 부문이 될 것이라는 점을 뒷받침합니다.
지역별 분석
아시아태평양은 인도와 중국의 농업 투입재 수요 및 DEF 수요 증가에 힘입어 2025년에는 66.10%의 점유율로 산업용 요소 시장을 독점했습니다. 인도의 현지 생산 확대는 2025년까지 자급자족을 목표로 해, 수입 의존도를 낮췄습니다.
중동 및 아프리카는 사우디아라비아, 이집트, 알제리의 저비용 가스 원료와 수출 지향적인 생산 능력 확충에 힘입어 2031년까지 연평균 성장률(CAGR) 2.33%로 가장 높은 성장률을 기록할 전망입니다. 신규 복합 시설에는 미래의 탄소 경쟁 우위를 확보하기 위해 그린 수소 시범 생산 라인이 통합되어 있습니다. 유럽의 점유율은 가스 가격 급등과 탈탄소화 정책을 배경으로 축소되고 있습니다. 여러 플랜트가 계절 한정으로 가동되거나 생산 제한을 받고 있어, 북아프리카 및 미국에 대한 수입 의존도가 높아지고 있습니다.
북미에서는 풍부한 셰일가스와 대형 차량에 대한 DEF(디젤 배기 액) 도입 확대를 배경으로 수요가 견조한 추세를 보이고 있습니다. 무역 동향은 계속해서 변화하고 있습니다. 중국에서는 정책적 규제로 인해 2024년 상반기 수출량이 90% 감소하면서, 동남아시아와 라틴아메리카에서 일시적인 공급 부족이 발생했습니다. 중동의 생산자들은 이러한 공급 격차를 신속하게 메우며 스윙 공급업체로서의 입지를 공고히 했습니다. 장기적으로는 아시아태평양이 주도권을 유지할 것, 지속가능성 관련 정책과 국내 공급 우선순위가 대외 무역 구도를 재편함에 따라 그 성장세는 완만해질 전망입니다.
기타 혜택
- 엑셀 형식 시장 예측(ME) 시트
- 3개월간의 애널리스트 지원
자주 묻는 질문
목차
제1장 서론
제2장 조사 방법
제3장 주요 요약
제4장 시장 구도
제5장 시장 규모 및 성장 예측
제6장 경쟁 구도
제7장 시장 기회 및 향후 전망
KTH 26.09.08According to Mordor Intelligence, the industrial grade urea market size was valued at 195.37 Million tons in 2025 and estimated to grow from 198.87 Million tons in 2026 to reach 217.29 Million tons by 2031, at a CAGR of 1.79% during the forecast period (2026-2031).
This report is Segmented by Grade (Fertilizer Grade, Technical Grade, and Feed Grade), End-User Industry (Agriculture, Chemical, Automotive, Medical, and Other End-User Industries), and Geography (Asia-Pacific, North America, Europe, South America, and Middle-East and Africa). The Market Forecasts are Provided in Terms of Volume (Tons)
Global Industrial Grade Urea Market Trends and Insights
Rising Diesel Exhaust Fluid Adoption Transforms Technical Grade Demand
Commercial vehicle emission standards underpin a robust uptake of DEF, with China's National VI regulations alone expected to lift DEF consumption to 25 million tons in 2025. European players are integrating DEF lines into existing ammonia-urea complexes, illustrated by CF Industries' Blue Point project that will add 1.4 million tpy low-carbon ammonia from 2029. This defensively hedges against seasonal fertilizer swings and supports premium pricing. North American fleets following EPA 2027 rules further reinforce a medium-term demand floor, while off-road machinery in construction and mining extends the addressable market. Overall, DEF's rise shifts a portion of the industrial-grade urea market toward higher-purity products, indirectly raising margins and encouraging investments in purification infrastructure.
Green Ammonia Integration Reshapes Production Economics
The European Union's RED III requirement for 42% renewable hydrogen by 2030 accelerates low-carbon ammonia adoption, turning electrolyzer costs and renewable power availability into new profit levers. Stamicarbon's NX Stami Green Ammonia modules slash CAPEX 25-30% at 50-500 t per day scale, enabling regional supply hubs that shorten freight routes and curb scope 3 emissions. Pilot projects in the Middle East aim to couple solar-powered electrolysis with urea synthesis, signaling a shift away from single-site mega-plants. Early adopters gain compliance advantages in carbon-regulated export markets and secure offtake agreements from food and beverage firms seeking lower-footprint supply chains. Over the long term, these developments could moderate the industrial-grade urea market's exposure to natural-gas price spikes and carbon costs.
Natural Gas Price Volatility Threatens Production Viability
Spot gas swung from USD 6.54/MMBtu in 2022 to USD 2.66/MMBtu in 2023, exposing producers whose feedstock can constitute 70-90% of cash costs. European plants curtailed utilization to 75% amid the 2022 energy crisis, redirecting trade flows toward Middle Eastern suppliers. U.S. operators with shale-based gas benefit from structural cost advantages, whereas net-importing areas confront negative margins during price spikes. Hedging strategies, dual-fuel capabilities, and green ammonia investments are emerging defenses but require substantial capital and policy support.
Other drivers and restraints analyzed in the detailed report include:
- Technical Grade Applications Drive Premium Segment Growth
- Emerging Asia Fertilizer Demand Sustains Long-term Growth
- Environmental Regulations Constrain Application Growth
For complete list of drivers and restraints, kindly check the Table Of Contents.
Segment Analysis
Fertilizer grade accounted for 84.65% of the industrial grade urea market in 2025 and is forecast to expand at a 1.83% CAGR to 2031. The technical grade slice, while smaller, accelerates on DEF demand, potentially lifting its share by 130 basis points within the outlook period. Feed grade addresses ruminant nutrition niches with stringent purity needs. Process innovations such as pool-condenser reactors lower CAPEX by up to 30%, enabling multiproduct configurations that respond swiftly to shifting margins.
Flexibility matters because DEF and melamine demand decouple from crop cycles, smoothing revenue seasonality. Producers certified for automotive-grade urea meet ISO 22241 quality thresholds, commanding sustained premiums. In contrast, fertilizer producers remain exposed to subsidy regimes and environmentally driven application caps. This divergence underlines why technical grade is the fastest growing component of the industrial grade urea market size across the forecast.
Complete Report Scope:
- By Grade
- Fertilizer Grade
- Technical Grade
- Feed Grade
- By End-user Industry
- Agriculture
- Chemical
- Automotive
- Medical
- Other End-user Industries
- By Geography
- Asia-Pacific
- China
- India
- Japan
- South Korea
- ASEAN
- Rest of Asia-Pacific
- North America
- United States
- Canada
- Mexico
- Europe
- Germany
- France
- United Kingdom
- Italy
- Russia
- Rest of Europe
- South America
- Brazil
- Argentina
- Rest of South America
- Middle-East and Africa
- Saudi Arabia
- South Africa
- Rest of Middle-East and Africa
- Asia-Pacific
Geography Analysis
Asia-Pacific dominated the industrial-grade urea market size with a 66.10% share in 2025, driven by India's and China's crop inputs and rising DEF uptake. Local production expansion in India aims for self-sufficiency by 2025, potentially trimming import reliance.
The Middle East and Africa region posts the fastest 2.33% CAGR through 2031, fueled by low-cost gas feedstock and export-oriented capacity additions in Saudi Arabia, Egypt, and Algeria. New complexes integrate green-hydrogen pilot lines to future-proof carbon competitiveness. Europe's share contracts amid high gas costs and decarbonization policies; several plants operate seasonally or under curtailment, increasing import reliance on North Africa and the United States.
North America maintains steady demand, benefiting from abundant shale gas and ongoing DEF adoption in heavy-duty fleets. Trade patterns continue shifting: China's H1 2024 export volumes fell 90% following policy restrictions, creating spot shortages in Southeast Asia and Latin America. Middle Eastern producers quickly captured these gaps, affirming their swing-supplier status. Over the long term, Asia-Pacific retains leadership, yet its growth moderates as sustainability policies and domestic supply priorities reshape external trade.
- Acron
- BASF
- CF Industries Holdings Inc.
- Chambal Fertilisers & Chemicals Ltd
- China National Petroleum Corporation (CNPC)
- EuroChem Group
- Genesis Fertilizers
- IFFCO
- Industries Qatar
- Koch Fertilizer LLC
- National Fertilizers Limited
- Notore Chemical Industries PLC
- Nutrien Ltd
- OCI
- Paradeep Phosphates Ltd
- Petrobras
- PT Pupuk Kalimantan Timur (PKT)
- SABIC
- The Chemical Company (TCC)
- Uralchem JSC
- Yara
Additional Benefits:
- The market estimate (ME) sheet in Excel format
- 3 months of analyst support
TABLE OF CONTENTS
1 Introduction
- 1.1 Study Assumptions and Market Definition
- 1.2 Scope of the Study
2 Research Methodology
3 Executive Summary
4 Market Landscape
- 4.1 Market Overview
- 4.2 Market Drivers
- 4.2.1 High applicability of technical-grade urea
- 4.2.2 Rising diesel exhaust fluid (DEF/AdBlue) adoption in on-road and off-road vehicles
- 4.2.3 Expanding fertilizer consumption in emerging Asia
- 4.2.4 Increased melamine and resin production for engineered wood
- 4.2.5 Shift toward green ammonia-based urea via low-carbon hydrogen
- 4.3 Market Restraints
- 4.3.1 Indiscriminate over-application in groundwater-stressed regions
- 4.3.2 Volatile natural-gas pricing impacting production cost
- 4.3.3 Stricter fertilizer subsidy reforms in major consuming countries
- 4.4 Value Chain Analysis
- 4.5 Regulatory Policy Analysis
- 4.6 Technological Outlook
- 4.6.1 Production Process
- 4.6.2 Patent Analysis
- 4.7 Porter's Five Forces
- 4.7.1 Bargaining Power of Suppliers
- 4.7.2 Bargaining Power of Buyers
- 4.7.3 Threat of New Entrants
- 4.7.4 Threat of Substitutes
- 4.7.5 Degree of Competition
- 4.8 Feedstock Analysis
- 4.9 Import-Export Trends
5 Market Size and Growth Forecasts (Volume)
- 5.1 By Grade
- 5.1.1 Fertilizer Grade
- 5.1.2 Technical Grade
- 5.1.3 Feed Grade
- 5.2 By End-user Industry
- 5.2.1 Agriculture
- 5.2.2 Chemical
- 5.2.3 Automotive
- 5.2.4 Medical
- 5.2.5 Other End-user Industries
- 5.3 By Geography
- 5.3.1 Asia-Pacific
- 5.3.1.1 China
- 5.3.1.2 India
- 5.3.1.3 Japan
- 5.3.1.4 South Korea
- 5.3.1.5 ASEAN
- 5.3.1.6 Rest of Asia-Pacific
- 5.3.2 North America
- 5.3.2.1 United States
- 5.3.2.2 Canada
- 5.3.2.3 Mexico
- 5.3.3 Europe
- 5.3.3.1 Germany
- 5.3.3.2 France
- 5.3.3.3 United Kingdom
- 5.3.3.4 Italy
- 5.3.3.5 Russia
- 5.3.3.6 Rest of Europe
- 5.3.4 South America
- 5.3.4.1 Brazil
- 5.3.4.2 Argentina
- 5.3.4.3 Rest of South America
- 5.3.5 Middle-East and Africa
- 5.3.5.1 Saudi Arabia
- 5.3.5.2 South Africa
- 5.3.5.3 Rest of Middle-East and Africa
- 5.3.1 Asia-Pacific
6 Competitive Landscape
- 6.1 Market Concentration
- 6.2 Strategic Moves
- 6.3 Market Share (%)/Ranking Analysis
- 6.4 Company Profiles (includes Global level Overview, Market level overview, Core Segments, Financials as available, Strategic Information, Market Rank/Share for key companies, Products and Services, and Recent Developments)
- 6.4.1 Acron
- 6.4.2 BASF
- 6.4.3 CF Industries Holdings Inc.
- 6.4.4 Chambal Fertilisers & Chemicals Ltd
- 6.4.5 China National Petroleum Corporation (CNPC)
- 6.4.6 EuroChem Group
- 6.4.7 Genesis Fertilizers
- 6.4.8 IFFCO
- 6.4.9 Industries Qatar
- 6.4.10 Koch Fertilizer LLC
- 6.4.11 National Fertilizers Limited
- 6.4.12 Notore Chemical Industries PLC
- 6.4.13 Nutrien Ltd
- 6.4.14 OCI
- 6.4.15 Paradeep Phosphates Ltd
- 6.4.16 Petrobras
- 6.4.17 PT Pupuk Kalimantan Timur (PKT)
- 6.4.18 SABIC
- 6.4.19 The Chemical Company (TCC)
- 6.4.20 Uralchem JSC
- 6.4.21 Yara
7 Market Opportunities and Future Outlook
- 7.1 White-space and Unmet-Need Assessment


