


|
시장보고서
상품코드
1628729
북미의 원자로 폐기 : 시장 점유율 분석, 산업 동향 및 성장 예측(2025-2030년)North America Nuclear Power Reactor Decommissioning - Market Share Analysis, Industry Trends & Statistics, Growth Forecasts (2025 - 2030) |
||||||
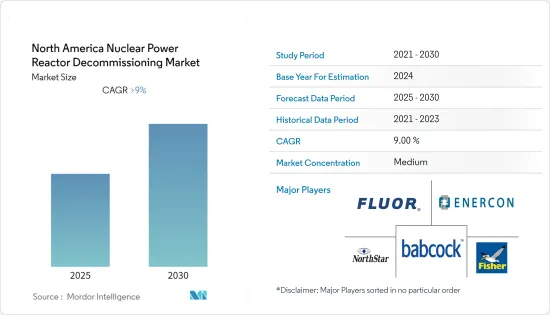
북미의 원자로 폐로 시장은 예측 기간 동안 9% 이상의 CAGR을 나타낼 것으로 예상됩니다.
2020년 코로나19 팬데믹으로 인해 시장은 부정적인 영향을 받았습니다. 현재 시장은 전염병 이전 수준에 도달했습니다.
주요 하이라이트
- 중기적으로는 가동 중단에 이르는 원자로 증가가 북미의 원자로 폐로 시장의 성장을 견인할 것으로 예상됩니다.
- 한편, 스트링 인버터의 기술적 단점은 예측 기간 동안 시장 성장에 걸림돌이 될 것으로 예상됩니다.
- 미국, 캐나다 등의 탈원전 정책은 예측 기간 동안 북미 탈원전 시장에 유리한 성장 기회를 제공할 가능성이 높습니다.
- 미국이 시장을 장악하고 있으며, 예측 기간 동안 가장 높은 CAGR을 기록할 가능성이 높습니다. 이러한 성장은 오래된 원자력 발전소의 폐로 증가에 기인합니다.
북미의 원자로 폐로 시장 동향
북미의 원자로 폐로 시장 동향상업용 동력로가 시장을 독점할 것으로 예상
- 상업용 원자로는 주로 전력 생산에 사용되는 원자로입니다. 이 원자로의 대부분은 원자력 발전소에 설치됩니다. 태양광과 풍력 등 재생 가능 에너지가 훨씬 저렴하고 깨끗하기 때문에 이러한 원자로 설치에 대한 수요가 증가하고 있습니다.
- 미국, 캐나다 등 이 지역 국가들은 노후화된 원자력 발전소의 폐로를 추진하고 있으며, 이는 예측 기간 동안 북미의 원자로 폐로 시장을 견인할 것으로 보입니다.
- 2021년 북미의 원자력 발전량은 923.0 테라와트시(TWh)로 2020년과 거의 동일한 940.1 TWh를 기록했습니다. 이 지역의 원자력 에너지 곡선이 둔화되거나 정체되어 있다는 것은 이 지역에서 원자로 폐로가 신규 원전 건설보다 더 많이 이루어지고 있음을 의미합니다.
- 지난 5월, Entergy Corporation은 미시간 호수에 위치한 파리세즈 원전을 폐쇄했습니다. 이 원전의 발전 용량은 80만kW였습니다. 연료는 원자로 용기에서 꺼내어 냉각을 위해 사용후핵연료 풀에 넣었습니다. 냉각 후 연료는 발전소 부지 내 안전한 독립 사용후핵연료 저장시설로 옮겨집니다. 이 회사는 또한 2041년까지 원전의 폐로를 완료하는 것을 목표로 하고 있습니다.
- 따라서 이러한 요인으로 인해 예측 기간 동안 상업용 원자로 부문이 북미의 원자로 폐로 시장을 독점할 가능성이 있습니다.
미국이 시장을 독식할 것으로 예상
- 미국은 2021년 세계 원자력 발전량의 약 30%를 차지하는 세계 최대 원자력 발전국입니다. 미국의 원자로는 2021년 778.15 테라와트시(TWh)의 전력을 생산할 것으로 예상되며, 이는 전년 대비 0.35% 소폭 증가한 수치입니다. 노후화된 원자력 발전소의 은퇴 준비는 원자로 폐로 시장을 견인할 것으로 보입니다.
- 2021년 미국 원자력 발전소의 발전량은 약 778.15테라와트시로 지난 10년간 최저치를 기록했으며, 원자로 수는 1990년 112기를 정점으로 감소하고 있습니다.
- 지난 10년간 저비용 셰일가스 발전과의 치열한 경쟁은 국내 원자력 발전 산업의 경쟁력을 떨어뜨렸습니다. 기록적으로 낮은 도매 전력 가격과 고비용 수명연장(PLEX) 업그레이드도 원전의 조기 퇴출로 이어지고 있습니다.
- 미국 내 원자력 발전의 시대가 막을 내리면서 원자력 발전소 폐로가 중요한 산업이 되고 있습니다. 비상장 회사가 이들 원전을 인수하고 라이선스, 책임, 폐로 자금, 폐기물 계약을 인수하고 있습니다. 총 용량 19.97GWe의 약 41기의 원자로가 가동 중단되었으며, 가장 최근에 가동이 중단된 원자로는 2022년 5월에 가동이 중단된 미시간주 패리세즈 원자로입니다.2021년 12월 Holtec International은 미시간주 코버트에 위치한 패리세즈 원자로를 인수하고 원자력 규제위원회로부터 폐로 및 해체 허가를 받았습니다. 원자력 규제위원회로부터 폐로 및 해체 허가를 받았으며, 2030년까지 198기의 원자로가 추가로 가동 중단될 것으로 예상됩니다.
- 미국의 원자로는 노후화가 진행되고 있습니다. 미국 원자력규제위원회(NRC)는 후속 라이선스 갱신(SLR) 프로그램을 통해 60-80년 이상 운전면허를 연장하는 신청을 검토하고 있습니다. 그러나 최근 일부 원전 소유주들은 45-50년 만에 조기 은퇴를 선택하기도 했습니다.
- 이러한 요인으로 인해 예측 기간 동안 미국이 북미의 원자로 폐로 시장을 독점할 것으로 예상됩니다.
북미의 원자로 폐로 산업 개요
북미의 원자로 해체 시장은 비교적 세분화되어 있습니다. 주요 업체로는 Babcock International Group PLC, NorthStar Group Services Inc., James Fisher & Sons PLC, Fluor Corporation, Enercon Services Inc. 등이 있습니다.
기타 혜택
- 엑셀 형식 시장 예측(ME) 시트
- 3개월간의 애널리스트 지원
목차
제1장 서론
- 조사 범위
- 시장의 정의
- 조사 전제
제2장 주요 요약
제3장 조사 방법
제4장 시장 개요
- 서론
- 2027년까지 시장 규모와 수요 예측(단위 : 100만 달러)
- 최근 동향과 개발
- 정부 규제와 시책
- 시장 역학
- 성장 촉진요인
- 성장 억제요인
- 공급망 분석
- Porter의 Five Forces 분석
- 공급 기업의 교섭력
- 소비자의 교섭력
- 신규 진출업체의 위협
- 대체품의 위협
- 경쟁 기업간 경쟁 관계
제5장 시장 세분화
- 원자로 유형
- 가압수형 원자로
- 가압수형 중수로
- 비등수형 원자로
- 고온 개스로
- 액체 금속 고속 증식로
- 기타 원자로
- 용도
- 상업용 동력로
- 원형로
- 연구노
- 원자로 용량
- 100 MW이하
- 100-1,000MW
- 1,000MW 이상
- 지역
- 미국
- 캐나다
- 기타 북미
제6장 경쟁 구도
- 합병, 인수, 제휴, 합병사업
- 주요 기업의 전략
- 기업 개요
- Babcock International Group PLC
- James Fisher & Sons PLC
- NorthStar Group Services Inc.
- Fluor Corporation
- Enercon Services Inc.
- Bechtel Group Inc.
- Orano Group
- Manafort Brothers Incorporated
- Cutting Technologies Inc.
제7장 시장 기회와 향후 동향
LSH 25.01.21The North America Nuclear Power Reactor Decommissioning Market is expected to register a CAGR of greater than 9% during the forecast period.

The market was negatively impacted by the COVID-19 pandemic in 2020. Presently, the market has reached pre-pandemic levels.
Key Highlights
- Over the medium term, an increasing number of nuclear reactors reaching operational retirement is expected to drive the growth of the nuclear power reactor decommissioning market in North America.
- On the other hand, technical drawbacks of string inverters are expected to hamper the growth of the market during the forecast period.
- Nuclear phase-out policies in countries such as the United States and Canada will likely create lucrative growth opportunities for the North American nuclear power reactor decommissioning market during the forecast period.
- The United States dominates the market and is likely to witness the highest CAGR during the forecast period. This growth is attributed to the increasing decommissioning of its old nuclear plants.
North America Nuclear Power Reactor Decommissioning Market Trends
Commercial Power Reactor Expected to Dominate the Market
- Commercial power reactors are nuclear reactors mainly used for generating electricity. Most of these reactors are being installed in nuclear power plants. Renewable energy from solar and wind is much cheaper and cleaner, thus increasing the demand for installing these reactors.
- The countries in the region, such as the United States and Canada, are decommissioning their old and outdated nuclear power plants, which may drive the North American nuclear power reactor decommissioning market during the forecast period.
- In 2021, North America's total electricity produced by nuclear energy was 923.0 terawatt-hours (TWh), almost the same as in 2020, i.e., 940.1 TWh. The slow-growing or flatness of the nuclear energy curve in the region shows that the nuclear power reactors' decommissioning will surpass the installation of new nuclear plants in the region.
- In May 2022, Entergy Corporation shut down its Palisades nuclear plant on Lake Michigan. The nuclear power plant had an 800 MW power generation capacity. The fuel was removed from the reactor's vessel and placed in the spent fuel pool to cool. After the cooling process, the fuel will be transported to the secured Independent Spent Fuel Storage Facility on the station property. The company also aims to complete the decommissioning of the nuclear plant by 2041.
- Hence, due to such factors, the commercial power reactor sector may dominate the North American nuclear power reactor decommissioning market during the forecast period.
United States Expected to Dominate the Market
- The United States is one of the largest nuclear power producers globally, accounting for almost 30% of the global nuclear power generated in 2021. The country's nuclear reactors produced 778.15 terawatt hours (TWh) of electricity in 2021, representing a slight increase of 0.35% over the previous year's value. The ready-to-retire old nuclear plants are likely to drive the nuclear power reactor decommissioning market.
- In 2021, nuclear power plants in the United States generated around 778.15 terawatt hours of electricity, the lowest output recorded in one decade. The number of nuclear power reactors has been decreasing since 1990, when it peaked at 112 units.
- Over the past decade, intense competition from electricity generation using low-cost shale gas has hurt the competitiveness of the country's nuclear power industry. Record low wholesale electricity prices and the high cost of life extension (PLEX) upgrades have also led to early nuclear plant retirements.
- As the era of nuclear power in the United States comes to an end, the decommissioning of nuclear power plants is becoming a significant industry. Private companies are acquiring these plants, taking over their licenses, liability, decommissioning funds, and waste contracts. Around 41 reactors with a combined capacity of 19.97 GWe were shut down, with the latest being the Palisades nuclear plant in Michigan, which shut down in May 2022. In December 2021, HoltecInternational received approval from the Nuclear Regulatory Commission to acquire the Palisades plant in Covert, Michigan, to decommission and dismantle the plant. An additional 198 reactors are expected to shut down by 2030.
- The nuclear reactor fleet of the United States is now aging. The US Nuclear Regulatory Commission (NRC) is considering applications for extending operating licenses beyond 60-80 years with its subsequent license renewal (SLR) program. However, some plant owners recently opted for early retirements of their nuclear units at 45-50 years.
- Hence, due to such factors, the United States is expected to dominate the North American nuclear power reactor decommissioning market during the forecast period.
North America Nuclear Power Reactor Decommissioning Industry Overview
The North American nuclear power reactor decommissioning market is moderately fragmented in nature. Some of the major players in the market (in no particular order) include Babcock International Group PLC, NorthStar Group Services Inc., James Fisher & Sons PLC, Fluor Corporation, and Enercon Services Inc.
Additional Benefits:
- The market estimate (ME) sheet in Excel format
- 3 months of analyst support
TABLE OF CONTENTS
1 INTRODUCTION
- 1.1 Scope of the Study
- 1.2 Market Definition
- 1.3 Study Assumptions
2 EXECUTIVE SUMMARY
3 RESEARCH METHODOLOGY
4 MARKET OVERVIEW
- 4.1 Introduction
- 4.2 Market Size and Demand Forecast in USD million, till 2027
- 4.3 Recent Trends and Developments
- 4.4 Government Policies and Regulations
- 4.5 Market Dynamics
- 4.5.1 Drivers
- 4.5.2 Restraints
- 4.6 Supply Chain Analysis
- 4.7 Porter's Five Forces Analysis
- 4.7.1 Bargaining Power of Suppliers
- 4.7.2 Bargaining Power of Consumers
- 4.7.3 Threat of New Entrants
- 4.7.4 Threat of Substitutes Products and Services
- 4.7.5 Intensity of Competitive Rivalry
5 MARKET SEGMENTATION
- 5.1 Reactor Type
- 5.1.1 Pressurized Water Reactor
- 5.1.2 Pressurized Heavy Water Reactor
- 5.1.3 Boiling Water Reactor
- 5.1.4 High-temperature Gas-cooled Reactor
- 5.1.5 Liquid Metal Fast Breeder Reactor
- 5.1.6 Other Reactor Types
- 5.2 Applications
- 5.2.1 Commercial Power Reactor
- 5.2.2 Prototype Power Reactor
- 5.2.3 Research Reactor
- 5.3 Capacity
- 5.3.1 Below 100 MW
- 5.3.2 100-1000 MW
- 5.3.3 Above 1000 MW
- 5.4 Geography
- 5.4.1 United States
- 5.4.2 Canada
- 5.4.3 Rest of North America
6 COMPETITIVE LANDSCAPE
- 6.1 Mergers, Acquisitions, Collaborations, and Joint Ventures
- 6.2 Strategies Adopted by Key Players
- 6.3 Company Profiles
- 6.3.1 Babcock International Group PLC
- 6.3.2 James Fisher & Sons PLC
- 6.3.3 NorthStar Group Services Inc.
- 6.3.4 Fluor Corporation
- 6.3.5 Enercon Services Inc.
- 6.3.6 Bechtel Group Inc.
- 6.3.7 Orano Group
- 6.3.8 Manafort Brothers Incorporated
- 6.3.9 Cutting Technologies Inc.
