


|
시장보고서
상품코드
1630376
동유럽의 재생에너지 : 시장 점유율 분석, 산업 동향 및 통계, 성장 예측(2025-2030년)East Europe Renewable Energy - Market Share Analysis, Industry Trends & Statistics, Growth Forecasts (2025 - 2030) |
||||||
■ 보고서에 따라 최신 정보로 업데이트하여 보내드립니다. 배송일정은 문의해 주시기 바랍니다.
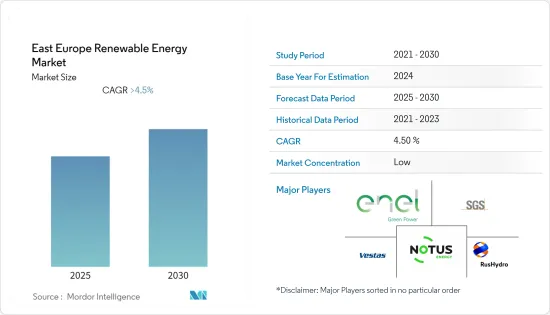
동유럽의 재생에너지 시장은 예측 기간 동안 4.5% 이상의 CAGR을 기록할 것으로 예상됩니다.
COVID-19는 2020년 시장에 약간의 영향을 미쳤습니다. 현재 시장은 전염병 이전 수준에 도달했습니다.
주요 하이라이트
- 중기적으로는 환경 의식과 규제 강화, 발전량 1kW당 비용 감소 등의 요인이 시장을 견인할 것으로 예상됩니다.
- 한편, 태양전지와 풍력에너지 저장장치의 높은 가격이 시장을 억제할 것으로 예상됩니다.
- 태양전지에 카드뮴 텔루르화 카드뮴 박막 코팅을 사용하는 박막 기술로 만든 새로운 태양전지 모델은 효율이 높고 비용이 저렴하기 때문에 이 부문의 기회가 될 수 있습니다.
- 러시아는 예측 기간 동안 이 지역의 재생에너지 시장을 독점할 것으로 예상됩니다. 재생에너지 프로젝트에 대한 투자가 크게 증가하고 있기 때문입니다.
동유럽의 재생에너지 시장 동향
시장을 독점하는 수력발전 부문
- 수력발전 부문은 미국과의 역사적 관계로 인해 동유럽 전역에 방대한 댐 저수지가 건설되고 있어 시장을 독점할 것으로 예상됩니다. 대부분의 댐은 러시아에 건설되고 있습니다.
- 수력발전 부문에는 재생에너지 공급에 사용할 수 있는 다양한 규모의 저수지 댐이 포함됩니다. 수력발전은 동유럽에서 가장 많이 사용되는 재생에너지입니다.
- 폴란드 정부는 2022년 1월, 착공 50년 만에, 프로젝트가 중단된 지 33년 만에 폴란드 최대 규모의 수력발전소 건설을 재개한다고 발표했습니다. 발전소 용량은 750MW이며 폴란드 남서부 무르티 마을에 건설될 예정입니다.
- 수력발전(혼합 발전소 포함)은 2021년에 이 지역에서 생산되는 전체 재생에너지의 약 72.7%를 차지하며, 약 7만 4,101MW의 에너지를 생산할 것입니다.
- 따라서 재생에너지를 공급하는 대규모 댐 저수지는 다른 재생에너지에 비해 규모가 크고, 유지보수가 지속적이며, 투자 증가가 적기 때문에 시장을 독점할 것으로 예상됩니다.
시장을 독점하고 있는 러시아
- 2021년 러시아 전력의 18% 이상이 러시아 수력발전소에서 생산되며, 러시아는 발전량을 크게 늘릴 수 있는 미개발 자원을 풍부하게 보유하고 있습니다.
- 이 나라의 재생에너지의 대부분은 수력발전 프로젝트를 통해 생산되며, 2021년 재생에너지 용량은 5,620 만 kW에 달했습니다. 전체 재생에너지 시장에는 태양 에너지 부문의 새로운 프로젝트가 추가될 것으로 예상됩니다.
- 러시아 최대 수력발전소인 사야노 슈셴스카야 수력발전소는 하카시야주 사야노골스크의 예니세이 강에 위치해 있습니다. 발전소 높이 242미터의 아치형 중력식 댐의 설비용량은 6.4GW에 달합니다. 이 수력발전 프로젝트는 러시아 중부와 동부 지역에 풍부한 전력 공급을 제공하고 있습니다.
- 따라서 예측 기간 동안 러시아는 광활한 국토와 재생에너지 설비용량 증가로 인해 시장을 독식할 것으로 예상됩니다.
- 그러나 러시아와 우크라이나 분쟁이 발발한 후 러시아는 거의 모든 외국 기업이 철수했기 때문에 재생에너지 포트폴리오가 크게 성장하지 않을 것으로 예상됩니다.
동유럽의 재생에너지 산업 개요
동유럽의 재생에너지 시장은 부분적으로 세분화되어 있습니다. 이 시장의 주요 기업으로는 PJSC RusHydro, Vestas Wind Systems A/S, Enel Green Power S.p.A., NOTUS Energy GmbH, SGS SA 등이 있습니다.
기타 혜택
- 엑셀 형식의 시장 예측(ME) 시트
- 3개월간의 애널리스트 지원
목차
제1장 소개
- 조사 범위
- 시장 정의
- 조사 가정
제2장 조사 방법
제3장 주요 요약
제4장 시장 개요
- 소개
- 2027년까지 재생에너지 설비 용량 예측(단위 : GW)
- 최근 동향과 개발
- 정부 규제와 시책
- 시장 역학
- 성장 촉진요인
- 성장 억제요인
- 공급망 분석
- Porter's Five Forces 분석
- 공급 기업의 교섭력
- 소비자의 협상력
- 신규 참여업체의 위협
- 대체품의 위협
- 경쟁 기업 간의 경쟁 관계
제5장 시장 세분화
- 유형
- 수력발전
- 태양광발전
- 기타
- 지역
- 러시아
- 폴란드
- 우크라이나
- 기타
제6장 경쟁 구도
- M&A, 합작투자, 제휴, 협정
- 주요 기업의 전략
- 기업 개요
- Vestas Wind Systems A/S
- Enel Green Power S.p.A.
- NOTUS Energy GmbH
- SGS SA
- Wartsila Oyj Abp
- Hanwha Q Cells Co., Ltd.
- Schneider Electric SE
- C&C Energy SRL
- Federal Hydro-Generating Co RusHydro PAO
제7장 시장 기회와 향후 동향
ksm 25.01.23The East Europe Renewable Energy Market is expected to register a CAGR of greater than 4.5% during the forecast period.

COVID-19 marginally impacted the market in 2020. Presently the market has reached pre-pandemic levels.
Key Highlights
- Over the medium term, factors such as increased environmental awareness and regulations and decreased cost per kilowatt of electricity generated are expected to boost the market.
- On the other hand, the high price of solar and wind energy storage is expected to restrain the market.
- Nevertheless, new models of solar cells made of a thin film technology that uses thin coatings of cadmium telluride in solar cells, which have higher efficiency and lower cost, may prove to be an opportunity in the sector.
- Russia is expected to dominate the renewable energy market during the forecast period in the region. Due to a significant rise in investment in renewable energy projects.
East Europe Renewable Energy Market Trends
Hydropower Segment to Dominate the Market
- The hydropower segment is expected to dominate the market as a vast reservoir of dams has been built across east Europe due to its history with U.S.S.R. It is expected to remain the largest renewable energy segment in the forecast period. Most of the dams have been constructed in Russia.
- The hydropower Segment includes different-sized reservoir dams that can be used to provide renewable energy. Hydropower is the most used renewable energy in East Europe.
- In January 2022, the Polish government announced that work would be resumed on the country's largest hydroelectric plant 50 years after construction began and 33 years after the project was abandoned. The plant will have a capacity of 750 MW and will be located in the village of Mloty, southwestern Poland.
- Hydropower (including mixed plants) constitute almost 72.7%of the total renewable energy generated in the region, with nearly 74,101 MW of energy being produced, in 2021.
- Therefore, vast reservoirs of dams providing renewable energy are expected to dominate the market due to their large size relative to other renewable energy, a continuation of maintenance, and little increase in investments.
Russia to Dominate the Market
- In 2021, more than 18% of Russia's electricity is produced by Russia's hydroelectric power plants, with the country holding a wealth of untapped resources to increase its output significantly.
- Most of the renewable energy in the country is produced by hydropower projects. In 2021, the country's renewable energy capacity stood at 56.2 GW. New projects in the solar energy sector are expected to be added to the total renewable energy market.
- The biggest hydropower plant in Russia, the Sayano-Shushenskaya hydroelectric power plant, is located on the Yenisei River in Sayanogorsk, Khakassia. The power station's 242m-high arch-gravity dam has an installed capacity of 6.4GW. The hydro project provides plentiful electricity supply in the Central and East regions of the country.
- Hence, Russia is expected to dominate the market due to its large size and increased renewable energy installed capacity in the forecast period.
- However, after the outbreak of the Russia-Ukraine conflict, Russia is not expected to witness any significant growth in its renewable energy portfolio as almost all of the foreign companies have exited the country.
East Europe Renewable Energy Industry Overview
East Europe Renewable Energy Market is partially fragmented. Some of the key players in this market are (not in particular order) PJSC RusHydro, Vestas Wind Systems A/S, Enel Green Power S.p.A., NOTUS Energy GmbH, and SGS SA.
Additional Benefits:
- The market estimate (ME) sheet in Excel format
- 3 months of analyst support
TABLE OF CONTENTS
1 INTRODUCTION
- 1.1 Scope of the Study
- 1.2 Market Definition
- 1.3 Study Assumptions
2 RESEARCH METHODOLOGY
3 EXECUTIVE SUMMARY
4 MARKET OVERVIEW
- 4.1 Introduction
- 4.2 Renewable Energy Installed Capacity Forecast in GW, till 2027
- 4.3 Recent Trends and Developments
- 4.4 Government Policies and Regulations
- 4.5 Market Dynamics
- 4.5.1 Drivers
- 4.5.2 Restraints
- 4.6 Supply Chain Analysis
- 4.7 Porter's Five Forces Analysis
- 4.7.1 Bargaining Power of Suppliers
- 4.7.2 Bargaining Power of Consumers
- 4.7.3 Threat of New Entrants
- 4.7.4 Threat of Substitutes Products and Services
- 4.7.5 Intensity of Competitive Rivalry
5 MARKET SEGMENTATION
- 5.1 Type
- 5.1.1 Hydropower
- 5.1.2 Solar
- 5.1.3 Others
- 5.2 Geography
- 5.2.1 Russia
- 5.2.2 Poland
- 5.2.3 Ukraine
- 5.2.4 Others
6 COMPETITIVE LANDSCAPE
- 6.1 Mergers and Acquisitions, Joint Ventures, Collaborations, and Agreements
- 6.2 Strategies Adopted by Leading Players
- 6.3 Company Profiles
- 6.3.1 Vestas Wind Systems A/S
- 6.3.2 Enel Green Power S.p.A.
- 6.3.3 NOTUS Energy GmbH
- 6.3.4 SGS SA
- 6.3.5 Wartsila Oyj Abp
- 6.3.6 Hanwha Q Cells Co., Ltd.
- 6.3.7 Schneider Electric SE
- 6.3.8 C&C Energy SRL
- 6.3.9 Federal Hydro-Generating Co RusHydro PAO
7 MARKET OPPORTUNITIES AND FUTURE TRENDS


샘플 요청 목록