|
시장보고서
상품코드
1803912
재생에너지 시장 : 재생에너지 유형, 용도, 투자 유형, 기업 유형, 지역별 - 산업 동향과 세계 예측(-2035년)Renewable Energy Market, Till 2035: Distribution by Type of Renewable Energy, Type of Application, Type of Investment, Type of Enterprise and Geographical Regions: Industry Trends and Global Forecasts |
||||||
재생에너지 : 시장 개요
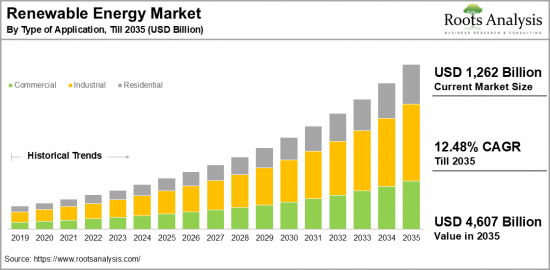
세계의 재생에너지 시장 규모는 예측 기간 중 CAGR 12.48%로 추이하며, 현재 1조 2,620억 달러에서 2035년에는 4조 6,070억 달러로 성장할 것으로 예측됩니다.
재생에너지 시장 기회: 분류
재생에너지 유형
- 바이오에너지
- 지열
- 수력발전
- 태양광발전
- 풍력발전
- 기타
용도
- 상업용
- 산업용
- 주거용
투자 유형
- 정부투자 프로젝트
- 민간투자
- 민관 파트너십
지역
- 북미
- 미국
- 캐나다
- 멕시코
- 기타
- 유럽
- 오스트리아
- 벨기에
- 덴마크
- 프랑스
- 독일
- 아일랜드
- 이탈리아
- 네덜란드
- 노르웨이
- 러시아
- 스페인
- 스웨덴
- 스위스
- 영국
- 기타
- 아시아
- 중국
- 인도
- 일본
- 싱가포르
- 한국
- 기타
- 라틴아메리카
- 브라질
- 칠레
- 콜롬비아
- 베네수엘라
- 기타
- 중동 및 북아프리카
- 이집트
- 이란
- 이라크
- 이스라엘
- 쿠웨이트
- 사우디아라비아
- 아랍에미리트
- 기타 중동 및 북아프리카 국가
- 세계 기타 지역
- 호주
- 뉴질랜드
- 기타
재생에너지 시장 : 성장과 동향
세계경제포럼에 따르면 세계는 재생에너지 설비 용량을 크게 확대하고 있으며, 이는 재생에너지 발전 증가를 보여줍니다. 재생에너지 발전은 화석연료에 대한 의존도를 줄이고 기후 변화에 대응하는 효과적인 수단임이 입증되었습니다. 재생에너지는 태양광, 풍력, 수력, 바이오매스 등 다양한 자원에서 얻을 수 있으며, 이를 이용해 온실가스를 배출하지 않고 발전할 수 있다는 점에서 매우 중요합니다.
재생에너지의 주요 장점은 지속가능한 에너지원이라는 점, 대기 및 수질 정화에 기여한다는 점, 비용 효율적인 발전이 가능하다는 점 등을 들 수 있습니다. 특히 재생에너지 기술의 급속한 발전과 사회적 인식이 높아짐에 따라 주요 산업에서 태양광 에너지의 이용이 크게 증가하고 있으며, 풍력에너지도 그 뒤를 이어 확대되고 있습니다. 주목할 만한 점은 인도의 2024년 1분기 태양광발전량이 전년 동기 대비 8.8% 증가했다는 점입니다.
재생에너지 분야는 지속가능한 혁신과 디지털 발전을 통해 에너지 생산량을 늘리기 위한 세계 전환에 필수적인 요소로 자리 잡고 있습니다. 해상풍력발전소 개발은 더욱 강력하고 안정적인 바람을 활용하고 있습니다. 또한 페로브스카이트 태양전지는 기존 실리콘 패널에 비해 고효율, 저비용으로 제조할 수 있으며, 태양광발전 분야에 큰 변화를 가져와 세계 재생에너지 시장의 효율성 향상에 기여하고 있습니다.
이처럼 AI와 IoT의 도입을 포함한 재생에너지 기술의 지속적인 발전으로 재생에너지 시장은 예측 기간 중 큰 성장을 이룰 것으로 예측됩니다.
세계의 재생에너지 시장을 조사했으며, 시장 개요, 배경, 시장 영향요인의 분석, 시장 규모 추이·예측, 각종 구분·지역별 상세 분석, 경쟁 구도, 주요 기업의 개요 등을 정리하여 전해드립니다.
목차
섹션 I : 리포트 개요
제1장 서문
제2장 조사 방법
제3장 시장 역학
제4장 거시경제 지표
섹션 II : 정성적 인사이트
제5장 개요
제6장 서론
제7장 규제 시나리오
섹션 III : 시장 개요
제8장 주요 기업의 종합적 데이터베이스
제9장 경쟁 구도
제10장 화이트 스페이스 분석
제11장 기업 경쟁력 분석
제12장 재생에너지 시장에서의 스타트업 에코시스템
섹션 IV : 기업 개요
제13장 기업 개요
- 챕터 개요
- ABB
- Acconia
- Canadian Solar
- EDP Renovaveis
- Enel Spa
- Engie
- General Electric
- Iberdrola
- Innergex
- Invenergy
- National Grid Renewables
- NextEra Energy
- Orsted
- Schneider Electric
- Siemens
- Suzlon Energy
- Tata Power
- Xcel Energy
섹션 V : 시장 동향
제14장 메가트렌드 분석
제15장 미충족 요구 분석
제16장 특허 분석
제17장 최근 동향
섹션 VI : 시장 기회 분석
제18장 세계의 재생에너지 시장
제19장 재생에너지 유형별 시장 기회
제20장 용도별 시장 기회
제21장 투자 유형별 시장 기회
제22장 기업 규모별 시장 기회
제23장 북미에서 재생에너지의 시장 기회
제24장 유럽에서 재생에너지의 시장 기회
제25장 아시아에서 재생에너지의 시장 기회
제26장 중동·북아프리카에서 재생에너지의 시장 기회
제27장 라틴아메리카에서 재생에너지의 시장 기회
제28장 세계의 기타 지역에서 재생에너지의 시장 기회
제29장 시장 집중 분석 : 주요 기업별 분포
제30장 인접 시장 분석
섹션 VII : 전략 툴
제31장 주요 승리 전략
제32장 Porter's Five Forces 분석
제33장 SWOT 분석
제34장 밸류체인 분석
제35장 ROOTS 전략 제안
섹션 VIII : 기타 독점적 인사이트
제36장 1차 조사로부터의 인사이트
제37장 보고서 결론
섹션 IX : 부록
제38장 표형식 데이터
제39장 기업·단체 리스트
제40장 커스터마이즈 기회
제41장 ROOTS 서브스크립션 서비스
제42장 저자 상세
KSA 25.09.11Renewable Energy Market Overview
As per Roots Analysis, the global renewable energy market size is estimated to grow from USD 1,262 billion in the current year to USD 4,607 billion by 2035, at a CAGR of 12.48% during the forecast period, till 2035.

The opportunity for renewable energy market has been distributed across the following segments:
Type of Renewable Energy
- Bio Energy
- Geothermal
- Hydroelectric Power
- Solar Power
- Wind Power
- Others
Type of Application
- Commercial
- Industrial
- Residential
Type of Investment
- Government-funded projects
- Private sector investments
- Public-private partnerships
Geographical Regions
- North America
- US
- Canada
- Mexico
- Other North American countries
- Europe
- Austria
- Belgium
- Denmark
- France
- Germany
- Ireland
- Italy
- Netherlands
- Norway
- Russia
- Spain
- Sweden
- Switzerland
- UK
- Other European countries
- Asia
- China
- India
- Japan
- Singapore
- South Korea
- Other Asian countries
- Latin America
- Brazil
- Chile
- Colombia
- Venezuela
- Other Latin American countries
- Middle East and North Africa
- Egypt
- Iran
- Iraq
- Israel
- Kuwait
- Saudi Arabia
- UAE
- Other MENA countries
- Rest of the World
- Australia
- New Zealand
- Other countries
Renewable Energy Market: Growth and Trends
According to the World Economic Forum, the world has significantly increased its renewable energy capacity, which indicates the rise of renewable energy generation, that has proven to be an effective way to lessen dependency on fossil fuels and combat climate change. It is important to note that renewable energy comes from various sources, such as sunlight, wind, water, and biomass, and using these resources generates electricity without producing greenhouse gas emissions.
Some key benefits of renewable energy include being a sustainable energy source, contributing to cleaner air and water, and providing cost-efficient power generation. Notably, there is a significant increase in the use of solar energy in major industries driven by the rapid advancement of renewable technologies and growing public awareness, with wind energy also following closely behind. Interestingly, India experienced a notable increase of 8.8% in total solar power generation in the first quarter of 2024 compared to the previous year.
The renewable energy sector is becoming an essential element in the global transition towards sustainable innovation and digital progress to achieve heightened energy production. The development of offshore wind farms is gaining momentum, making use of stronger and more steady wind patterns. Furthermore, perovskite solar cells are transforming the solar energy landscape by providing greater efficiency and reduced manufacturing costs compared to conventional silicon panels, which is crucial for enhancing the efficiency of the global renewable energy market analysis.
As a result, with ongoing advancements in renewable energy technology, including the incorporation of artificial intelligence and the Internet of Things (IoT), the renewable energy market is expected to experience significant growth during this forecast period.
Renewable Energy Market: Key Segments
Market Share by Type of Renewable Energy
Based on the type of renewable energy, the global renewable energy market is segmented into bio energy, geothermal, hydroelectric power, solar power, wind power and others. According to our estimates, currently, solar power segment captures the majority share of the market.
Additionally, this sector is anticipated to grow at a relatively higher CAGR during the forecast period. This can be attributed to several factors, including decreasing costs, technological advancements that improve efficiency and accessibility, and its established presence in countries like the US and China.
Market Share by Type of Application
Based on the type of application, the renewable energy market is segmented into commercial, industrial and residential. According to our estimates, currently, the industrial sector captures the majority of the market. Additionally, this sector is anticipated to grow at a relatively higher CAGR during the forecast period. This can be attributed to the increasing demand for renewable energy sources from industrial players aiming to lower carbon emissions and cut operational expenses, along with technological advancements.
Market Share by Type of Investment
Based on type of investment, the renewable energy market is segmented into government-funded projects, private sector investments and public-private partnerships. According to our estimates, currently, private sector investments segment captures the majority share of the market. Additionally, this sector is anticipated to grow at a relatively higher CAGR during the forecast period.
This can be attributed to the technological advancements in renewable energy that have significantly reduced costs; further, private sector investments tend to be more agile and responsive to market needs compared to government-funded initiatives.
Market Share by Type of Enterprise
Based on type of enterprise, the renewable energy market is segmented into large and small and medium enterprise. According to our estimates, currently, large-scale farms captures the majority share of the market. Additionally, this sector is anticipated to grow at a relatively higher CAGR during the forecast period. This can be attributed to its ability to invest in state-of-the-art renewable energy generation technologies and methods, take advantage of government programs, enhance economies of scale, and promote business expansion.
Market Share by Geographical Regions
Based on geographical regions, the renewable energy market is segmented into North America, Europe, Asia, Latin America, Middle East and North Africa, and Rest of the World. According to our estimates, currently, Asia captures the majority share of the market. Additionally, this market in this region is anticipated to grow at a relatively higher CAGR during the forecast period. This can be attributed to abundant capacity for solar and wind energy, supportive government policies and investments, rapid population growth, and escalated energy demand in nations such as China and India.
Example Players in Renewable Energy Market
- ABB
- Acconia
- Canadian Solar
- EDP Renovaveis
- Enel Spa
- Engie
- General Electric
- Iberdrola
- Innergex
- Invenergy
- National Grid Renewables
- NextEra Energy
- Orsted
- Schneider Electric
- Siemens
- Suzlon Energy
- Tata Power
- Xcel Energy
Renewable Energy Market: Research Coverage
The report on the renewable energy market features insights on various sections, including:
- Market Sizing and Opportunity Analysis: An in-depth analysis of the renewable energy market, focusing on key market segments, including [A] type of renewable energy, [B] type of application, [C] type of investment, [D] types of enterprise [E] geographical regions.
- Competitive Landscape: A comprehensive analysis of the companies engaged in the renewable energy market, based on several relevant parameters, such as [A] year of establishment, [B] company size, [C] location of headquarters and [D] ownership structure.
- Company Profiles: Elaborate profiles of prominent players engaged in the renewable energy market, providing details on [A] location of headquarters, [B]company size, [C] company mission, [D] company footprint, [E] management team, [F] contact details, [G] financial information, [H] operating business segments, [I] renewable energy portfolio, [J] moat analysis, [K] recent developments, and an informed future outlook.
- Megatrends: An evaluation of ongoing megatrends in renewable energy industry.
- Patent Analysis: An insightful analysis of patents filed / granted in the Renewable energy domain, based on relevant parameters, including [A] type of patent, [B] patent publication year, [C] patent age and [D] leading players.
- Recent Developments: An overview of the recent developments made in the renewable energy market, along with analysis based on relevant parameters, including [A] year of initiative, [B] type of initiative, [C] geographical distribution and [D] most active players.
- Porter's Five Forces Analysis: An analysis of five competitive forces prevailing in the renewable energy market, including threats of new entrants, bargaining power of buyers, bargaining power of suppliers, threats of substitute products and rivalry among existing competitors.
- SWOT Analysis: An insightful SWOT framework, highlighting the strengths, weaknesses, opportunities and threats in the domain. Additionally, it provides Harvey ball analysis, highlighting the relative impact of each SWOT parameter.
Key Questions Answered in this Report
- How many companies are currently engaged in renewable energy market?
- Which are the leading companies in this market?
- What factors are likely to influence the evolution of this market?
- What is the current and future market size?
- What is the CAGR of this market?
- How is the current and future market opportunity likely to be distributed across key market segments?
Reasons to Buy this Report
- The report provides a comprehensive market analysis, offering detailed revenue projections of the overall market and its specific sub-segments. This information is valuable to both established market leaders and emerging entrants.
- Stakeholders can leverage the report to gain a deeper understanding of the competitive dynamics within the market. By analyzing the competitive landscape, businesses can make informed decisions to optimize their market positioning and develop effective go-to-market strategies.
- The report offers stakeholders a comprehensive overview of the market, including key drivers, barriers, opportunities, and challenges. This information empowers stakeholders to stay abreast of market trends and make data-driven decisions to capitalize on growth prospects.
Additional Benefits
- Complimentary Excel Data Packs for all Analytical Modules in the Report
- 10% Free Content Customization
- Detailed Report Walkthrough Session with Research Team
- Free Updated report if the report is 6-12 months old or older
TABLE OF CONTENTS
SECTION I: REPORT OVERVIEW
1. PREFACE
- 1.1. Introduction
- 1.2. Market Share Insights
- 1.3. Key Market Insights
- 1.4. Report Coverage
- 1.5. Key Questions Answered
- 1.6. Chapter Outlines
2. RESEARCH METHODOLOGY
- 2.1. Chapter Overview
- 2.2. Research Assumptions
- 2.3. Database Building
- 2.3.1. Data Collection
- 2.3.2. Data Validation
- 2.3.3. Data Analysis
- 2.4. Project Methodology
- 2.4.1. Secondary Research
- 2.4.1.1. Annual Reports
- 2.4.1.2. Academic Research Papers
- 2.4.1.3. Company Websites
- 2.4.1.4. Investor Presentations
- 2.4.1.5. Regulatory Filings
- 2.4.1.6. White Papers
- 2.4.1.7. Industry Publications
- 2.4.1.8. Conferences and Seminars
- 2.4.1.9. Government Portals
- 2.4.1.10. Media and Press Releases
- 2.4.1.11. Newsletters
- 2.4.1.12. Industry Databases
- 2.4.1.13. Roots Proprietary Databases
- 2.4.1.14. Paid Databases and Sources
- 2.4.1.15. Social Media Portals
- 2.4.1.16. Other Secondary Sources
- 2.4.2. Primary Research
- 2.4.2.1. Introduction
- 2.4.2.2. Types
- 2.4.2.2.1. Qualitative
- 2.4.2.2.2. Quantitative
- 2.4.2.3. Advantages
- 2.4.2.4. Techniques
- 2.4.2.4.1. Interviews
- 2.4.2.4.2. Surveys
- 2.4.2.4.3. Focus Groups
- 2.4.2.4.4. Observational Research
- 2.4.2.4.5. Social Media Interactions
- 2.4.2.5. Stakeholders
- 2.4.2.5.1. Company Executives (CXOs)
- 2.4.2.5.2. Board of Directors
- 2.4.2.5.3. Company Presidents and Vice Presidents
- 2.4.2.5.4. Key Opinion Leaders
- 2.4.2.5.5. Research and Development Heads
- 2.4.2.5.6. Technical Experts
- 2.4.2.5.7. Subject Matter Experts
- 2.4.2.5.8. Scientists
- 2.4.2.5.9. Doctors and Other Healthcare Providers
- 2.4.2.6. Ethics and Integrity
- 2.4.2.6.1. Research Ethics
- 2.4.2.6.2. Data Integrity
- 2.4.3. Analytical Tools and Databases
- 2.4.1. Secondary Research
3. MARKET DYNAMICS
- 3.1. Forecast Methodology
- 3.1.1. Top-Down Approach
- 3.1.2. Bottom-Up Approach
- 3.1.3. Hybrid Approach
- 3.2. Market Assessment Framework
- 3.2.1. Total Addressable Market (TAM)
- 3.2.2. Serviceable Addressable Market (SAM)
- 3.2.3. Serviceable Obtainable Market (SOM)
- 3.2.4. Currently Acquired Market (CAM)
- 3.3. Forecasting Tools and Techniques
- 3.3.1. Qualitative Forecasting
- 3.3.2. Correlation
- 3.3.3. Regression
- 3.3.4. Time Series Analysis
- 3.3.5. Extrapolation
- 3.3.6. Convergence
- 3.3.7. Forecast Error Analysis
- 3.3.8. Data Visualization
- 3.3.9. Scenario Planning
- 3.3.10. Sensitivity Analysis
- 3.4. Key Considerations
- 3.4.1. Demographics
- 3.4.2. Market Access
- 3.4.3. Reimbursement Scenarios
- 3.4.4. Industry Consolidation
- 3.5. Robust Quality Control
- 3.6. Key Market Segmentations
- 3.7. Limitations
4. MACRO-ECONOMIC INDICATORS
- 4.1. Chapter Overview
- 4.2. Market Dynamics
- 4.2.1. Time Period
- 4.2.1.1. Historical Trends
- 4.2.1.2. Current and Forecasted Estimates
- 4.2.2. Currency Coverage
- 4.2.2.1. Overview of Major Currencies Affecting the Market
- 4.2.2.2. Impact of Currency Fluctuations on the Industry
- 4.2.3. Foreign Exchange Impact
- 4.2.3.1. Evaluation of Foreign Exchange Rates and Their Impact on Market
- 4.2.3.2. Strategies for Mitigating Foreign Exchange Risk
- 4.2.4. Recession
- 4.2.4.1. Historical Analysis of Past Recessions and Lessons Learnt
- 4.2.4.2. Assessment of Current Economic Conditions and Potential Impact on the Market
- 4.2.5. Inflation
- 4.2.5.1. Measurement and Analysis of Inflationary Pressures in the Economy
- 4.2.5.2. Potential Impact of Inflation on the Market Evolution
- 4.2.6. Interest Rates
- 4.2.6.1. Overview of Interest Rates and Their Impact on the Market
- 4.2.6.2. Strategies for Managing Interest Rate Risk
- 4.2.7. Commodity Flow Analysis
- 4.2.7.1. Type of Commodity
- 4.2.7.2. Origins and Destinations
- 4.2.7.3. Values and Weights
- 4.2.7.4. Modes of Transportation
- 4.2.8. Global Trade Dynamics
- 4.2.8.1. Import Scenario
- 4.2.8.2. Export Scenario
- 4.2.9. War Impact Analysis
- 4.2.9.1. Russian-Ukraine War
- 4.2.9.2. Israel-Hamas War
- 4.2.10. COVID Impact / Related Factors
- 4.2.10.1. Global Economic Impact
- 4.2.10.2. Industry-specific Impact
- 4.2.10.3. Government Response and Stimulus Measures
- 4.2.10.4. Future Outlook and Adaptation Strategies
- 4.2.11. Other Indicators
- 4.2.11.1. Fiscal Policy
- 4.2.11.2. Consumer Spending
- 4.2.11.3. Gross Domestic Product (GDP)
- 4.2.11.4. Employment
- 4.2.11.5. Taxes
- 4.2.11.6. R&D Innovation
- 4.2.11.7. Stock Market Performance
- 4.2.11.8. Supply Chain
- 4.2.11.9. Cross-Border Dynamics
- 4.2.1. Time Period
SECTION II: QUALITATIVE INSIGHTS
5. EXECUTIVE SUMMARY
6. INTRODUCTION
- 6.1. Chapter Overview
- 6.2. Overview of Renewable Energy Market
- 6.2.1. Type of Renewable Energy
- 6.2.2. Type of Application
- 6.2.3. Type of Investment
- 6.2.4. Type of Enterprise
- 6.3. Future Perspective
7. REGULATORY SCENARIO
SECTION III: MARKET OVERVIEW
8. COMPREHENSIVE DATABASE OF LEADING PLAYERS
9. COMPETITIVE LANDSCAPE
- 9.1. Chapter Overview
- 9.2. Renewable Energy: Overall Market Landscape
- 9.2.1. Analysis by Year of Establishment
- 9.2.2. Analysis by Company Size
- 9.2.3. Analysis by Location of Headquarters
- 9.2.4. Analysis by Ownership Structure
10. WHITE SPACE ANALYSIS
11. COMPANY COMPETITIVENESS ANALYSIS
12. STARTUP ECOSYSTEM IN THE RENEWABLE ENERGY MARKET
- 12.1. Renewable Energy Market: Market Landscape of Startups
- 12.1.1. Analysis by Year of Establishment
- 12.1.2. Analysis by Company Size
- 12.1.3. Analysis by Company Size and Year of Establishment
- 12.1.4. Analysis by Location of Headquarters
- 12.1.5. Analysis by Company Size and Location of Headquarters
- 12.1.6. Analysis by Ownership Structure
- 12.2. Key Findings
SECTION IV: COMPANY PROFILES
13. COMPANY PROFILES
- 13.1. Chapter Overview
- 13.2. ABB*
- 13.2.1. Company Overview
- 13.2.2. Company Mission
- 13.2.3. Company Footprint
- 13.2.4. Management Team
- 13.2.5. Contact Details
- 13.2.6. Financial Performance
- 13.2.7. Operating Business Segments
- 13.2.8. Service / Product Portfolio (project specific)
- 13.2.9. MOAT Analysis
- 13.2.10. Recent Developments and Future Outlook
- 13.3. Acconia
- 13.4. Canadian Solar
- 13.5. EDP Renovaveis
- 13.6. Enel Spa
- 13.7. Engie
- 13.8. General Electric
- 13.9. Iberdrola
- 13.10. Innergex
- 13.11. Invenergy
- 13.12. National Grid Renewables
- 13.13. NextEra Energy
- 13.14. Orsted
- 13.15. Schneider Electric
- 13.16. Siemens
- 13.17. Suzlon Energy
- 13.18. Tata Power
- 13.19. Xcel Energy
SECTION V: MARKET TRENDS
14. MEGA TRENDS ANALYSIS
15. UNMEET NEED ANALYSIS
16. PATENT ANALYSIS
17. RECENT DEVELOPMENTS
- 17.1. Chapter Overview
- 17.2. Recent Funding
- 17.3. Recent Partnerships
- 17.4. Other Recent Initiatives
SECTION VI: MARKET OPPORTUNITY ANALYSIS
18. GLOBAL RENEWABLE ENERGY MARKET
- 18.1. Chapter Overview
- 18.2. Key Assumptions and Methodology
- 18.3. Trends Disruption Impacting Market
- 18.4. Demand Side Trends
- 18.5. Supply Side Trends
- 18.6. Global Renewable Energy Market, Historical Trends (Since 2019) and Forecasted Estimates (Till 2035)
- 18.7. Multivariate Scenario Analysis
- 18.7.1. Conservative Scenario
- 18.7.2. Optimistic Scenario
- 18.8. Investment Feasibility Index
- 18.9. Key Market Segmentations
19. MARKET OPPORTUNITIES BASED ON TYPE OF RENEWABLE ENERGY
- 19.1. Chapter Overview
- 19.2. Key Assumptions and Methodology
- 19.3. Revenue Shift Analysis
- 19.4. Market Movement Analysis
- 19.5. Penetration-Growth (P-G) Matrix
- 19.6. Renewable Energy Market for Bio Energy: Historical Trends (Since 2019) and Forecasted Estimates (Till 2035)
- 19.7. Renewable Energy Market for Geothermal: Historical Trends (Since 2019) and Forecasted Estimates (Till 2035)
- 19.8. Renewable Energy Market for Hydroelectric Power: Historical Trends (Since 2019) and Forecasted Estimates (Till 2035)
- 19.9. Renewable Energy Market for Wind Power: Historical Trends (Since 2019) and Forecasted Estimates (Till 2035)
- 19.10. Renewable Energy Market for Others: Historical Trends (Since 2019) and Forecasted Estimates (Till 2035)
- 19.11. Data Triangulation and Validation
- 19.11.1. Secondary Sources
- 19.11.2. Primary Sources
- 19.11.3. Statistical Modeling
20. MARKET OPPORTUNITIES BASED ON TYPE OF APPLICATION
- 20.1. Chapter Overview
- 20.2. Key Assumptions and Methodology
- 20.3. Revenue Shift Analysis
- 20.4. Market Movement Analysis
- 20.5. Penetration-Growth (P-G) Matrix
- 20.6. Renewable Energy Market for Commercial: Historical Trends (Since 2019) and Forecasted Estimates (Till 2035)
- 20.7. Renewable Energy Market for Industrial: Historical Trends (Since 2019) and Forecasted Estimates (Till 2035)
- 20.8. Renewable Energy Market for Residential: Historical Trends (Since 2019) and Forecasted Estimates (Till 2035)
- 20.9. Data Triangulation and Validation
- 20.9.1. Secondary Sources
- 20.9.2. Primary Sources
- 20.9.3. Statistical Modeling
21. MARKET OPPORTUNITIES BASED ON TYPE OF INVESTMENT
- 21.1. Chapter Overview
- 21.2. Key Assumptions and Methodology
- 21.3. Revenue Shift Analysis
- 21.4. Market Movement Analysis
- 21.5. Penetration-Growth (P-G) Matrix
- 21.6. Renewable Energy Market for Government-Funded Projects: Historical Trends (Since 2019) and Forecasted Estimates (Till 2035)
- 21.7. Renewable Energy Market for Private Sector Investments: Historical Trends (Since 2019) and Forecasted Estimates (Till 2035)
- 21.8. Renewable Energy Market for Public-Private Partnerships: Historical Trends (Since 2019) and Forecasted Estimates (Till 2035)
- 21.9. Data Triangulation and Validation
- 21.9.1. Secondary Sources
- 21.9.2. Primary Sources
- 21.9.3. Statistical Modeling
22. MARKET OPPORTUNITIES BASED ON TYPE OF ENTERPRISE SIZE
- 22.1. Chapter Overview
- 22.2. Key Assumptions and Methodology
- 22.3. Revenue Shift Analysis
- 22.4. Market Movement Analysis
- 22.5. Penetration-Growth (P-G) Matrix
- 22.6. Renewable Energy Market for Large Enterprise: Historical Trends (Since 2019) and Forecasted Estimates (Till 2035)
- 22.7. Renewable Energy Market for Small and Medium Enterprise: Historical Trends (Since 2019) and Forecasted Estimates (Till 2035)
- 22.8. Data Triangulation and Validation
- 22.8.1. Secondary Sources
- 22.8.2. Primary Sources
- 22.8.3. Statistical Modeling
23. MARKET OPPORTUNITIES FOR RENEWABLE ENERGY IN NORTH AMERICA
- 23.1. Chapter Overview
- 23.2. Key Assumptions and Methodology
- 23.3. Revenue Shift Analysis
- 23.4. Market Movement Analysis
- 23.5. Penetration-Growth (P-G) Matrix
- 23.6. Renewable Energy Market in North America: Historical Trends (Since 2019) and Forecasted Estimates (Till 2035)
- 23.6.1. Renewable Energy Market in the US: Historical Trends (Since 2019) and Forecasted Estimates (Till 2035)
- 23.6.2. Renewable Energy Market in Canada: Historical Trends (Since 2019) and Forecasted Estimates (Till 2035)
- 23.6.3. Renewable Energy Market in Mexico: Historical Trends (Since 2019) and Forecasted Estimates (Till 2035)
- 23.6.4. Renewable Energy Market in Other North American Countries: Historical Trends (Since 2019) and Forecasted Estimates (Till 2035)
- 23.7. Data Triangulation and Validation
24. MARKET OPPORTUNITIES FOR RENEWABLE ENERGY IN EUROPE
- 24.1. Chapter Overview
- 24.2. Key Assumptions and Methodology
- 24.3. Revenue Shift Analysis
- 24.4. Market Movement Analysis
- 24.5. Penetration-Growth (P-G) Matrix
- 24.6. Renewable Energy Market in Europe: Historical Trends (Since 2019) and Forecasted Estimates (Till 2035)
- 24.6.1. Renewable Energy Market in Austria: Historical Trends (Since 2019) and Forecasted Estimates (Till 2035)
- 24.6.2. Renewable Energy Market in Belgium: Historical Trends (Since 2019) and Forecasted Estimates (Till 2035)
- 24.6.3. Renewable Energy Market in Denmark: Historical Trends (Since 2019) and Forecasted Estimates (Till 2035)
- 24.6.4. Renewable Energy Market in France: Historical Trends (Since 2019) and Forecasted Estimates (Till 2035)
- 24.6.5. Renewable Energy Market in Germany: Historical Trends (Since 2019) and Forecasted Estimates (Till 2035)
- 24.6.6. Renewable Energy Market in Ireland: Historical Trends (Since 2019) and Forecasted Estimates (Till 2035)
- 24.6.7. Renewable Energy Market in Italy: Historical Trends (Since 2019) and Forecasted Estimates (Till 2035)
- 24.6.8. Renewable Energy Market in Netherlands: Historical Trends (Since 2019) and Forecasted Estimates (Till 2035)
- 24.6.9. Renewable Energy Market in Norway: Historical Trends (Since 2019) and Forecasted Estimates (Till 2035)
- 24.6.10. Renewable Energy Market in Russia: Historical Trends (Since 2019) and Forecasted Estimates (Till 2035)
- 24.6.11. Renewable Energy Market in Spain: Historical Trends (Since 2019) and Forecasted Estimates (Till 2035)
- 24.6.12. Renewable Energy Market in Sweden: Historical Trends (Since 2019) and Forecasted Estimates (Till 2035)
- 24.6.13. Renewable Energy Market in Sweden: Historical Trends (Since 2019) and Forecasted Estimates (Till 2035)
- 24.6.14. Renewable Energy Market in Switzerland: Historical Trends (Since 2019) and Forecasted Estimates (Till 2035)
- 24.6.15. Renewable Energy Market in the UK: Historical Trends (Since 2019) and Forecasted Estimates (Till 2035)
- 24.6.16. Renewable Energy Market in Other European Countries: Historical Trends (Since 2019) and Forecasted Estimates (Till 2035)
- 24.7. Data Triangulation and Validation
25. MARKET OPPORTUNITIES FOR RENEWABLE ENERGY IN ASIA
- 25.1. Chapter Overview
- 25.2. Key Assumptions and Methodology
- 25.3. Revenue Shift Analysis
- 25.4. Market Movement Analysis
- 25.5. Penetration-Growth (P-G) Matrix
- 25.6. Renewable Energy Market in Asia: Historical Trends (Since 2019) and Forecasted Estimates (Till 2035)
- 25.6.1. Renewable Energy Market in China: Historical Trends (Since 2019) and Forecasted Estimates (Till 2035)
- 25.6.2. Renewable Energy Market in India: Historical Trends (Since 2019) and Forecasted Estimates (Till 2035)
- 25.6.3. Renewable Energy Market in Japan: Historical Trends (Since 2019) and Forecasted Estimates (Till 2035)
- 25.6.4. Renewable Energy Market in Singapore: Historical Trends (Since 2019) and Forecasted Estimates (Till 2035)
- 25.6.5. Renewable Energy Market in South Korea: Historical Trends (Since 2019) and Forecasted Estimates (Till 2035)
- 25.6.6. Renewable Energy Market in Other Asian Countries: Historical Trends (Since 2019) and Forecasted Estimates (Till 2035)
- 25.7. Data Triangulation and Validation
26. MARKET OPPORTUNITIES FOR RENEWABLE ENERGY IN MIDDLE EAST AND NORTH AFRICA (MENA)
- 26.1. Chapter Overview
- 26.2. Key Assumptions and Methodology
- 26.3. Revenue Shift Analysis
- 26.4. Market Movement Analysis
- 26.5. Penetration-Growth (P-G) Matrix
- 26.6. Renewable Energy Market in Middle East and North Africa (MENA): Historical Trends (Since 2019) and Forecasted Estimates (Till 2035)
- 26.6.1. Renewable Energy Market in Egypt: Historical Trends (Since 2019) and Forecasted Estimates (Till 205)
- 26.6.2. Renewable Energy Market in Iran: Historical Trends (Since 2019) and Forecasted Estimates (Till 2035)
- 26.6.3. Renewable Energy Market in Iraq: Historical Trends (Since 2019) and Forecasted Estimates (Till 2035)
- 26.6.4. Renewable Energy Market in Israel: Historical Trends (Since 2019) and Forecasted Estimates (Till 2035)
- 26.6.5. Renewable Energy Market in Kuwait: Historical Trends (Since 2019) and Forecasted Estimates (Till 2035)
- 26.6.6. Renewable Energy Market in Saudi Arabia: Historical Trends (Since 2019) and Forecasted Estimates (Till 2035)
- 26.6.7. Renewable Energy Market in United Arab Emirates (UAE): Historical Trends (Since 2019) and Forecasted Estimates (Till 2035)
- 26.6.8. Renewable Energy Market in Other MENA Countries: Historical Trends (Since 2019) and Forecasted Estimates (Till 2035)
- 26.7. Data Triangulation and Validation
27. MARKET OPPORTUNITIES FOR RENEWABLE ENERGY IN LATIN AMERICA
- 27.1. Chapter Overview
- 27.2. Key Assumptions and Methodology
- 27.3. Revenue Shift Analysis
- 27.4. Market Movement Analysis
- 27.5. Penetration-Growth (P-G) Matrix
- 27.6. Renewable Energy Market in Latin America: Historical Trends (Since 2019) and Forecasted Estimates (Till 2035)
- 27.6.1. Renewable Energy Market in Argentina: Historical Trends (Since 2019) and Forecasted Estimates (Till 2035)
- 27.6.2. Renewable Energy Market in Brazil: Historical Trends (Since 2019) and Forecasted Estimates (Till 2035)
- 27.6.3. Renewable Energy Market in Chile: Historical Trends (Since 2019) and Forecasted Estimates (Till 2035)
- 27.6.4. Renewable Energy Market in Colombia Historical Trends (Since 2019) and Forecasted Estimates (Till 2035)
- 27.6.5. Renewable Energy Market in Venezuela: Historical Trends (Since 2019) and Forecasted Estimates (Till 2035)
- 27.6.6. Renewable Energy Market in Other Latin American Countries: Historical Trends (Since 2019) and Forecasted Estimates (Till 2035)
- 27.7. Data Triangulation and Validation
28. MARKET OPPORTUNITIES FOR RENEWABLE ENERGY IN REST OF THE WORLD
- 28.1. Chapter Overview
- 28.2. Key Assumptions and Methodology
- 28.3. Revenue Shift Analysis
- 28.4. Market Movement Analysis
- 28.5. Penetration-Growth (P-G) Matrix
- 28.6. Renewable Energy Market in Rest of the World: Historical Trends (Since 2019) and Forecasted Estimates (Till 2035)
- 28.6.1. Renewable Energy Market in Australia: Historical Trends (Since 2019) and Forecasted Estimates (Till 2035)
- 28.6.2. Renewable Energy Market in New Zealand: Historical Trends (Since 2019) and Forecasted Estimates (Till 2035)
- 28.6.3. Renewable Energy Market in Other Countries
- 28.7. Data Triangulation and Validation
29. MARKET CONCENTRATION ANALYSIS: DISTRIBUTION BY LEADING PLAYERS
- 29.1. Leading Player 1
- 29.2. Leading Player 2
- 29.3. Leading Player 3
- 29.4. Leading Player 4
- 29.5. Leading Player 5
- 29.6. Leading Player 6
- 29.7. Leading Player 7
- 29.8. Leading Player 8
30. ADJACENT MARKET ANALYSIS
SECTION VII: STRATEGIC TOOLS
31. KEY WINNING STRATEGIES
32. PORTER FIVE FORCES ANALYSIS
33. SWOT ANALYSIS
34. VALUE CHAIN ANALYSIS
35. ROOTS STRATEGIC RECOMMENDATIONS
- 35.1. Chapter Overview
- 35.2. Key Business-related Strategies
- 35.2.1. Research & Development
- 35.2.2. Product Manufacturing
- 35.2.3. Commercialization / Go-to-Market
- 35.2.4. Sales and Marketing
- 35.3. Key Operations-related Strategies
- 35.3.1. Risk Management
- 35.3.2. Workforce
- 35.3.3. Finance
- 35.3.4. Others