


|
시장보고서
상품코드
1636163
컴플라이언스 탄소배출권 시장 전망 : 시장 점유율 분석, 산업 동향, 성장 예측(2025-2030년)Compliance Carbon Credit - Market Share Analysis, Industry Trends & Statistics, Growth Forecasts (2025 - 2030) |
||||||
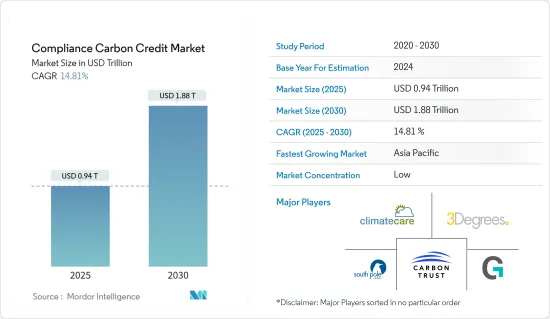
컴플라이언스 탄소배출권 시장 규모는 2025년에 9,400억 달러로 예측되며, 예측 기간(2025-2030년)의 연평균 성장율(CAGR)은 14.81%로, 2030년에는 1조 8,800억 달러에 달할 것으로 예측됩니다.

컴플라이언스 탄소배출권 시장은 배출권 거래제(ETS) 또는 배출권 거래제와 같은 온실가스 배출을 제한하는 규제 프레임워크 하에서 운영됩니다. 주요 기능은 산업, 발전소, 운송 부문과 같이 배출 규제를 받는 단체가 탄소 배출권을 구매하여 규정 준수 의무를 이행할 수 있는 메커니즘을 제공하는 것입니다.
컴플라이언스 탄소배출권 시장은 다양한 규제 환경 내에서 운영되며, 여러 관할권에서 배출권 거래 제도와 규제 프레임워크를 시행하고 있습니다. 주요 시장으로는 유럽연합 배출권거래제(EU ETS), 캘리포니아 배출권거래제, 지역 온실가스 이니셔티브(RGGI), 중국, 한국, 뉴질랜드의 다양한 국가 제도가 있습니다.
재생 에너지 설치(예: 풍력, 태양광), 에너지 효율에의 노력, 산림 및 토지 이용 프로젝트(예: 식림, 재식림), 산업 공정 개선 등 다양한 배출 감축 프로젝트에서 생성됩니다.
컴플라이언스 탄소배출권 시장 동향
탄소 가격 책정 과정 살펴보기 : 브렉시트 이후 영국-ETS
- 2020년 유럽연합을 탈퇴한 영국은 EU-ETS 참여를 대체하는 자체 탄소 가격 책정 메커니즘인 UK-ETS를 시행했습니다. 이러한 전환을 통해 영국은 배출권 거래 시스템을 구축하고 유럽 연합과 독립적으로 탄소 가격 정책을 설정할 수 있었습니다.
- 영국의 배출권 거래 시스템(UK-ETS)에서 거래되는 배출권(UKA)의 가격은 2021년 1월 출범 이후 눈에 띄는 변동을 경험했습니다. 업계 전문가에 따르면 2022년 8월 19일에 톤당 97.75파운드에 최고치를 기록했는데, 이는 강력한 수요 또는 규제 요인이 가격을 견인하고 있음을 나타냅니다. 그러나 2023년 5월 31일에는 톤당 51.04파운드까지 하락하여 2022년 1월 이전에 가장 낮은 가격을 기록했습니다. 시장 상황의 변화, 규제 조정, 수요와 공급 역학 관계의 변화 등 다양한 요인이 가격 하락에 영향을 미쳤을 수 있습니다.
- 2022년 영국-ETS는 총 4.3파운드에 달하는 상당한 수익을 창출했습니다. 이 수익은 산업 시설, 발전소 및 배출권 거래제의 적용을 받는 기타 부문을 포함하여 영국 내 규제 대상 기관에 대한 탄소 가격의 재정적 영향을 나타냅니다. 탄소 허용량에서 발생하는 수익은 이러한 기업의 규정 준수 비용을 반영하며 기후 관련 이니셔티브 및 투자에 전념하는 정부 기금에 기여합니다.
신재생에너지발전에 대한 투자와 기술 혁신이 탄소배출권 생성을 주도
- 많은 에너지 기업들이 이산화탄소 배출량을 줄이기 위해 풍력, 수력, 태양광 등 재생 가능 에너지원에 투자하고 있습니다. 청정 에너지 생산으로의 전환은 재생 에너지 프로젝트에서 컴플라이언스 탄소배출권을 창출할 수 있는 기회를 만듭니다.
- 예를 들어, 2024년 2월 칠레는 구리 광산과 화석 연료에 의존하는 기타 산업의 탈탄소화를 위해 태양광, 풍력, 친환경 수소 기술에 대한 유럽 투자자를 찾기 시작했습니다. EU-칠레 무역투자협정 재협상 기간 동안 102개의 상장 및 비상장 기업을 대표하는 수소 협회인 H2Chile의 마르코스 쿨카 회장은 유럽을 방문해 정부의 에너지 전략을 발표했습니다.
- 또한 업계 전문가들은 블록체인 기술이 MRV(디지털 모니터링, 보고 및 검증) 시스템과 통합되어 탄소 시장에서 탄소배출권 검증을 강화할 수 있다고 생각합니다. MRV 시스템은 위성 이미지, IoT 센서, 모니터링 시스템 등 다양한 출처에서 데이터를 수집합니다. 디지털 MRV 데이터는 해싱되어 블록체인에 업로드되어 탄소배출권을 검증합니다. 스마트 계약은 특정 기준을 충족하는 프로젝트에만 탄소 크레딧이 발급되도록 함으로써 검증 프로세스를 자동화합니다. 탈중앙화된 오라클을 사용하면 오프체인 정보 피드를 검증 프로세스에 추가하여 실시간으로 탄소배출권을 검증할 수 있습니다.
컴플라이언스 탄소배출권 산업 개요
다양한 인증 기관과 표준 기관이 미리 정의된 기준과 방법론에 따라 배출량 감축 프로젝트를 인증하고 탄소배출권을 발행합니다. 인증 서비스를 원하는 프로젝트 개발자를 유치하기 위해 인증 기관 간에 경쟁이 존재할 수 있으며, 인증 수수료, 일정 및 평판의 차이가 인증 기관 선택에 영향을 미칩니다. 탄소배출권 가격과 시장 역학관계는 시간에 따라 그리고 시장마다 크게 달라질 수 있으며, 이로 인해 가격, 유동성, 시장 행동이 세분화될 수 있습니다. 이러한 변화는 시장 진출기업에게 시장 상황을 효과적으로 예측하고 탐색하는 것을 어렵게 만듭니다. 카본 트러스트, 크라이메이트 케어, 3Degrees 등이 탄소배출권 시장에 참여하고 있습니다.
기타 혜택
- 엑셀 형식 시장 예측(ME) 시트
- 3개월간의 애널리스트 지원
목차
제1장 서론
- 조사의 성과
- 조사의 전제
- 조사 범위
제2장 조사 방법
제3장 주요 요약
제4장 시장 인사이트
- 현재의 시장 시나리오
- 기술 동향
- 업계의 밸류체인 분석
- 정부의 규제와 대처
제5장 시장 역학
- 성장 촉진요인
- 규제 강화와 정책
- 기업의 지속가능성에 대한 대처 증가
- 억제요인
- 시장의 복잡성과 불확실성
- 기회
- 혁신과 기술의 진보
- 업계의 매력 - Porter's Five Forces 분석
- 공급기업의 협상력
- 소비자, 구매자의 협상력
- 신규 참가업체의 위협
- 대체품의 위협
- 경쟁 기업간 경쟁 관계의 강도
제6장 시장 세분화
- 크레디트 유형별
- 신재생에너지 프로젝트
- 임업과 토지 이용
- 에너지 효율
- 산업 프로세스 개선
- 섹터별
- 에너지 부문
- 운수부문
- 산업부문
- 농업 및 임업
- 지역별
- 북미
- 미국
- 캐나다
- 유럽
- 영국
- 독일
- 프랑스
- 기타 유럽
- 아시아태평양
- 중국
- 일본
- 인도
- 한국
- 기타 아시아태평양
- 중동 및 아프리카
- 라틴아메리카
- 북미
제7장 경쟁 구도
- 기업 프로파일
- Carbon Trust
- ClimateCare
- 3Degrees
- South Pole
- Gold Standard
- Natural Capital Partners
- Shell New Energies
- Sustainable Travel International
- Forest Carbon
- Atmosfair
- 기타 기업
제8장 시장 기회와 앞으로의 동향
제9장 부록
HBR 25.02.10The Compliance Carbon Credit Market size is estimated at USD 0.94 trillion in 2025, and is expected to reach USD 1.88 trillion by 2030, at a CAGR of 14.81% during the forecast period (2025-2030).
The compliance carbon credit market operates under regulatory frameworks that limit greenhouse gas emissions, such as emissions trading schemes (ETS) or cap-and-trade systems. Its primary function is to provide a mechanism for entities subject to emissions regulations, such as industries, power plants, and transportation sectors, to meet compliance obligations by purchasing carbon credits.
Compliance carbon markets operate within a diverse regulatory landscape, with different jurisdictions implementing emissions trading schemes and regulatory frameworks. Major compliance markets include the European Union Emissions Trading System (EU ETS), the California Cap-and-Trade Program, the Regional Greenhouse Gas Initiative (RGGI), and various national schemes in China, South Korea, and New Zealand.
Compliance carbon credits are generated from various emission reduction projects, including renewable energy installations (e.g., wind, solar), energy efficiency initiatives, forestry and land-use projects (e.g., afforestation, reforestation), and industrial process improvements.
Compliance Carbon Credit Market Trends
Charting the Course of Carbon Pricing: UK-ETS Post-Brexit
- After leaving the European Union in 2020, the United Kingdom implemented its carbon pricing mechanism, the UK-ETS, which replaced its participation in the EU-ETS. This transition allowed the United Kingdom to establish its emissions trading system and set its carbon pricing policies independent of the European Union.
- The price of emissions allowances (UKAs) traded on the United Kingdom's Emissions Trading System (UK-ETS) has experienced notable fluctuations since its inception in January 2021. According to industry experts, the price reached a high of GBP 97.75 per metric ton on August 19, 2022, indicating strong demand or regulatory factors driving the price. However, by May 31, 2023, the price dropped to GBP 51.04 per metric ton, marking the lowest price before January 2022. Various factors, including changes in market conditions, regulatory adjustments, or shifts in supply and demand dynamics, could have influenced this decline in price.
- In 2022, the UK-ETS generated significant revenue, totaling GBP 4.3. This revenue represents the financial impact of carbon pricing on regulated entities within the United Kingdom, including industrial facilities, power plants, and other sectors covered by the emissions trading system. The revenue generated from carbon allowances reflects the cost of compliance for these entities and contributes to government funds dedicated to climate-related initiatives and investments.
Renewable Energy Investments and Technological Innovations Driving Carbon Credit Generation
- Many energy companies invest in renewable power sources, including wind, hydroelectric, and solar power, to reduce their carbon footprint. This shift toward cleaner energy production creates opportunities for generating compliance carbon credits from renewable energy projects.
- For instance, in February 2024, Chile embarked on a European hunt for investors in solar, wind, and green hydrogen technologies to decarbonize copper mines and other industries reliant on fossil fuels. During renegotiations of the EU Chile Trade and Investment Agreement, Marcos Kulka, president of H2Chile, a hydrogen association representing 102 publicly and privately owned companies, went to Europe to present his government's energy strategy.
- Further, Industry experts believe blockchain technology can enhance carbon credit validation in the carbon market by integrating with MRV (Digital Monitoring, Reporting, and Verification) systems. MRV systems collect data from various sources, including satellite images, IoT sensors, and monitoring systems. The digital MRV data is hashed and uploaded to the blockchain to verify carbon credits. Smart contracts automate the verification process by ensuring carbon credits are issued only to projects that fulfill specific criteria. Using decentralized oracles, off-chain information feeds can be added to the validation process, allowing for real-time carbon credit validation.
Compliance Carbon Credit Industry Overview
Various certification bodies and standards organizations certify emission reduction projects and issue carbon credits based on predefined criteria and methodologies. Competition may exist among certification bodies to attract project developers seeking certification services, with differences in certification fees, timelines, and reputation influencing their choice of certifier. Carbon credit prices and market dynamics can vary significantly over time and across different markets, leading to pricing, liquidity, and market behavior fragmentation. This variability can make it challenging for market participants to predict and navigate market conditions effectively. Some of the compliant carbon credit market players are Carbon Trust, ClimateCare, and 3Degrees.
Additional Benefits:
- The market estimate (ME) sheet in Excel format
- 3 months of analyst support
TABLE OF CONTENTS
1 INTRODUCTION
- 1.1 Study Deliverables
- 1.2 Study Assumptions
- 1.3 Scope of the Study
2 RESEARCH METHODOLOGY
3 EXECUTIVE SUMMARY
4 MARKET INSIGHTS
- 4.1 Current Market Scenario
- 4.2 Technological Trends
- 4.3 Industry Value Chain Analysis
- 4.4 Government Regulations and Initiatives
5 MARKET DYNAMICS
- 5.1 Drivers
- 5.1.1 Regulatory Mandates and Policies
- 5.1.2 Growing Corporate Sustainability Initiatives
- 5.2 Restraints
- 5.2.1 Market Complexity and Uncertainty
- 5.3 Opportunities
- 5.3.1 Innovation and Technology Advancements
- 5.4 Industry Attractiveness - Porter's Five Forces Analysis
- 5.4.1 Bargaining Power of Suppliers
- 5.4.2 Bargaining Power of Consumers / Buyers
- 5.4.3 Threat of New Entrants
- 5.4.4 Threat of Substitute Products
- 5.4.5 Intensity of Competitive Rivalry
6 MARKET SEGMENTATION
- 6.1 By Type of Credits
- 6.1.1 Renewable Energy Projects
- 6.1.2 Forestry and Land Use
- 6.1.3 Energy Efficiency
- 6.1.4 Industrial Process Improvements
- 6.2 By Sector
- 6.2.1 Energy Sector
- 6.2.2 Transportation
- 6.2.3 Industrial Sector
- 6.2.4 Agriculture and Forestry
- 6.3 By Geography
- 6.3.1 North America
- 6.3.1.1 United States
- 6.3.1.2 Canada
- 6.3.2 Europe
- 6.3.2.1 United Kingdom
- 6.3.2.2 Germany
- 6.3.2.3 France
- 6.3.2.4 Rest of Europe
- 6.3.3 Asia-Pacific
- 6.3.3.1 China
- 6.3.3.2 Japan
- 6.3.3.3 India
- 6.3.3.4 South Korea
- 6.3.3.5 Rest of Asia-Pacific
- 6.3.4 Middle East and Africa
- 6.3.5 Latin America
- 6.3.1 North America
7 COMPETITIVE LANDSCAPE
- 7.1 Overview (Market Concentration and Major Players)
- 7.2 Company Profiles
- 7.2.1 Carbon Trust
- 7.2.2 ClimateCare
- 7.2.3 3Degrees
- 7.2.4 South Pole
- 7.2.5 Gold Standard
- 7.2.6 Natural Capital Partners
- 7.2.7 Shell New Energies
- 7.2.8 Sustainable Travel International
- 7.2.9 Forest Carbon
- 7.2.10 Atmosfair*
- 7.3 Other Companies
