


|
시장보고서
상품코드
1639353
에너지 분야의 데스크톱 가상화 : 시장 점유율 분석, 산업 동향, 성장 예측(2025-2030년)Desktop Virtualization In Energy Sector - Market Share Analysis, Industry Trends & Statistics, Growth Forecasts (2025 - 2030) |
||||||
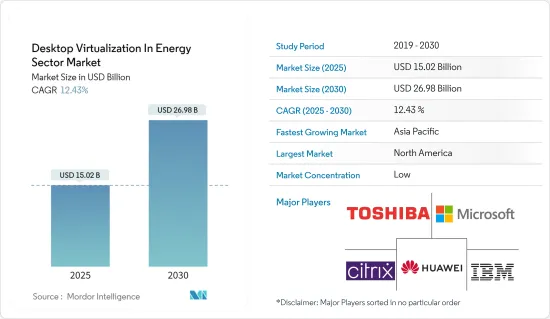
에너지 분야의 데스크톱 가상화 시장 규모는 2025년 150억 2,000만 달러로 추정됩니다. 예측 기간(2025-2030년)의 CAGR은 12.43%로, 2030년에는 269억 8,000만 달러에 달할 것으로 예측됩니다.
에너지 분야에서는 인프라의 원격 조작 및 모니터링이 자주 수행됩니다. 데스크톱 가상화를 통해 직원은 중요한 시스템과 데이터에 원격 위치에서 안전하게 액세스할 수 있어 업무 효율성이 향상됩니다.
주요 하이라이트
- 에너지 수요가 증가함에 따라 에너지 기업은 운영 비용을 줄이고 비즈니스 프로세스를 간소화해야 합니다. 데스크톱 환경과 데이터를 안전한 서버에 집중함으로써 데스크톱 가상화는 데이터 보안과 규정 준수를 강화할 수 있습니다.
- 클라우드 기반 데스크톱 가상화를 통해 에너지 부서 직원은 인터넷 연결을 통해 어디서나 가상 데스크톱과 중요한 용도에 액세스할 수 있습니다. 클라우드 기반 솔루션은 견고한 재해 복구 기능을 설명합니다. 재해나 시스템 장애가 발생하면 에너지 회사는 오프사이트 클라우드 백업에서 가상 데스크톱 환경과 데이터를 신속하게 복구할 수 있습니다.
- 에너지 기업은 종종 변화하는 업무 요구 사항에 신속하게 대응해야 합니다. 원격지의 드릴링 현장에 팀을 파견하거나 엔지니어가 위치에서 데이터에 액세스할 수 있도록 하는 경우에도 데스크톱 가상화는 이러한 상황의 변화에 적응하는 유연성을 설명합니다.
- 인프라의 제약으로 인해 작업자는 전통적인 작업을 강요합니다. 에너지 분야에서는 복잡하고 확립된 플랫폼이 이미 온프레미스에 있으며 클라우드로 전환하는 데는 시간이 걸립니다. 클라우드 기반 근로자 데이터의 보안과 프라이버시에 대한 우려가 시장 성장을 방해할 것으로 예상됩니다.
에너지 분야의 데스크톱 가상화 시장 동향
클라우드 도입 형태 부문이 큰 시장 점유율을 차지할 전망
- 다양한 에너지 분야의 기업들이 클라우드 컴퓨팅을 활용하여 기업의 운영 비용을 절감하고 있습니다. 클라우드 호스팅의 간편한 배포, 액세스성 및 유연성은 조직의 클라우드 컴퓨팅 채택을 촉진할 것으로 예상됩니다. 클라우드 배포에는 DaaS(Desktop-as-a-Service), WaaS(Workspace-as-a-Service), SaaS(Application/Software-as-a-Service) 등의 서비스 모델이 있습니다. 데스크톱 가상화는 클라우드 네트워크에서 서비스로 제공되며 모든 컴퓨팅 및 지원 인프라는 클라우드 배포 모드에서 서비스 제공업체 측에서 호스팅됩니다.
- 클라우드를 통한 용도 스트리밍은 많은 기업들이 독립형 용도 서비스를 선택하는 동안 에너지 섹터 산업에서 인기를 얻고 있습니다. 클라우드는 보다 우수한 확장성, 데이터 관리 및 비용 절감을 제공하기 위해 에너지 섹터 산업 전반에서 선호됩니다.
- 2023년에는 중국, 미국, 브라질이 신재생에너지 도입량으로 최고가 됩니다. 신재생에너지의 도입량으로는 중국이 톱으로, 약 1,453기가와트의 용량을 자랑합니다. 미국은 약 388기가와트에서 2위였습니다. 신재생에너지의 이용은 기후 변화에 대처하고 그 영향을 경감하는데 있어서 매우 중요한 대책입니다.
- 클라우드 도입은 수력 발전 용량 확대로 인한 컴퓨팅 수요 증가에 대응하기 위해 필요한 유연성과 확장성을 설명합니다. 조직은 프로젝트가 성장함에 따라 필요에 따라 가상 데스크톱 및 리소스를 프로비저닝하고 프로비저닝을 해제할 수 있습니다.
- 가상 데스크톱의 클라우드 배포를 통해 중요한 용도과 데이터에 원격으로 액세스할 수 있습니다. 엔지니어는 운영하고 관리자는 인터넷 연결이 있으면 어디서나 수력 프로젝트를 안전하게 모니터링하고 관리할 수 있으므로 업무 효율이 향상되고 현장 요원의 필요성이 감소합니다. 또한 2022년 8월 인도 정부는 네팔에서 두 개의 수력 발전 프로젝트, 즉 서세티 수력 발전 프로젝트와 세티 강 수력 발전 프로젝트의 개발을 발표했습니다. 이 프로젝트의 총 사업비는 약 24억 달러가 될 전망입니다. 이러한 신흥국 시장의 개척은 에너지 분야에서 데스크톱 가상화 시장의 클라우드 배포 모드에 기회가 될 것입니다.
아시아태평양이 큰 시장 점유율을 차지할 전망
- 아시아태평양 기업이 신기술을 신속하게 채용하고 에너지 부문에 투자하고 있는 것이 세계 지배의 주요 원동력이 되고 있습니다. 아시아태평양의 클라우드 기반 데스크톱 가상화 구축의 성장에 있어 주요 클라우드 서비스 제공업체가 중요한 역할을 하고 있습니다. 아시아태평양의 에너지 기업은 스마트 그리드 기술 등 신제품 및 서비스에 지원되는 복잡한 인프라 네트워크를 통해 에너지를 송전, 배전, 저장하고 있습니다.
- 2022년 현재 중국은 신재생에너지 도입의 세계 리더입니다. 2022년 재생가능에너지 총발전용량은 1,160.8GW에 달하고, 전년대비 약 13.4% 증가했습니다. 수력, 태양광, 풍력은 이 나라의 주요 재생 가능 에너지원입니다.
- 인도 정부는 2022년도까지 175GW의 재생 가능 에너지 용량을 도입하는 목표를 내걸고 있으며, 그 내역은 태양광 발전이 100GW, 풍력 발전이 60GW, 바이오 발전이 10GW, 소수력 발전이 5GW입니다. 게다가 인도 신재생에너지부는 2022년 신재생에너지, 전기자동차, 태양열기기 제조, 녹색수소에 150억 달러의 투자를 기대하고 있습니다.
- 또한 인도 정부는 이산화탄소 배출량을 줄이기 위해 신재생에너지에 많은 투자를 하고, 다양한 대규모 지속가능전력 프로젝트를 실시하고, 녹색에너지를 중점적으로 추진하고 있습니다. 2021년 현재 인도의 재생 가능 에너지 설비 용량은 147GW에 달하고 있으며, 이 나라는 2030년까지 약 450기가와트(GW)의 재생 가능 에너지 설비 용량을 목표로 하고 있습니다.
- 일본 정부는 2030년까지 이산화탄소 배출량을 50% 줄이고 2050년까지 탄소 중립을 달성하는 것을 목표로 하고 있습니다. 2022년 9월, 그린파워 인베스트먼트(GPI)는 아오모리현 니시쓰가루군 후카우라초에 있는 후카우라 윈드팜의 사업자로서 GE 리뉴어블 에너지를 선택했습니다. 이 프로젝트는 GE의 육상 풍력 발전기 4.2-117을 19기 도입하는 것으로, GE에 있어서 일본에서 3번째 프로젝트가 됩니다.
에너지 분야의 데스크톱 가상화
에너지 분야의 데스크톱 가상화 시장은 세분화되어 있으며 Citrix Systems Inc, Toshiba Corporation, IBM, Huawei Technologies, Microsoft 등 대기업이 진출하고 있습니다. 이 시장의 진출기업은 제품 제공을 강화하고 지속 가능한 경쟁 우위를 얻기 위해 제휴 및 인수와 같은 전략을 채택하고 있습니다.
2023년 8월, Dell Technologies는 가상화 아키텍처를 통한 신재생 에너지로의 전환 지원을 발표했습니다. Dell Validated design for Energy Edge는 역동적이고 다양한 재생 가능 에너지 환경에서 계통 운영자에게 보안 및 제어를 제공합니다. 이러한 수요에 대응하기 위해 변전소 사업자는 자동화, 제어, 관리에 가상화를 점점 더 사용하고 있습니다. 가상화 플랫폼은 불안정하고 진화하는 그리드의 새로운 과제에 신속하게 대응하는 유연성을 설명합니다.
2022년 5월, Citrix의 DaaS(Desktop-as-a-Service) 플랫폼이 클라우드 제공업체와 협력하여 기업이 가상 데스크톱 제품의 호스트를 선택할 수 있게 되었습니다. Citrix Systems, Inc.는 Google Cloud와 제휴하여 이미 온프레미스에서 Citrix VDI 기술을 사용하고 있는 기업이 Google Cloud에서 호스팅되는 Citrix DaaS로 전환하기 쉽다고 생각했습니다.
기타 혜택
- 엑셀 형식 시장 예측(ME) 시트
- 3개월간의 애널리스트 서포트
목차
제1장 서론
- 조사의 전제조건과 시장의 정의
- 조사 범위
제2장 조사 방법
제3장 주요 요약
제4장 시장 인사이트
- 시장 개요
- 밸류체인 분석
- 산업의 매력 - Porter's Five Forces 분석
- 신규 진입업자의 위협
- 구매자·소비자의 협상력
- 공급기업의 협상력
- 대체품의 위협
- 경쟁 기업 간 경쟁 관계
제5장 시장 역학
- 시장 성장 촉진요인
- 클라우드화의 진전과 리모트 액세스의 필요성이 시장 성장을 가속
- 시장 성장 억제요인
- 인프라의 제약이 시장 확대를 저해
제6장 시장 세분화
- 데스크톱 전송 플랫폼별
- 호스트형 가상 데스크톱(HVD)
- 호스트형 공유 데스크톱(HSD)
- 배포 모드별
- 온프레미스
- 클라우드
- 지역별
- 북미
- 유럽
- 아시아
- 호주 및 뉴질랜드
제7장 경쟁 구도
- 기업 프로파일
- Citrix Systems Inc.
- Toshiba Corporation
- IBM Corporation
- Huawei Technologies Co. Ltd
- Microsoft Corporation
- Parallels International GmbH
- Dell Inc.
- NComputing
- Ericom Software Inc.
- Vmware Inc.
제8장 투자 분석
제9장 시장 기회와 앞으로의 동향
KTH 25.02.07The Desktop Virtualization In Energy Sector Market size is estimated at USD 15.02 billion in 2025, and is expected to reach USD 26.98 billion by 2030, at a CAGR of 12.43% during the forecast period (2025-2030).

The energy sector often involves remote operations and monitoring of infrastructure. Desktop virtualization allows employees to access critical systems and data securely from remote locations, improving operational efficiency.
Key Highlights
- The increasing energy demand necessitates energy companies to reduce operating costs and streamline business processes. By centralizing desktop environments and data on secure servers, desktop virtualization can enhance data security and compliance, which is crucial in the energy sector due to sensitive information and regulatory requirements.
- Cloud-based desktop virtualization allows energy sector employees to access their virtual desktops and critical applications from anywhere with an Internet connection. Cloud-based solutions offer robust disaster recovery capabilities. In a disaster or system failure, energy companies can quickly recover their virtual desktop environments and data from off-site cloud backups.
- Energy companies often need to respond quickly to changing operational requirements. Whether deploying a team to a remote drilling site or providing engineers with access to data from a different location, desktop virtualization offers the flexibility to adapt to these changing circumstances.
- Infrastructural constraints compel the workers to work traditionally. The energy sector already has complex and established platforms that are on-premise, and moving them to the cloud is time-consuming. Concerns about the security and privacy of cloud-based worker data are expected to hamper the market growth.
Desktop Virtualization In Energy Sector Market Trends
Cloud Deployment Mode Segment is Expected to Hold Significant Market Share
- Various energy sector organizations are using cloud computing to reduce businesses' operational costs. Easy implementation, accessibility, and flexibility of cloud hosting are expected to drive organizations' adoption of cloud computing. Cloud deployment includes service models, such as Desktop-as-a-Service (DaaS), Workspace-as-a-Service (WaaS), and Application/Software-as-a-Service (SaaS). Desktop virtualization is offered as a service over cloud networks, with all computing and supporting infrastructure hosted on the service provider's end in the cloud deployment mode, which makes the migration of data between working environments easy.
- Application streaming over the cloud is gaining popularity in the energy sector industry, with many businesses choosing standalone application services. Cloud is preferred across energy sector industries, providing better scalability, data management, and cost savings.
- In 2023, China, the U.S., and Brazil topped the list for installed renewable energy. China led in renewable energy installations, boasting a capacity of approximately 1,453 gigawatts. The U.S. came in second with a capacity of about 388 gigawatts. Utilizing renewable energy is a crucial measure in tackling climate change and lessening the impacts of this occurrence.
- Cloud deployment offers the flexibility and scalability required to accommodate the increasing computing demands of expanding hydropower capacity. It allows organizations to provision and de-provision virtual desktops and resources as needed, aligning with the project's growth.
- Cloud deployment of virtual desktops enables remote access to critical applications and data. Engineers operate, and managers can securely monitor and manage hydro projects from anywhere with an internet connection, improving operational efficiency and reducing the need for on-site personnel. Moreover, in August 2022, the Government of India announced the development of two hydropower projects in Nepal, namely the West Seti Hydropower Project and the Seti River Hydropower Project. The total cost of these projects is expected to be around USD 2.4 billion. Such developments provide opportunities for the cloud deployment mode of the desktop virtualization market in the energy sector.
Asia Pacific is Expected to Hold Significant Market Share
- Organizations in the Asia Pacific region companies early adoption of new technologies and investments in energy sectors are the primary driving force behind global dominance. Large cloud service providers play a significant role in the region's growth of cloud-based desktop virtualization deployment. The energy companies in the Asia Pacific region further transmit, distribute, and store energy through complex infrastructure networks supported by emerging products and services such as smart grid technologies.
- As of 2022, China is the global leader in renewable energy deployment. The country's total renewable energy capacity reached 1160.8 GW in 2022, representing an increase of approximately 13.4 percent compared to the previous year. Hydropower, solar, and wind are the major renewable energy sources in the country.
- The Government of India has set a target of installing 175 GW of renewable energy capacity by FY 2022, including 100 GW from solar, 60 GW from wind, 10 GW from bio-power, and 5 GW from small hydropower. Moreover, the Indian Ministry for New and Renewable Energy expects investment of USD 15 billion in renewable energy, electric vehicles, manufacturing of solar equipment, and green hydrogen in 2022.
- In addition, the Government of India is investing heavily in renewable energy to reduce carbon emissions, undertaking various large-scale sustainable power projects, and promoting green energy heavily. As of 2021, India's installed renewable energy capacity stood at 147 GW, and the country is targeting about 450 Gigawatt (GW) of installed renewable energy capacity by 2030, which will directly aid the market.
- Japan's government has also targeted reducing carbon emissions to 50 percent by 2030 and achieving carbon neutrality by 2050. In September 2022, Green Power Investment (GPI) chose GE Renewable Energy as the provider for the Fukaura Wind Farm in Fukaura Town, Nishi Tsugaru District, Aomori Prefecture, Japan. The project, which will include 19 units of GE's 4.2-117 onshore wind turbines, is GE's third in Japan.
Desktop Virtualization In Energy Sector Industry Overview
The desktop virtualization market in the energy sector is fragmented, with the presence of major players like Citrix Systems Inc., Toshiba Corporation, IBM Corporation, Huawei Technologies Co. Ltd, and Microsoft Corporation. Players in the market are adopting strategies such as partnerships and acquisitions to enhance their product offerings and gain sustainable competitive advantage.
In August 2023, Dell Technologies announced its support for the shift to renewable energy with virtualized architecture. Dell-validated design for Energy Edge offers grid operators security and control in dynamic, diverse renewable energy environments. To meet these demands, substation operators increasingly use virtualization for automation, control, and management. A virtualized platform provides the flexibility to quickly respond to new challenges in a volatile, evolving grid.
In May 2022 - Citrix's Desktop as a Service (Daas) platform collaborated with cloud providers, giving businesses a choice of host for their virtual desktop products. Citrix Systems, Inc. partnered with Google Cloud and believed that this would make it simpler for businesses already utilizing Citrix VDI technology on-premises to switch to Citrix DaaS hosted on Google Cloud.
Additional Benefits:
- The market estimate (ME) sheet in Excel format
- 3 months of analyst support
TABLE OF CONTENTS
1 INTRODUCTION
- 1.1 Study Assumptions and Market Defnition
- 1.2 Scope of the Study
2 RESEARCH METHODOLOGY
3 EXECUTIVE SUMMARY
4 MARKET INSIGHTS
- 4.1 Market Overview
- 4.2 Value Chain Analysis
- 4.3 Industry Attractiveness - Porter's Five Forces Analysis
- 4.3.1 Threat of New Entrants
- 4.3.2 Bargaining Power of Buyers/Consumers
- 4.3.3 Bargaining Power of Suppliers
- 4.3.4 Threat of Substitute Products
- 4.3.5 Intensity of Competitive Rivalry
5 MARKET DYNAMICS
- 5.1 Market Drivers
- 5.1.1 Growing Adoption of Cloud and Need for Remote Accessibility is Driving the Market Growth
- 5.2 Market Restraints
- 5.2.1 Infrastructural Constraints is Discouraging the Market Expansion
6 MARKET SEGMENTATION
- 6.1 By Desktop Delivery Platform
- 6.1.1 Hosted Virtual Desktop (HVD)
- 6.1.2 Hosted Shared Desktop (HSD)
- 6.2 By Deployment Mode
- 6.2.1 On-Premise
- 6.2.2 Cloud
- 6.3 By Geography
- 6.3.1 North America
- 6.3.2 Europe
- 6.3.3 Asia
- 6.3.4 Australia and New Zealand
7 COMPETITIVE LANDSCAPE
- 7.1 Company Profiles
- 7.1.1 Citrix Systems Inc.
- 7.1.2 Toshiba Corporation
- 7.1.3 IBM Corporation
- 7.1.4 Huawei Technologies Co. Ltd
- 7.1.5 Microsoft Corporation
- 7.1.6 Parallels International GmbH
- 7.1.7 Dell Inc.
- 7.1.8 NComputing
- 7.1.9 Ericom Software Inc.
- 7.1.10 Vmware Inc.
