
|
시장보고서
상품코드
1684034
아시아태평양의 MLCC : 시장 점유율 분석, 산업 동향, 성장 예측(2025-2030년)Asia-Pacific MLCC - Market Share Analysis, Industry Trends & Statistics, Growth Forecasts (2025 - 2030) |
||||||
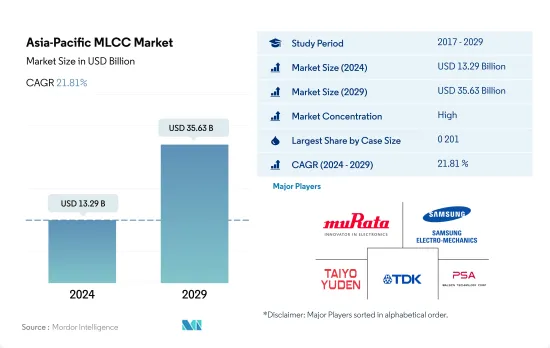
아시아태평양의 MLCC 시장 규모는 2024년에 132억 9,000만 달러로 추정되고, 2029년에는 356억 3,000만 달러에 이를 것으로 예측되며, 예측 기간(2024-2029년)의 CAGR은 21.81%를 나타낼 전망입니다.
0 201 MLCC에 대한 수요는 이 지역의 소비자 가전 및 의료 장비에 대한 수요 증가에 의해 주도되고 있습니다.
- 0 201은 2022년 수량 기준으로 46.85%의 가장 큰 시장 점유율을 차지하며 선두 주자로 부상했으며, 1 005가 16.20%, 0 402가 12.01%로 그 뒤를 바짝 쫓고 있습니다.
- 클래스 1로 분류되는 유전체는 C0G, X8G, U2J로 나눌 수 있습니다. 중저 정전용량을 가진 C0G MLCC는 더 세련된 디자인을 구현하기 위한 소형화 추세로 인해 스마트폰, 스마트워치 등 가전 업계에서 인기가 높아지고 있으며, 특히 스마트폰, 스마트워치 및 기타 디바이스에 많이 사용되고 있습니다.
- 클래스 2 유전체 MLCC는 X7R, X5R, Y5V로 분류됩니다. 이러한 유전체는 고전압 조건을 견딜 수 있고 자동 운전자 보조 시스템(ADAS), 인포테인먼트 시스템, 향상된 배터리 저장 기능과 같은 기능의 발전으로 인해 자동차 애플리케이션에 이상적인 선택입니다.
인센티브와 할인 혜택으로 인해 전기 자동차에 대한 수요가 증가하고 있으며, 증강 현실 및 가상 현실과 같은 소비자 가전제품의 발전으로 MLCC 수요가 증가하고 있습니다.
- 2022년에는 중국이 24.79%로 가장 큰 시장 점유율을 차지하며 선두 주자로 부상했으며, 금액 기준으로는 한국이 20.31%, 일본이 12.27%로 그 뒤를 바짝 쫓고 있습니다.
- 중국의 가전제품 제조 산업은 전 세계적으로 가장 두드러진 산업 중 하나입니다. 중국 가전 시장은 5G 네트워크 도입, 스마트 홈의 확산, 증강 및 가상 현실 기술, 향상된 기능을 갖춘 가전 기기의 지속적인 진화에 힘입어 향후 급속한 성장을 이룰 것으로 예상됩니다. 이에 따라 100uF 미만의 낮은 정전 용량을 갖춘 0201 케이스 크기의 표면 실장형 적층 세라믹 커패시터 MLCC에 대한 수요도 증가할 것으로 예상됩니다. 인센티브와 할인 혜택으로 전기 자동차 수요가 증가하고 증강 현실과 가상 현실과 같은 소비자 가전제품의 발전이 MLCC 수요를 촉진하고 있습니다.
- 자동차 산업은 급속한 기술 발전의 시기를 겪고 있으며, 이는 MLCC의 수요 증가로 이어지고 있습니다. 일반적으로 자동 주행 기능이 없는 엔진 구동 차량에는 약 3,000개의 MLCC가 필요하지만, 전기 자동차에는 8,000-10,000개의 MLCC가 필요합니다. 자동차 부문은 인도 경제 성장에 크게 기여하고 있으며 현재 상황의 벤치마킹 대상으로 볼 수 있습니다. 또한 인도 정부의 규제, 인센티브, 할인, e-모빌리티에 대한 인식이 소비자들의 전기자동차 구매를 유도하여 MLCC 수요를 견인하고 있습니다.
아시아태평양의 MLCC 시장 동향
전자 상거래 산업의 발전이 시장을 견인할 것으로 예상됩니다.
- 소형 상용차 생산량은 2019년 525만 대에서 2022년 523만 대로 증가할 것으로 예상됩니다.
- 온라인 상거래와 물류 부문이 소형 상용차 시장을 뒷받침하고 있습니다. 휴대폰과 인터넷에 대한 접근성이 높아짐에 따라 온라인 소매 판매와 전자상거래가 증가하고 있습니다. 고객에게 상품을 적시에 배송하기 위해 상용차 판매가 증가할 것으로 예상됩니다.
- COVID-19 온라인 판매의 결과로 전 세계 전자상거래 시장의 사용자 기반과 수입이 크게 확대되었습니다. 2020년 개인들의 온라인 쇼핑이 가장 많이 증가한 것은 팬데믹으로 인해 개인들이 온라인 쇼핑을 할 수밖에 없었기 때문입니다. 그러나 아시아태평양 지역의 소형 상용차는 현지 당국의 엄격한 전자상거래 및 여행 제한 조치로 인해 2020년 생산량이 전년 대비 11.17% 감소했습니다.
- 각국 정부가 전기화를 주도하면서 소형 상용차 생산량은 꾸준히 회복되고 있습니다. 주요 지역 업체들이 전기 트럭을 개발 및 생산하기 위해 협력하고 있습니다.
전기 자동차의 채택이 증가함에 따라 수요가 증가할 것으로 예상됩니다.
- 승용차 생산 대수는 2019년 4,065만대에서 2022년 4,232만대로 성장했으며, 기간 중 CAGR은 1.35%를 나타낼 것으로 예상됩니다.
- 승용차 부문은 2020년에 전년 대비 생산량이 11.88% 감소했습니다. 팬데믹과 러시아-우크라이나 전쟁은 전 세계 공급망에 큰 영향을 미쳐 승용차 생산이 둔화되고 제조업체들이 일시적으로 생산 라인을 폐쇄해야 했습니다. 인플레이션과 같은 경제적 어려움은 사람들이 자동차와 같은 대규모 구매를 연기하면서 수요에 영향을 미쳤습니다. 그러나 시장은 느리지만 꾸준한 회복세를 보이며 2022년에는 전년 대비 10.83%의 생산량 증가율을 기록했습니다.
- 이산화탄소 배출과 관련된 정부 정책의 변화로 인해 연료 기반 승용차에 대한 수요는 서서히 감소하고 있습니다. 각국 정부는 2030년까지 온실가스 배출량을 줄이고 2050년까지 순배출 제로를 달성하는 데 주력하고 있습니다. 이러한 수요를 충족하기 위해 기업과 정부는 하이브리드 또는 전기 자동차를 도입하고 공공 콘센트에 직접 충전 인프라를 설치하거나 가정과 직장의 개인 차량 충전소에 대한 보조금을 통해 간접적으로 충전 인프라를 설치하는 데 주력하고 있습니다. 아시아태평양 국가들은 서구 경쟁국에 비해 전기 자동차 판매량이 높은 성장세를 보이고 있습니다. 지난 10년 동안 이 지역에서는 BEV 판매가 크게 증가했습니다.
- 앞서 언급한 요인과 발전으로 인해 승용차 생산에 예측 기술의 채택이 증가하고 있으며, 이러한 긍정적인 추세는 예측 기간 동안 이러한 차량에 사용되는 MLCC의 성장을 촉진할 것으로 예상됩니다.
아시아태평양 MLCC 산업 개요
아시아태평양의 MLCC 시장은 상당히 통합되어 있으며 상위 5곳에서 72.07%를 차지하고 있습니다. 이 시장 주요 기업은 다음과 같습니다. Murata Manufacturing, Samsung Electro-Mechanics, Taiyo Yuden, TDK Corporation 및 Walsin Technology Corporation(알파벳 순).
기타 혜택
- 엑셀 형식 시장 예측(ME) 시트
- 3개월간의 애널리스트 지원
목차
제1장 주요 요약과 주요 조사 결과
제2장 보고서 제안
제3장 소개
- 조사의 전제조건과 시장 정의
- 조사 범위
- 조사 방법
제4장 주요 산업 동향
- 가전 판매
- 에어컨 판매
- 데스크톱 PC 판매
- 게임기 판매
- 노트북 PC 판매
- 냉장고 판매
- 스마트폰 판매
- 저장 장치 판매
- 태블릿 판매
- TV 판매
- 자동차 생산
- 버스 생산
- 대형 트럭 생산
- 소형 상용차 생산
- 승용차 생산
- 자동차 생산
- 산업용 자동화 매출액
- 산업용 로봇 판매
- 서비스 로봇 판매
- 규제 프레임워크
- 밸류체인과 유통채널 분석
제5장 시장 세분화
- 유전체 유형
- 클래스 1
- 클래스 2
- 케이스 사이즈
- 0 201
- 0 402
- 0 603
- 1 005
- 1 210
- 기타
- 전압
- 500-1000V
- 500V 미만
- 1000V 이상
- 정전용량
- 100-1,000uF
- 100uF 미만
- 1000uF 이상
- MLCC 실장 유형
- 금속 캡
- 방사형 리드
- 표면 실장
- 최종 사용자
- 항공우주 및 방어
- 자동차
- 소비자 가전제품
- 산업
- 의료
- 전력 및 유틸리티
- 통신 기기
- 기타
- 국가명
- 중국
- 인도
- 일본
- 한국
- 기타
제6장 경쟁 구도
- 주요 전략 동향
- 시장 점유율 분석
- 기업 상황
- 기업 프로파일
- Kyocera AVX Components Corporation(Kyocera Corporation)
- Maruwa Co ltd
- Murata Manufacturing Co., Ltd
- Nippon Chemi-Con Corporation
- Samsung Electro-Mechanics
- Samwha Capacitor Group
- Taiyo Yuden Co., Ltd
- TDK Corporation
- Vishay Intertechnology Inc.
- Walsin Technology Corporation
- Wurth Elektronik GmbH & Co. KG
- Yageo Corporation
제7장 CEO에 대한 주요 전략적 질문 CEO에 대한 주요 전략적 질문
제8장 부록
- 세계 개요
- 개요
- Five Forces 분석 프레임워크
- 세계의 밸류체인 분석
- 시장 역학(DROs)
- 출처 및 참고문헌
- 도표 일람
- 주요 인사이트
- 데이터 팩
- 용어집
The Asia-Pacific MLCC Market size is estimated at 13.29 billion USD in 2024, and is expected to reach 35.63 billion USD by 2029, growing at a CAGR of 21.81% during the forecast period (2024-2029).

The demand for 0 201 MLCCs is driven by the growing demand for consumer electronics and medical equipment in the region
- 0 201 emerged as the frontrunner, capturing the largest market share of 46.85%, followed closely by 1 005 with 16.20% and 0 402 with 12.01% in terms of volume in 2022.
- Dielectrics classified as Class 1 can be divided into C0G, X8G, and U2J. The C0G MLCCs with low-mid range capacitance are becoming increasingly popular in the consumer electronic electronics industry, particularly in smartphones, smartwatches, and other devices, due to the increasing trend toward miniaturization in order to achieve sleeker designs.
- Class 2 dielectric MLCCs are classified into X7R, X5R, and Y5V. These dielectrics are an ideal choice for automotive applications due to their ability to withstand high-voltage conditions and the advancement of features such as Automatic Driver Assistance Systems (ADAS), infotainment systems, and improved battery storage capabilities.
Incentives and discounts are driving the increasing demand for electric vehicles, along with the development of consumer electronics such as augmented reality and virtual reality, which is propelling MLCC demand
- In 2022, China emerged as the frontrunner, capturing the largest market share of 24.79%, followed closely by South Korea with 20.31% and Japan with 12.27% in terms of value.
- The Chinese consumer electronics manufacturing industry is one of the most prominent globally. It is anticipated that the Chinese consumer electronics market will experience rapid growth in the future, driven by the introduction of 5G networks, the proliferation of smart homes, augmented and virtual reality technologies, and the continuous evolution of consumer electronic devices with improved features. As a result, the need for installed multi-layer ceramic capacitors MLCCs of surface mount type with 0201 case sizes with low capacitance of less than 100uF is expected to increase accordingly. Incentives and discounts drive the increasing demand for electric vehicles, and the development of consumer electronics such as augmented reality and virtual reality is propelling the MLCC demand.
- The automotive industry is undergoing a period of rapid technological development, which is leading to an increase in the demand for MLCCs. Generally, an engine-driven vehicle without an automated driving feature requires approximately 3,000 MLCCs, while an electric vehicle requires between 8,000 and 10,000 MLCCs. The automotive sector is a major contributor to India's economic growth and can be seen as a benchmark for the current situation. Additionally, Indian government regulations, incentives, discounts, and awareness about e-mobility are driving consumers toward the purchase of electric vehicles, driving the demand for MLCCs.
Asia-Pacific MLCC Market Trends
Development of the E-commerce industry is expected to propel the market
- The light commercial vehicle production was expected to grow from 5.25 million units in 2019 to 5.23 million units in 2022.
- The online commerce and logistics sectors support the market for light commercial vehicles. Owing to increased access to mobile phones and the Internet, there has been an increase in online retail sales and e-commerce. Commercial vehicle sales are expected to increase to improve the timely delivery of goods to clients.
- As a result of COVID-19 online sales, the user base and income of the global e-commerce market greatly expanded. The highest increase in online shopping by individuals in 2020 was caused by the pandemic, which forced individuals to shop online. However, the Asia-Pacific light commercial vehicles witnessed a YoY drop of 11.17% in production in 2020 because of stringent restrictions on e-commerce and travel imposed by the local authorities.
- The production of light commercial vehicles is recovering steadily as governments are taking the initiative to electrify these vehicles. Major regional players are collaborating to develop and manufacture electric trucks.
The rising adoption of electric vehicles is expected to enhance the demand
- The passenger vehicle production was expected to grow from 40.65 million units in 2019 to 42.32 million units in 2022, registering a CAGR of 1.35% during the period.
- The passenger car sector witnessed a drop of 11.88% YoY production in 2020. The pandemic and the Russia-Ukraine war heavily impacted supply chains across the globe, slowing down the production of passenger cars and forcing manufacturers to close production lines temporarily. Economic challenges such as inflation affected demand, as people are postponing large purchases such as cars. However, the market witnessed a slow but steady recovery, with a YoY production growth of 10.83% in 2022.
- The demand for fuel-based passenger vehicles is slowly reducing due to changing government policies concerning CO2 emissions. Governments across the regions are focusing on reducing greenhouse gas emissions by 2030 and achieving net-zero emissions by 2050. To meet this demand, companies and governments are focusing on introducing hybrid or electric cars and installing charging infrastructures directly at public outlets or indirectly through subsidies for private car charging stations in homes and workplaces. Asia-Pacific countries are exhibiting higher growth in the sales of electric vehicles compared to their Western competitors. In the last decade, there has been a significant increase in BEV sales in this region.
- Owing to the aforementioned factors and developments, the adoption of predictive technologies is increasing in the production of passenger vehicles, and such positive trends are expected to enhance the growth of the MLCCs used in these vehicles during the forecast period.
Asia-Pacific MLCC Industry Overview
The Asia-Pacific MLCC Market is fairly consolidated, with the top five companies occupying 72.07%. The major players in this market are Murata Manufacturing Co., Ltd, Samsung Electro-Mechanics, Taiyo Yuden Co., Ltd, TDK Corporation and Walsin Technology Corporation (sorted alphabetically).
Additional Benefits:
- The market estimate (ME) sheet in Excel format
- 3 months of analyst support
TABLE OF CONTENTS
1 EXECUTIVE SUMMARY & KEY FINDINGS
2 REPORT OFFERS
3 INTRODUCTION
- 3.1 Study Assumptions & Market Definition
- 3.2 Scope of the Study
- 3.3 Research Methodology
4 KEY INDUSTRY TRENDS
- 4.1 Consumer Electronics Sales
- 4.1.1 Air Conditioner Sales
- 4.1.2 Desktop PC's Sales
- 4.1.3 Gaming Console Sales
- 4.1.4 Laptops Sales
- 4.1.5 Refrigerator Sales
- 4.1.6 Smartphones Sales
- 4.1.7 Storage Unit Sales
- 4.1.8 Tablets Sales
- 4.1.9 Television Sales
- 4.2 Automotive Production
- 4.2.1 Buses and Coaches Production
- 4.2.2 Heavy Trucks Production
- 4.2.3 Light Commercial Vehicles Production
- 4.2.4 Passenger Vehicles Production
- 4.2.5 Total Motor Production
- 4.3 Industrial Automation Sales
- 4.3.1 Industrial Robots Sales
- 4.3.2 Service Robots Sales
- 4.4 Regulatory Framework
- 4.5 Value Chain & Distribution Channel Analysis
5 MARKET SEGMENTATION (includes market size in Value in USD and Volume, Forecasts up to 2029 and analysis of growth prospects)
- 5.1 Dielectric Type
- 5.1.1 Class 1
- 5.1.2 Class 2
- 5.2 Case Size
- 5.2.1 0 201
- 5.2.2 0 402
- 5.2.3 0 603
- 5.2.4 1 005
- 5.2.5 1 210
- 5.2.6 Others
- 5.3 Voltage
- 5.3.1 500V to 1000V
- 5.3.2 Less than 500V
- 5.3.3 More than 1000V
- 5.4 Capacitance
- 5.4.1 100µF to 1000µF
- 5.4.2 Less than 100µF
- 5.4.3 More than 1000µF
- 5.5 Mlcc Mounting Type
- 5.5.1 Metal Cap
- 5.5.2 Radial Lead
- 5.5.3 Surface Mount
- 5.6 End User
- 5.6.1 Aerospace and Defence
- 5.6.2 Automotive
- 5.6.3 Consumer Electronics
- 5.6.4 Industrial
- 5.6.5 Medical Devices
- 5.6.6 Power and Utilities
- 5.6.7 Telecommunication
- 5.6.8 Others
- 5.7 Country
- 5.7.1 China
- 5.7.2 India
- 5.7.3 Japan
- 5.7.4 South Korea
- 5.7.5 Others
6 COMPETITIVE LANDSCAPE
- 6.1 Key Strategic Moves
- 6.2 Market Share Analysis
- 6.3 Company Landscape
- 6.4 Company Profiles
- 6.4.1 Kyocera AVX Components Corporation (Kyocera Corporation)
- 6.4.2 Maruwa Co ltd
- 6.4.3 Murata Manufacturing Co., Ltd
- 6.4.4 Nippon Chemi-Con Corporation
- 6.4.5 Samsung Electro-Mechanics
- 6.4.6 Samwha Capacitor Group
- 6.4.7 Taiyo Yuden Co., Ltd
- 6.4.8 TDK Corporation
- 6.4.9 Vishay Intertechnology Inc.
- 6.4.10 Walsin Technology Corporation
- 6.4.11 Wurth Elektronik GmbH & Co. KG
- 6.4.12 Yageo Corporation
7 KEY STRATEGIC QUESTIONS FOR MLCC CEOS
8 APPENDIX
- 8.1 Global Overview
- 8.1.1 Overview
- 8.1.2 Porter's Five Forces Framework
- 8.1.3 Global Value Chain Analysis
- 8.1.4 Market Dynamics (DROs)
- 8.2 Sources & References
- 8.3 List of Tables & Figures
- 8.4 Primary Insights
- 8.5 Data Pack
- 8.6 Glossary of Terms
