


|
시장보고서
상품코드
1685800
아시아태평양의 화물 및 물류 시장(2025-2030년) : 시장 점유율 분석, 산업 동향, 통계 및 성장 예측Asia Pacific Freight and Logistics - Market Share Analysis, Industry Trends & Statistics, Growth Forecasts (2025 - 2030) |
||||||
■ 보고서에 따라 최신 정보로 업데이트하여 보내드립니다. 배송일정은 문의해 주시기 바랍니다.
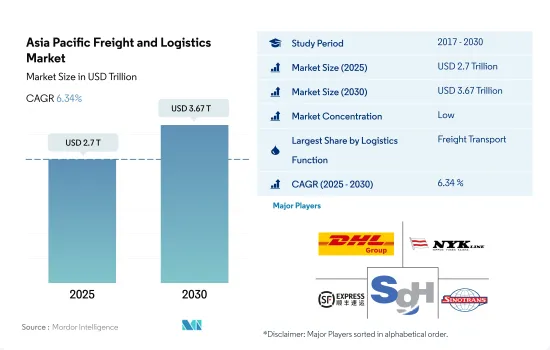
아시아태평양의 화물 및 물류 시장 규모는 2025년에 2조 7,000억 달러로 추정되고, 2030년에는 3조 6,700억 달러에 이를 것으로 예측되며, 예측 기간(2025-2030년) 동안 CAGR 6.34%로 성장할 전망입니다.
아시아 개발 은행이 아시아태평양의 인프라 정비를 지원하여 화물 수송 수요를 뒷받침함
- 2023년 3월부터 중국 절강성의 닝보 근교에 있는 2개의 주요 컨테이너 트럭 야드에서는 3,000대에 가까운 유휴 차량이 발생하고 있으며 항만의 수송량은 현저하게 감소하고 있습니다. 컨테이너의 누적 상황은 중국의 낮은 보관 비용, 팬데믹에 의한 수출 붐 동안 발생한 컨테이너 공급의 급증, 그리고 수출 붐 후에 복귀한 상당수의 컨테이너 등의 요인에 의한 것으로 예상됩니다.
- 아시아 개발 은행(ADB)은 계획, 건설 및 유지보수와 같은 연결 인프라와 관련된 태평양 DMC(신흥 국가)의 노력을 적극적으로 지원하면서 보다 견고하고 지속 가능한 성장 궤도를 촉진하고 있습니다. 향후, 태평양 지역의 운수 부문에 대한 ADB의 투자는 16억 달러를 상회할 것으로 예측되고 2022년부터 2024년에 걸쳐 22개의 프로젝트에 자금을 제공할 예정이며 그 중에는 1억 1,500만 달러에 달하는 상당한 규모의 프로젝트도 있습니다.
아시아태평양 내 지속 가능하고 견고한 화물 및 물류 부문 구축
- 인도에서는 운송 비용이 물류를 지배하고 있으며, 물류 비용 전체의 62%와 GDP의 14%를 차지하고 있습니다. 특히, 석유 수입 비용의 1/4 이상을 차지하고 있는 육상 화물은 2050년까지 4배로 급증할 것으로 예측되고 있습니다. 따라서 인도는 2050년까지 8,380억 리터의 디젤을 절약할 수 있으며 이는 1,401억 7,000만 달러의 석유 지출 절감으로 이어집니다.
- 신규 공급 제한, 시설 노후화, 그리고 온라인 소매의 급증에 의한 소비자의 기호의 변화 등의 요인이 겹쳐, 아시아태평양의 콜드체인 창고에 대한 투자는 2032년까지 연간 50억 달러에 이를 것으로 예측되고 있습니다.
아시아태평양 화물 및 물류 시장 동향
아시아태평양의 화물 수요는 전 세계 해상 무역으로 이어지며, 이는 운송 부문에 대한 투자의 계기가 되고 있습니다.
- 2024년 5월 17일, 일본의 도쿄역에서 개최된 박람회에서는 고속 여객 열차를 경량 화물에 이용하는 추세가 확산되고 있음이 강조되었습니다. 차량을 사용한 니가타발 도쿄행의 당일 배송 서비스가 운영되고 있으며 신선식품, 과자류, 음료, 꽃, 정밀 부품, 의료품 등의 품목이 운송되고 있습니다.
- 제14차 5개년 계획(2021-2025년)에서 중국은 교통망 확대의 목표를 밝혔습니다. 2025년까지 고속철도를 38,000km에서 50,000km로 연장하여 인구 50만명 이상의 도시의 95%를 250km 노선으로 연결할 계획입니다. 또한 철도를 165,000km, 민간공항을 270곳 이상, 도시지하철을 10,000km, 고속도로를 190,000km, 그리고 고속 내수로를 18,500km로 증설하는 것을 목표로 하고 있습니다.
세계적인 불확실성으로 인해 대부분의 국가가 석유의 순수입국인 아시아에서 원유 가격이 상승하고 있습니다.
- 2023년 중국의 원유 수입량은 11% 증가한 5억 6,399만 MT에 이르렀으며 이는 러시아-우크라이나 전쟁에 의한 세계적인 원유 가격의 상승이 원인이었습니다. 2024년 초에 중국은 일찍이 가격 하락 상황을 이용했기 때문에 수입량은 전년 대비 5.1% 증가한 8,831만 톤에 달했습니다. 브렌트 선물은 2023년 9월에 97.69달러로 피크를 맞았고, 12월에는 72.29달러까지 하락했으며, 2024년 3월에는 84.05달러까지 상승했습니다. OPEC가 2024년 3월에 감산 연장을 결정함에 따라 가격이 더욱 상승하면서 세계 수요에 대한 우려가 높아져 2024년 하반기 중국 수입이 둔화되었습니다.
- 호주 연방 정부는 2025년 1월 1일부터 승용차와 소형 상용차의 새로운 연비 기준을 도입합니다. 이것은 새로운 법의 초안에 앞서 1개월간의 협의 기간을 거친 것입니다. 2023년 예산의 일부로 발표되었고 2023년 4월에 발표된 EV 전략과 연동하는 이 기준은 자동차 제조업체에 평균 CO2 목표를 제시합니다. 이러한 목표는 서서히 낮아질 전망이며 보다 연비가 좋고 배출량이 적은 가스차 및 전기차의 생산이 요구됩니다.
아시아태평양 화물 및 물류 산업 개요
아시아태평양의 화물 및 물류 시장은 세분화되고 있으며, DHL Group, NYK (Nippon Yusen Kaisha) Line, SF Express (KEX-SF), SG Holdings Co., Ltd., 그리고 SINOTRANS(알파벳순)가 주요 5개사입니다.
기타 혜택
- 엑셀 형식 시장 예측(ME) 시트
- 3개월간의 애널리스트 지원
목차
제1장 주요 요약과 주요 조사 결과
제2장 보고서 제안
제3장 소개
- 조사의 전제조건과 시장 정의
- 조사 범위
- 조사 방법
제4장 주요 산업 동향
- 인구 동태
- 경제활동별 GDP 분포
- 경제활동별 GDP 성장률
- 인플레이션율
- 경제성과 및 프로파일
- 전자상거래 산업의 동향
- 제조업의 동향
- 운수 및 창고업의 GDP
- 수출 동향
- 수입 동향
- 연료 가격
- 트럭 운송 비용
- 유형별 트럭 보유 대수
- 물류 실적
- 주요 트럭 공급업체
- 수단 분담률
- 해상화물 운송 능력
- 정기선 해운 연계
- 기항지 및 실적
- 운임 동향
- 화물 톤수 동향
- 인프라
- 규제 프레임워크(도로 및 철도)
- 호주
- 중국
- 인도
- 인도네시아
- 일본
- 말레이시아
- 태국
- 베트남
- 규제 프레임워크(해상 및 항공)
- 호주
- 중국
- 인도
- 인도네시아
- 일본
- 말레이시아
- 태국
- 베트남
- 밸류체인과 유통채널 분석
제5장 시장 세분화
- 최종 사용자 산업
- 농업, 어업, 임업
- 건설업
- 제조업
- 석유 및 가스, 광업, 채석업
- 도매 및 소매업
- 기타
- 물류 기능
- 택배, 특급 및 소포(CEP)
- 목적지별
- 국내
- 국제
- 화물 수송
- 수송 수단별
- 항공
- 해상 및 내수로
- 기타
- 화물 수송
- 수송 수단별
- 항공
- 파이프라인
- 철도
- 도로
- 해상 및 내수로
- 창고 보관
- 온도 제어 기능별
- 온도 제어 불가능
- 온도 제어 가능
- 기타 서비스
- 택배, 특급 및 소포(CEP)
- 국가명
- 호주
- 중국
- 인도
- 인도네시아
- 일본
- 말레이시아
- 태국
- 베트남
- 기타 아시아태평양
제6장 경쟁 구도
- 주요 전략 동향
- 시장 점유율 분석
- 기업 상황
- 기업 프로파일
- Alps Logistics
- CH Robinson
- Deutsche Bahn AG(including DB Schenker)
- DHL Group
- DP World
- DSV A/S(De Sammensluttede Vognmaend af Air and Sea)
- Expeditors International of Washington, Inc.
- FedEx
- Kuehne Nagel
- NYK(Nippon Yusen Kaisha) Line
- SF Express(KEX-SF)
- SG Holdings Co., Ltd.
- SINOTRANS
- United Parcel Service of America, Inc.(UPS)
제7장 CEO에 대한 주요 전략적 질문
제8장 부록
- 세계 개요
- 개요
- Porter's Five Forces 분석 프레임워크
- 세계의 밸류체인 분석
- 시장 역학(시장 성장 촉진요인, 억제요인 및 기회)
- 기술의 진보
- 정보원과 참고문헌
- 도표 목록
- 주요 인사이트
- 데이터 팩
- 용어집
- 환율
The Asia Pacific Freight and Logistics Market size is estimated at 2.7 trillion USD in 2025, and is expected to reach 3.67 trillion USD by 2030, growing at a CAGR of 6.34% during the forecast period (2025-2030).

Asian Development Bank assists the infrastructure development in the country, boosting freight transport demand
- Since March 2023, two major container truck yards in Zhejiang province, China, near Ningbo, have grappled with an excess of nearly 3,000 idle vehicles. These yards, Hengpu and Beilun, are closely tied to the port's operations. However, they have experienced a notable decline in traffic over the past two years. The accumulation of containers can be attributed to factors such as China's low storage costs, a surge in container supply during the pandemic's export boom, and a significant number of containers returning after the boom subsided.
- The Asian Development Bank (ADB) is actively supporting Pacific DMCs (Developing Member Countries) in their endeavors related to connectivity infrastructure, including planning, construction, and maintenance. Transport projects alone account for over 59% of the ADB's portfolio in the Pacific. This robust support from the ADB is fostering a more robust and sustainable growth trajectory in the Pacific region. Looking ahead, ADB's investments in the Pacific's transportation sector are projected to surpass USD 1.6 billion, with 22 projects slated for funding during 2022-2024, including a notable USD 115 million in co-financing.
Building a sustainable and resilient freight and logistics sector in the Asia Pacific region
- In India, transportation costs dominate the logistics landscape, accounting for 62% of overall logistics costs and 14% of the country's GDP. Given that diesel fuel costs make up the lion's share of transportation expenses, the adoption of zero-emission trucks (ZETs) can significantly slash fuel costs by up to 46% over the vehicle's lifespan. This has far-reaching implications for India's economy. Notably, road freight, which already accounts for over a quarter of oil import expenses, is projected to surge fourfold by 2050. By embracing ZETs, India could potentially save a staggering 838 billion liters of diesel by 2050, translating to a reduction of USD 140.17 billion in oil expenditures.
- With a confluence of factors such as limited new supply, outdated facilities, and evolving consumer preferences driven by the surge in online retail, investments in cold storage properties in the Asia-Pacific were projected to hit USD 5 billion annually by 2032. This surge is primarily driven by the escalating demand for cold chain warehousing in the region.
Asia Pacific Freight and Logistics Market Trends
Asia Pacific freight demands driven by global seaborne trade, which is triggering transport sector investments
- On May 17, 2024, a fair at Tokyo Station in Japan highlighted the growing use of high-speed passenger trains for light freight. This shift, driven by a shortage of commercial drivers and new overtime laws, has increased road delivery costs by up to 20%. Since August 2023, JR East has been running a same-day delivery service from Niigata to Tokyo using a dedicated 12-car Series E trainset. Items transported include fresh food, confectionery, drinks, flowers, precision components, and medical supplies. In September 2023, JR East launched a freight-only service on the Tohoku Shinkansen and now offers Hakobyun-branded freight services across its high-speed and Limited Express networks.
- In the 14th Five-Year Plan (2021-2025), China revealed goals for expanding its transportation network. By 2025, high-speed railways will extend to 50,000 kms, up from 38,000 kms in 2020, with 95% of cities with populations above 500,000 covered by 250-km lines. The country aims to increase its railway length to 165,000 kms, civil airports to over 270, subway lines in cities to 10,000 kms, expressways to 190,000 kms, and high-level inland waterways to 18,500 kms by 2025. The primary objective is to achieve integrated development by 2025, emphasizing advancements in the transformation of the transportation system and its contribution to GDP.
Owing to global uncertainties, crude oil prices are soaring in the Asian economies as most of them are net oil importers
- In 2023, China's crude oil imports rose by 11% to 563.99 MMT, driven by higher global oil prices due to the Russia-Ukraine War. In early 2024, imports increased by 5.1% YoY, reaching 88.31 MMT, as China capitalized on lower prices earlier. Brent futures peaked at USD 97.69 in September 2023, dropped to USD 72.29 in December, and rose to USD 84.05 by March 2024. OPEC+'s decision in March 2024 to extend output cuts has further boosted prices, raising concerns about global demand and potentially slowing China's imports in H2 2024.
- Australia's federal government will introduce a new fuel efficiency standard for passenger and light commercial vehicles starting January 1, 2025. This follows a one-month consultation period before drafting the new laws. Announced as part of the 2023 budget and linked to the EV strategy released in April 2023, the standard sets average CO2 targets for vehicle manufacturers. These targets will gradually decrease, requiring the production of more fuel-efficient and low or zero-emissions vehicles.
Asia Pacific Freight and Logistics Industry Overview
The Asia Pacific Freight and Logistics Market is fragmented, with the major five players in this market being DHL Group, NYK (Nippon Yusen Kaisha) Line, SF Express (KEX-SF), SG Holdings Co., Ltd. and SINOTRANS (sorted alphabetically).
Additional Benefits:
- The market estimate (ME) sheet in Excel format
- 3 months of analyst support
TABLE OF CONTENTS
1 EXECUTIVE SUMMARY & KEY FINDINGS
2 REPORT OFFERS
3 INTRODUCTION
- 3.1 Study Assumptions & Market Definition
- 3.2 Scope of the Study
- 3.3 Research Methodology
4 KEY INDUSTRY TRENDS
- 4.1 Demographics
- 4.2 GDP Distribution By Economic Activity
- 4.3 GDP Growth By Economic Activity
- 4.4 Inflation
- 4.5 Economic Performance And Profile
- 4.5.1 Trends in E-Commerce Industry
- 4.5.2 Trends in Manufacturing Industry
- 4.6 Transport And Storage Sector GDP
- 4.7 Export Trends
- 4.8 Import Trends
- 4.9 Fuel Price
- 4.10 Trucking Operational Costs
- 4.11 Trucking Fleet Size By Type
- 4.12 Logistics Performance
- 4.13 Major Truck Suppliers
- 4.14 Modal Share
- 4.15 Maritime Fleet Load Carrying Capacity
- 4.16 Liner Shipping Connectivity
- 4.17 Port Calls And Performance
- 4.18 Freight Pricing Trends
- 4.19 Freight Tonnage Trends
- 4.20 Infrastructure
- 4.21 Regulatory Framework (Road and Rail)
- 4.21.1 Australia
- 4.21.2 China
- 4.21.3 India
- 4.21.4 Indonesia
- 4.21.5 Japan
- 4.21.6 Malaysia
- 4.21.7 Thailand
- 4.21.8 Vietnam
- 4.22 Regulatory Framework (Sea and Air)
- 4.22.1 Australia
- 4.22.2 China
- 4.22.3 India
- 4.22.4 Indonesia
- 4.22.5 Japan
- 4.22.6 Malaysia
- 4.22.7 Thailand
- 4.22.8 Vietnam
- 4.23 Value Chain & Distribution Channel Analysis
5 MARKET SEGMENTATION (includes 1. Market value in USD for all segments 2. Market volume for select segments viz. freight transport, CEP (courier, express, and parcel) and warehousing & storage 3. Forecasts up to 2030 and analysis of growth prospects)
- 5.1 End User Industry
- 5.1.1 Agriculture, Fishing, and Forestry
- 5.1.2 Construction
- 5.1.3 Manufacturing
- 5.1.4 Oil and Gas, Mining and Quarrying
- 5.1.5 Wholesale and Retail Trade
- 5.1.6 Others
- 5.2 Logistics Function
- 5.2.1 Courier, Express, and Parcel (CEP)
- 5.2.1.1 By Destination Type
- 5.2.1.1.1 Domestic
- 5.2.1.1.2 International
- 5.2.2 Freight Forwarding
- 5.2.2.1 By Mode Of Transport
- 5.2.2.1.1 Air
- 5.2.2.1.2 Sea and Inland Waterways
- 5.2.2.1.3 Others
- 5.2.3 Freight Transport
- 5.2.3.1 By Mode Of Transport
- 5.2.3.1.1 Air
- 5.2.3.1.2 Pipelines
- 5.2.3.1.3 Rail
- 5.2.3.1.4 Road
- 5.2.3.1.5 Sea and Inland Waterways
- 5.2.4 Warehousing and Storage
- 5.2.4.1 By Temperature Control
- 5.2.4.1.1 Non-Temperature Controlled
- 5.2.4.1.2 Temperature Controlled
- 5.2.5 Other Services
- 5.2.1 Courier, Express, and Parcel (CEP)
- 5.3 Country
- 5.3.1 Australia
- 5.3.2 China
- 5.3.3 India
- 5.3.4 Indonesia
- 5.3.5 Japan
- 5.3.6 Malaysia
- 5.3.7 Thailand
- 5.3.8 Vietnam
- 5.3.9 Rest of Asia Pacific
6 COMPETITIVE LANDSCAPE
- 6.1 Key Strategic Moves
- 6.2 Market Share Analysis
- 6.3 Company Landscape
- 6.4 Company Profiles (includes Global Level Overview, Market Level Overview, Core Business Segments, Financials, Headcount, Key Information, Market Rank, Market Share, Products and Services, and Analysis of Recent Developments).
- 6.4.1 Alps Logistics
- 6.4.2 C.H. Robinson
- 6.4.3 Deutsche Bahn AG (including DB Schenker)
- 6.4.4 DHL Group
- 6.4.5 DP World
- 6.4.6 DSV A/S (De Sammensluttede Vognmaend af Air and Sea)
- 6.4.7 Expeditors International of Washington, Inc.
- 6.4.8 FedEx
- 6.4.9 Kuehne+Nagel
- 6.4.10 NYK (Nippon Yusen Kaisha) Line
- 6.4.11 SF Express (KEX-SF)
- 6.4.12 SG Holdings Co., Ltd.
- 6.4.13 SINOTRANS
- 6.4.14 United Parcel Service of America, Inc. (UPS)
7 KEY STRATEGIC QUESTIONS FOR FREIGHT AND LOGISTICS CEOS
8 APPENDIX
- 8.1 Global Overview
- 8.1.1 Overview
- 8.1.2 Porter's Five Forces Framework
- 8.1.3 Global Value Chain Analysis
- 8.1.4 Market Dynamics (Market Drivers, Restraints & Opportunities)
- 8.1.5 Technological Advancements
- 8.2 Sources & References
- 8.3 List of Tables & Figures
- 8.4 Primary Insights
- 8.5 Data Pack
- 8.6 Glossary of Terms
- 8.7 Currency Exchange Rate


샘플 요청 목록