


|
시장보고서
상품코드
1692141
미국의 LTL(Less-than-truckload) 시장 : 시장 점유율 분석, 산업 동향, 성장 예측(2025-2030년)United States Less than-Truck-Load (LTL) - Market Share Analysis, Industry Trends & Statistics, Growth Forecasts (2025 - 2030) |
||||||
■ 보고서에 따라 최신 정보로 업데이트하여 보내드립니다. 배송일정은 문의해 주시기 바랍니다.
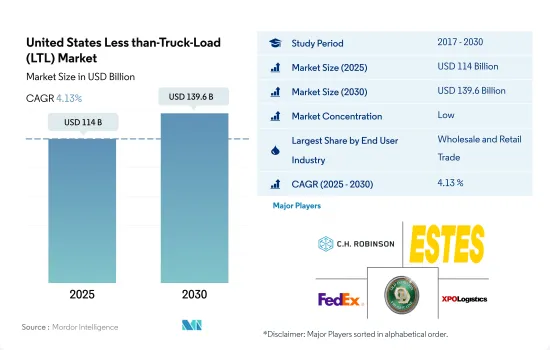
미국의 LTL(Less-than-truckload) 시장 규모는 2025년에 1,140억 달러로 추정되고, 2030년에는 1,396억 달러에 이를 전망이며, 예측 기간(2025-2030년) 중 CAGR은 4.13%로 성장할 것으로 예측됩니다.
전자상거래 붐과 온라인 구매자 증가는 LTL 시장 성장을 지원한다.
- 2024년 6월, 노르웨이의 태양전지 회사 NorSun이 오클라호마주 털사에 6억 2,000만 달러를 투자한다고 발표한 것으로, 미국의 제조업은 큰 발전을 이루었습니다. 이는 놀산에 있어 미국 최초의 제조 공장이며, 5GW의 실리콘 잉곳과 솔라 웨이퍼의 생산에 초점을 맞추고 있습니다. 이 투자는 미국산 신재생 에너지 부품에 대한 수요 증대를 강조하는 것으로, 이 분야를 크게 뒷받침하는 것입니다. 제조 부문에 있어서의 이러한 개발은, LTL 서비스의 수요를 촉진하고 있습니다.
- 향후 수년간은 미국의 건설 부문이 2024-2028년 CAGR 4.7%로 예상하고 있기 때문에 소량 화물 운송 시장의 건설 부문이 크게 성장할 것으로 예측됩니다. 운송, 전력, 광대역 인프라 프로젝트에 대한 투자 증가가 이 성장을 뒷받침합니다. 또한 미국 정부의 새로운 인프라 정책과 국내 제조업을 뒷받침하는 노력이 제조업 최종 사용자 분야를 뒷받침할 것으로 기대되고 있습니다.
미국의 LTL(Less-than-truckload) 시장 동향
미국은 인프라와 공급망 투자가 견인해, 지역 GDP에 86%의 기여로 리드
- 2024년 9월 미국 운수부 산하의 FAA는 519개 프로젝트에 19억 달러의 보조금을 할당했습니다. 이 프로젝트들은 48개 주, 괌, 푸에르토리코, 기타 영토에 걸쳐 있으며 모두 공항 개선 프로그램(AIP)의 일부입니다. 게다가 2023년 추가 재량 보조금으로 2억 6,900만 달러가 미국 내 56개 공항에서 62개 프로젝트를 지원합니다. 이 경쟁 이니셔티브는 미국의 공항 시스템을 강화하기 위해 공항 소유자와 운영자를 지원하는 것입니다. 지금까지 최대 규모가 되는 이 제5회 AIP 보조금 사이클은 공항의 안전성과 지속 가능성 향상에서 소음 경감까지 다양한 프로젝트에 자금이 제공됩니다. 조성금은 규모에 관계없이 미국 전역의 공항을 대상으로 하고 있습니다.
- 인프라 개발과 전자상거래 붐으로 인해 운수 및 창고 부문은 고용 급증이 예상되고 있습니다. 노동통계국(BLS)은 2022-2032년 연간 성장률을 0.8%로 예측하고 있으며, 이는 약 57만 명의 신규 고용에 해당합니다. 주목할 만한 것은 창고 및 보관업과 함께 택배 및 메신저업이 이 고용 증가의 약 80%를 견인할 것으로 예상되고 있다는 점입니다.
미국은 2022년도 원유의 순수입국이며 80개국에서 약 628만 B/D의 원유를 수입합니다.
- 미국의 휘발유 가격은 대통령 선거 직전인 2024년 10월까지 3년 이상 만에 1갤런당 3달러를 밑돌 것으로 예측됩니다. 연료 가격의 저하는 주로 수요의 감퇴와 유가의 하락에 의한 것으로, 인플레이션을 부추기는 고비용에 직면하고 있던 소비자에게 안도감을 줍니다. 이는 또한 카말라 해리스 부통령과 다른 민주당 의원들이 높은 휘발유 가격에 대한 공화당의 비판에 맞서는 데 도움이 될 것으로 보입니다. 2024년 9월 휘발유 평균 가격은 갤런당 3.25달러로 지난달보다 19센트, 지난해보다 58센트 내렸습니다.
- 미국에너지정보국(EIA)에 따르면 2024년 원유 가격은 2023년에 비해 평평하고 2025년에는 하락합니다. 미국은 2023년 새로운 정제설비를 도입하기 위해 가동능력이 향상되고 2024년과 2025년 석유제품 가격에 대한 변형이 완화됩니다. 나아가 중동, 특히 쿠웨이트가 새로운 국제 정제 능력을 추가해 휘발유와 디젤의 세계 가격 압력을 완화하는 데 도움이 될 것으로 보입니다. 또한 2024년 크랙 스프레드 축소는 2024년과 2025년 모두 미국의 평균 소매 연료 가격 하락으로 이어질 것으로 예상됩니다. 휘발유 가격은 2024년에 3.36달러/갤런, 2025년에 3.24달러/갤런으로 예측됩니다.
미국의 LTL(Less-than-truckload) 산업 개요
미국의 LTL(Less-than-truckload) 시장은 단편화되고 있으며, 이 시장의 주요 기업은 CH Robinson, Estes Express Lines, FedEx, Old Dominion Freight Line, XPO, Inc.의 5개사입니다(알파벳순 정렬).
기타 혜택 :
- 엑셀 형식 시장 예측(ME) 시트
- 3개월간의 애널리스트 서포트
목차
제1장 주요 요약과 주요 조사 결과
제2장 보고서 제안
제3장 서문
- 조사의 전제조건 및 시장 정의
- 조사 범위
- 조사 방법
제4장 주요 산업 동향
- 경제 활동별 GDP 분포
- 경제 활동별 GDP 성장률
- 경제성과 및 프로파일
- 전자상거래 산업의 동향
- 제조업의 동향
- 운수 및 창고업의 GDP
- 물류 실적
- 도로 길이
- 수출 동향
- 수입 동향
- 연료 가격 동향
- 트럭 운송 비용
- 유형별 트럭 보유 대수
- 주요 트럭 공급업체
- 도로화물 톤수의 동향
- 도로화물 가격 동향
- 모달 점유율
- 인플레이션율
- 규제 프레임워크
- 밸류체인 및 유통채널 분석
제5장 시장 세분화
- 최종 사용자 산업별
- 농업, 어업 및 임업
- 건설업
- 제조업
- 석유 및 가스, 광업, 채석업
- 도매 및 소매업
- 기타
- 수출처별
- 국내
- 해외
제6장 경쟁 구도
- 주요 전략 동향
- 시장 점유율 분석
- 기업 상황
- 기업 프로파일
- A. Duie Pyle, Inc.
- ArcBest
- Averitt Express, Inc.
- CH Robinson
- Day & Ross
- Daylight Transport, LLC
- Dayton Freight Lines, Inc.
- DHL Group
- Estes Express Lines
- Fastfrate Inc.
- FedEx
- Knight-Swift Transportation Holdings Inc.
- Landstar System Inc.
- Oak Harbor Freight Lines, Inc.
- Old Dominion Freight Line
- Pitt Ohio Transportation Group
- RL Carriers, Inc.
- Roadrunner Freight
- Saia Inc.
- Schneider National, Inc.
- Southeastern Freight Lines
- TFI International Inc.
- United Parcel Service of America, Inc.(UPS)
- Ward Transport and Logistics Corporation
- Werner Enterprises Inc.
- XPO, Inc.
제7장 CEO에 대한 주요 전략적 질문
제8장 부록
- 세계 물류 시장 개요
- 개요
- Porter's Five Forces 분석 프레임워크
- 세계 밸류체인 분석
- 시장 역학(시장 성장 촉진요인, 억제요인, 기회)
- 정보원 및 참고문헌
- 도표 일람
- 주요 인사이트
- 데이터 팩
- 용어집
- 환율
The United States Less than-Truck-Load (LTL) Market size is estimated at 114 billion USD in 2025, and is expected to reach 139.6 billion USD by 2030, growing at a CAGR of 4.13% during the forecast period (2025-2030).
E-commerce boom and rising online buyers supporting the growth of the LTL market
- In June 2024, the United States manufacturing sector saw significant developments, highlighted by Norwegian solar company NorSun's announcement of a USD 620 million investment in Tulsa, Oklahoma. This marks NorSun's first U.S. manufacturing plant, focused on producing 5 GW of silicon ingots and solar wafers. This investment underscores the increasing demand for American-made renewable energy components and significantly boosts the sector. These developments in the manufacturing sector are driving the demand for LTL services.
- In the coming years, the construction segment of the less-than-truckload market is projected to experience significant growth, driven by the United States construction sector's expected CAGR of 4.7% from 2024 to 2028. Increased investments in transport, electricity, and broadband infrastructure projects bolster this growth. Also, the US government's new infrastructure policies and efforts to boost domestic manufacturing are expected to boost the manufacturing end-user segment.
United States Less than-Truck-Load (LTL) Market Trends
United States leads regional GDP with 86% contribution, driven by infrastructure and supply chain investments
- In September 2024, the FAA, under the US Department of Transportation, allocated USD 1.9 billion in grants for 519 projects. These projects span 48 states, Guam, Puerto Rico, and other territories, all part of the Airport Improvement Program (AIP). Additionally, USD 269 million in Supplemental Discretionary Grants for 2023 will back 62 projects at 56 U.S. airports. This competitive initiative aids airport owners and operators in enhancing the U.S. airport system. Marking its largest round yet, this fifth AIP grant cycle funds diverse projects, from airport safety and sustainability upgrades to noise reduction. The grants cater to airports nationwide, regardless of size.
- With infrastructure development and the e-commerce boom, the transportation and storage sector is set for a job surge. The Bureau of Labor Statistics (BLS) projects a 0.8% annual growth rate from 2022 to 2032, translating to nearly 570,000 new jobs. Notably, the couriers and messengers industry, alongside warehousing and storage, is expected to drive about 80% of this job growth.
The United States remained a net crude oil importer in 2022, importing about 6.28 million bpd of crude oil from 80 countries
- Gasoline prices in the US are expected to drop below USD 3 a gallon for the first time in over three years by October 2024, just before the presidential election. Lower fuel prices are mainly due to weaker demand and falling oil prices, providing relief to consumers who have faced high costs that fueled inflation. This could also help Vice President Kamala Harris and other Democrats counter Republican criticism over high gas prices. In September 2024, the average price for regular gas was USD 3.25 a gallon, down 19 cents from last month and 58 cents from last year.
- According to US Energy Information Administration (EIA), crude oil prices will stay steady in 2024 compared to 2023, then decrease in 2025. The US' introduction of new refining capacities in 2023 will boost its operable capacity, alleviating price strain on oil products in 2024 and 2025. Furthermore, the Middle East, particularly Kuwait, will add new international refining capacities, which will help ease global price pressure on gasoline and diesel. Also, it is expected, narrowing crack spreads in 2024 are likely to lead to lower average US retail fuel prices in both 2024 and 2025. Gasoline prices are projected to USD 3.36/gal in 2024 and USD 3.24/gal in 2025.
United States Less than-Truck-Load (LTL) Industry Overview
The United States Less than-Truck-Load (LTL) Market is fragmented, with the major five players in this market being C.H. Robinson, Estes Express Lines, FedEx, Old Dominion Freight Line and XPO, Inc. (sorted alphabetically).
Additional Benefits:
- The market estimate (ME) sheet in Excel format
- 3 months of analyst support
TABLE OF CONTENTS
1 EXECUTIVE SUMMARY & KEY FINDINGS
2 REPORT OFFERS
3 INTRODUCTION
- 3.1 Study Assumptions & Market Definition
- 3.2 Scope of the Study
- 3.3 Research Methodology
4 KEY INDUSTRY TRENDS
- 4.1 GDP Distribution By Economic Activity
- 4.2 GDP Growth By Economic Activity
- 4.3 Economic Performance And Profile
- 4.3.1 Trends in E-Commerce Industry
- 4.3.2 Trends in Manufacturing Industry
- 4.4 Transport And Storage Sector GDP
- 4.5 Logistics Performance
- 4.6 Length Of Roads
- 4.7 Export Trends
- 4.8 Import Trends
- 4.9 Fuel Pricing Trends
- 4.10 Trucking Operational Costs
- 4.11 Trucking Fleet Size By Type
- 4.12 Major Truck Suppliers
- 4.13 Road Freight Tonnage Trends
- 4.14 Road Freight Pricing Trends
- 4.15 Modal Share
- 4.16 Inflation
- 4.17 Regulatory Framework
- 4.18 Value Chain & Distribution Channel Analysis
5 MARKET SEGMENTATION (includes market size in Value in USD, Forecasts up to 2030 and analysis of growth prospects)
- 5.1 End User Industry
- 5.1.1 Agriculture, Fishing, and Forestry
- 5.1.2 Construction
- 5.1.3 Manufacturing
- 5.1.4 Oil and Gas, Mining and Quarrying
- 5.1.5 Wholesale and Retail Trade
- 5.1.6 Others
- 5.2 Destination
- 5.2.1 Domestic
- 5.2.2 International
6 COMPETITIVE LANDSCAPE
- 6.1 Key Strategic Moves
- 6.2 Market Share Analysis
- 6.3 Company Landscape
- 6.4 Company Profiles
- 6.4.1 A. Duie Pyle, Inc.
- 6.4.2 ArcBest
- 6.4.3 Averitt Express, Inc.
- 6.4.4 C.H. Robinson
- 6.4.5 Day & Ross
- 6.4.6 Daylight Transport, LLC
- 6.4.7 Dayton Freight Lines, Inc.
- 6.4.8 DHL Group
- 6.4.9 Estes Express Lines
- 6.4.10 Fastfrate Inc.
- 6.4.11 FedEx
- 6.4.12 Knight-Swift Transportation Holdings Inc.
- 6.4.13 Landstar System Inc.
- 6.4.14 Oak Harbor Freight Lines, Inc.
- 6.4.15 Old Dominion Freight Line
- 6.4.16 Pitt Ohio Transportation Group
- 6.4.17 R+L Carriers, Inc.
- 6.4.18 Roadrunner Freight
- 6.4.19 Saia Inc.
- 6.4.20 Schneider National, Inc.
- 6.4.21 Southeastern Freight Lines
- 6.4.22 TFI International Inc.
- 6.4.23 United Parcel Service of America, Inc. (UPS)
- 6.4.24 Ward Transport and Logistics Corporation
- 6.4.25 Werner Enterprises Inc.
- 6.4.26 XPO, Inc.
7 KEY STRATEGIC QUESTIONS FOR ROAD FREIGHT CEOS
8 APPENDIX
- 8.1 Global Logistics Market Overview
- 8.1.1 Overview
- 8.1.2 Porter's Five Forces Framework
- 8.1.3 Global Value Chain Analysis
- 8.1.4 Market Dynamics (Market Drivers, Restraints & Opportunities)
- 8.2 Sources & References
- 8.3 List of Tables & Figures
- 8.4 Primary Insights
- 8.5 Data Pack
- 8.6 Glossary of Terms
- 8.7 Currency Exchange Rate


샘플 요청 목록