
|
시장보고서
상품코드
1692549
유럽의 국경 간 도로 화물운송 : 시장 점유율 분석, 산업 동향 및 통계, 성장 예측(2025-2030년)Europe Cross Border Road Freight Transport - Market Share Analysis, Industry Trends & Statistics, Growth Forecasts (2025 - 2030) |
||||||
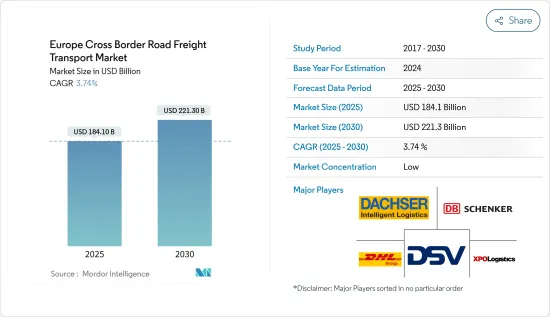
유럽의 국경 간 도로 화물운송 시장 규모는 2024년에 1,767억 4,000만 달러로 추정되고, 2030년에는 2,213억 달러에 이를 것으로 예측되며, 예측 기간 중(2024-2030년) CAGR은 3.82%를 나타낼 것으로 예측됩니다.

유럽의 자동차 시장은 2020-2030년에 걸쳐 CAGR 3.38%로 성장할 전망
- 유럽의 자동차 산업은 호황을 누리고 있으며 향후 유럽의 성장과 번영을 이끄는 글로벌 리더이자 원동력이 될 것으로 예상됩니다. 또한 유럽의 자동차 시장은 2020년부터 2030년까지 3.38%의 연평균 성장률을 기록하며 2030년에는 2,159만 대에 달할 것으로 예상됩니다.
- Brexit은 2021년 1월 1일에 발생하여 발생하면서 국경 제약이 강화되었고, 여러 소매업체와 기업이 영국으로부터의 배송을 줄이거나 지연해야 했습니다. 프랑스에서도 여러 고객이 다른 온라인 주문에 대한 배송 문제를 겪고 2021년에 크리스마스 소포를 받는 데 지연이 발생하면서 브렉시트의 영향이 느껴졌습니다. 그러나 유럽 연합의 총 소매 무역 판매량 지수는 2021년에 전년 대비 5.47% 증가했습니다.
- 유럽의 국경 간 도로 화물 운송 시장의 건설 부문은 2022년부터 2025년까지 연평균 2.1% 성장할 것으로 예상되는 스웨덴 건설 산업과 함께 성장할 것으로 예상되며, 인프라 및 주거 산업의 지속적인 성장이 상업 부문의 감소를 상쇄할 것으로 전망됩니다.
국경 간 B2C 전자상거래 시장은 유럽에서 국경 간 운송에 대한 수요를 증가
- 북유럽의 국경 간 B2C(기업과 소비자 간) 전자상거래 시장은 급성장하고 있습니다. 전체 전자상거래 매출 중 스웨덴의 B2C 전자상거래 해외 점유율은 2022년 전체 시장 점유율의 49.4%에 달해 가장 높습니다. 마찬가지로 국경 간 전자상거래는 스페인의 국제 도로 화물 운송 시장의 성장을 촉진하는 주요 요인으로 작용했습니다. 예를 들어, 2021년에 스페인에 등록된 대부분의 온라인 쇼핑이 국경을 넘나들면서 국제 도로 화물 운송 시장은 회복세를 보였습니다. 2021년 온라인 쇼핑의 55.4%가 스페인 외부의 전자상거래 웹사이트에서 이루어졌습니다.
- 국경을 넘는 운송 측면에서 영국은 다른 유럽 국가들과 강력한 국경 관계를 맺고 있습니다. 2022년 영국에 등록된 HGV 차량이 국제적으로 영국을 오가는 화물 운송량은 660만 톤으로 전년 대비 26% 성장했습니다. 2022년 중국은 러시아의 주요 무역 파트너 중 하나였습니다.
- 영국 정부는 2040년까지 전기 트럭으로 전환하고 도로 화물에서 순 배출량 제로를 달성하기 위한 행동 계획을 수립했습니다. 또한 2035년까지 3.5톤에서 26톤 사이의 무공해 대형 화물차 판매를 종료하고 2040년까지 모든 무공해 대형 화물차 판매를 중단하는 것을 목표로 하고 있습니다. 프랑스 정부는 약 200만 대의 전기 및 하이브리드 차량 생산을 지원하기 위해 프랑스 2030 투자 계획의 틀 내에서 도로 화물 산업을 강화하기 위해 25억 유로(26억 6,000만 달러)를 투자하고 있습니다.
유럽의 국경 간 도로 화물운송 시장 동향
유럽 연합(EU), 경기 회복을 뒷받침하는 135개 운송 프로젝트에 57억 6,000만 달러를 할당 예정
- 운송 및 창고 부문은 다양한 산업 전반의 운영을 지원하는 데 중요한 역할을 하며, 독일이 프랑스와 영국을 제치고 선두를 달리고 있습니다. 전 세계적으로 독일은 상품 수입과 수출 모두에서 3위를 차지하고 있습니다. 독일 연방 정부는 2022년에 연방 고속도로에 120억 유로(128억 8,000만 달러), 수로에 약 17억 유로(18억 1,000만 달러)를 배정하는 등 교통 인프라에 대한 투자를 확대할 의사를 밝히며 교통망 개선에 대한 의지를 보여주었습니다.
- 독일 정부는 도로망보다 철도에 더 많은 투자를 할 계획입니다. 니더작센, 함부르크, 브레멘, 메클렌부르크-서부 포메르니아, 슐레스비히홀슈타인은 DB와 협력하여 2030년까지 철도 네트워크 현대화에 투자하고 있습니다.
- 2022년에 유럽연합은 약 135개의 교통 인프라 프로젝트에 54억 유로의 보조금을 승인했습니다. 이러한 프로젝트는 EU 회원국의 팬데믹 이후 경제 회복을 지원하고, 교통 연결을 강화하며, 지속 가능한 운송을 촉진하고, 안전을 강화하고, 일자리 기회를 창출하는 것을 목표로 합니다. 모든 지원 프로젝트는 유럽 회원국을 연결하는 유럽 횡단 교통망의 일부이며, 유럽 그린 딜에 명시된 기후 목표에 부합하는 동시에 2030년까지 TEN-T 핵심 네트워크를 완성하고 2050년까지 종합 네트워크를 완성하려는 유럽연합의 목표에 부합하는 프로젝트입니다.
2023년 2월부터 러시아산 수입 금지 조치로 인해 중동, 아시아, 북미에서 디젤 수입이 증가
- 2022년 1분기 대부분의 유로존 19개국에서 휘발유 가격이 리터당 2유로(2.13달러)를 넘어섰습니다. 가격 상승의 주요 원인은 러시아와 우크라이나 간의 분쟁으로 인한 공급 문제였는데, 러시아는 EU 석유 수요의 4분의 1 이상을 공급하고 있었기 때문입니다.
- 러시아는 유럽에서 가장 큰 디젤 공급국이었습니다. 2023년 유럽에서 디젤 가격은 하락했습니다. 유럽연합이 러시아산 석유 제품 수입 금지 조치를 시행한 2023년 2월 이후 러시아에서 유럽으로 수출되는 디젤은 하루 평균 24,000배럴(b/d)로 2022년 러시아가 유럽으로 보낸 630,000배럴(b/d)보다 96% 감소했습니다. 2월부터 5월까지 유럽으로의 디젤 수출은 중동에서 51%(16만 b/d), 아시아에서 97%(14만 7천 b/d), 북미에서 65%(4만 7천 b/d) 증가했습니다.
유럽의 국경 간 도로 화물운송 산업 개요
유럽의 국경 간 도로 화물운송 시장은 세분화되어 있으며 상위 5개 기업이 3.63%를 점유하고 있습니다. 이 시장의 주요 업체는 Dachser, DB Schenker, DHL Group, DSV A/S(De Sammensluttede Vognmaend af Air and Sea) 및 XPO, Inc(알파벳 순으로 정렬)입니다.
기타 혜택
- 엑셀 형식 시장 예측(ME) 시트
- 3개월의 애널리스트 지원
목차
제1장 주요 요약과 주요 조사 결과
제2장 보고서 제안
제3장 소개
- 조사의 전제조건과 시장 정의
- 조사 범위
- 조사 방법
제4장 주요 산업 동향
- 경제 활동별 GDP 분포
- 경제활동별 GDP 성장률
- 경제성과 및 프로파일
- 전자상거래 산업 동향
- 제조업 동향
- 운송 및 창고업 GDP
- 물류 실적
- 알바니아
- 불가리아
- 크로아티아
- 체코 공화국
- 덴마크
- 에스토니아
- 핀란드
- 프랑스
- 독일
- 헝가리
- 아이슬란드
- 이탈리아
- 라트비아
- 리투아니아
- 네덜란드
- 북유럽
- 노르웨이
- 폴란드
- 루마니아
- 러시아
- 슬로바키아 공화국
- 슬로베니아
- 스페인
- 스웨덴
- 스위스
- 영국
- 도로 길이
- 수출 동향
- 수입 동향
- 연료 가격 동향
- 트럭 운송 비용
- 유형별 트럭 보유 대수
- 주요 트럭 공급업체
- 도로화물 톤수 동향
- 도로화물 가격 동향
- 모달 점유율
- 인플레이션율
- 규제 프레임워크
- 밸류체인과 유통채널 분석
제5장 시장 세분화
- 최종 사용자 산업
- 농업, 어업, 임업
- 건설업
- 제조업
- 석유 및 가스, 광업, 채석업
- 도매 및 소매업
- 기타
- 국가명
- 프랑스
- 독일
- 이탈리아
- 네덜란드
- 북유럽
- 러시아
- 스페인
- 영국
- 기타 유럽
제6장 경쟁 구도
- 주요 전략 동향
- 시장 점유율 분석
- 기업 상황
- 기업 프로파일
- CH Robinson
- Dachser
- DB Schenker
- DHL Group
- DSV A/S(De Sammensluttede Vognmaend af Air and Sea)
- Nippon Express Holdings.
- NYK
- Rhenus Group
- XPO, Inc.
제7장 CEO에 대한 주요 전략적 질문
제8장 부록
- 세계의 물류 시장 개요
- 개요
- Five Forces 분석 프레임워크
- 세계 밸류체인 분석
- 시장 역학(시장 성장 촉진요인, 억제요인, 기회)
- 출처 및 참고문헌
- 도표 일람
- 주요 인사이트
- 데이터 팩
- 용어집
- 환율
The Europe Cross Border Road Freight Transport Market size is estimated at 176.74 billion USD in 2024, and is expected to reach 221.30 billion USD by 2030, growing at a CAGR of 3.82% during the forecast period (2024-2030).
The European automotive vehicle market is expected to record a CAGR of 3.38% from 2020 to 2030
- The European automotive industry has been booming and is expected to become a global leader and driver of Europe's growth and prosperity in the future. In addition, the European automotive vehicle market is expected to record a CAGR of 3.38% from 2020 to 2030 and reach 21.59 million units by 2030. As a result, it is expected to drive the market's growth. Moreover, the Made in Europe partnership aims to reinforce the European manufacturing global position in terms of competitiveness, sustainability, and technological leadership over the coming years.
- Brexit occurred on January 1, 2021, which led to increased border constraints, and several retailers and businesses were forced to reduce or delay their deliveries from the United Kingdom. The consequences of Brexit were also felt in France as several customers encountered delivery troubles for other online orders and experienced delays in receiving their Christmas parcels in 2021. However, the total retail trade sales volume index in the European Union increased by 5.47% in 2021 compared to the previous year.
- The construction segment of the European cross-border road freight transport market is expected to grow in line with the Swedish construction industry, which is anticipated to grow by an average of 2.1% annually between 2022 and 2025, with continued growth in the infrastructure and residential industries offsetting a decline in the commercial sector. Between 2022 and 2025, the construction market in Spain is also anticipated to rise by more than 4% annually. One of the factors expected to drive the growth of the agriculture, forestry, and fishing segment is that milk production in the European Union is projected to grow at 0.5% per year and reach around 162 million tons by 2031.
The cross border B2C e-commerce market is increasing the demand for cross border transportation in Europe
- The Nordic cross border business-to-consumer (B2C) e-commerce market is booming. The foreign share of B2C e-commerce in Sweden out of the total e-commerce revenue is the highest, amounting to 49.4% of the total market share in 2022. Similarly, cross-border e-commerce has been a major facilitator for the growth of Spain's international road freight transport market. For instance, in 2021, the international road freight transport market recovered as most online shopping registered in Spain was cross border. In 2021, 55.4% of online shopping was done from e-commerce websites outside Spain. Also, over 55% of Italian businesses used e-commerce to sell goods abroad. Italian businesses primarily sold to other EU countries, with France accounting for a 24% share, followed by Spain with 22% and Germany with 21%.
- In terms of transborder transportation, the UK has strong cross border relations with other European countries. In 2022, 6.6 million tons of goods were handled by UK-registered HGV vehicles internationally to/from the United Kingdom, registering a growth of 26% YoY. In 2022, China was one of the major trading partners of Russia. In the same year, China-Russia trade exceeded USD 190 billion, registering a growth of 29.3% YoY.
- The UK government has created a plan of action to move toward electric trucks and achieve net zero emissions from road freight by 2040. It also aims to end the sale of new non-zero emission heavy goods vehicles ranging in weight from 3.5-26 tons by 2035 and all new non-zero emission HGVs by 2040. To support the projected production of roughly 2 million electric and hybrid vehicles, the French government is investing EUR 2.5 billion (USD 2.66 billion) to strengthen the road freight industry within the framework of the France 2030 investment plan.
Europe Cross Border Road Freight Transport Market Trends
European Union allocated USD 5.76 billion to 135 transportation projects to boost economic recovery
- The transportation and warehouse sector plays a crucial role in supporting operations across various industries, with Germany leading as the dominant player, surpassing France and the United Kingdom. Globally, Germany ranks third in both imports and exports of goods. The German federal government expressed its intention to increase investments in transportation infrastructure, allocating over EUR 12 billion (USD 12.80 billion) for federal highways and around EUR 1.7 billion (USD 1.81 billion) for waterways in 2022, thereby demonstrating its commitment to improving transportation networks.
- The German government intends to invest more in rail than road network. In 2022, Deutsche Bahn, the federal government, and the local and regional governments invested roughly EUR 13.6 billion (USD 14.51 billion) in rail infrastructure. Lower Saxony, Hamburg, Bremen, Mecklenburg-Western Pomerania, and Schleswig-Holstein are partnering with DB to invest in modernizing their rail network by 2030.
- In 2022, the European Union approved EUR 5.4 billion through grants for approximately 135 transport infrastructural projects. These projects aim to aid post-pandemic economic recovery in the EU Member States, enhance transport links, promote sustainable transportation, boost safety, and create job opportunities. All supported projects are part of the Trans-European Transport Network, which connects EU Member States and aligns with the European Union's goal of completing the TEN-T core network by 2030 and the comprehensive network by 2050, all while aligning with climate objectives outlined in the European Green Deal.
Since February 2023, diesel imports from the Middle East, Asia, and North America have increased due to the ban on imports from Russia
- Gasoline prices surpassed EUR 2 (USD 2.13) per liter in most of the 19 eurozone countries in Q1 2022. The main reason behind the increased prices was supply issues due to the conflict between Russia and Ukraine, as Russia supplied more than a quarter of the EU's petroleum needs. In 2021, the average price for a liter of gasoline in the eurozone was EUR 1.30 (USD 1.38); at the start of 2022, the price was about EUR 1.55 (USD 1.65) per liter.
- Russia has been Europe's largest supplier of diesel. In 2023, diesel prices declined in Europe. Since February 2023, when the European Union implemented the ban on petroleum product imports from Russia, diesel exports from Russia to Europe have averaged 24,000 barrels per day (b/d), down by 96% from the 630,000 b/d Russia sent to Europe in 2022. From February through May, diesel exports to Europe increased by 51% (160,000 b/d) from the Middle East, by 97% (147,000 b/d) from Asia, and by 65% (47,000 b/d) from North America.
- Denmark is the most expensive country for petrol, and Finland is the most expensive for diesel. Austria has the cheapest petrol, and Spain is the cheapest for diesel. Fuel prices in the United Kingdom reached record highs in 2022, with the average price of petrol hitting 191.53 p-per-litre and diesel reaching 199.05 p-per-litre in July. The average cost of petrol at UK forecourts has risen to break 150p a liter (USD 1.80) since the start of 2023, and diesel has risen to 152.41p a liter (USD 1.83). Spanish fuel prices were lower than in the United Kingdom by about 20 cents per liter for petrol and 40 cents per liter for diesel in January 2023.
Europe Cross Border Road Freight Transport Industry Overview
The Europe Cross Border Road Freight Transport Market is fragmented, with the top five companies occupying 3.63%. The major players in this market are Dachser, DB Schenker, DHL Group, DSV A/S (De Sammensluttede Vognmaend af Air and Sea) and XPO, Inc. (sorted alphabetically).
Additional Benefits:
- The market estimate (ME) sheet in Excel format
- 3 months of analyst support
TABLE OF CONTENTS
1 EXECUTIVE SUMMARY & KEY FINDINGS
2 REPORT OFFERS
3 INTRODUCTION
- 3.1 Study Assumptions & Market Definition
- 3.2 Scope of the Study
- 3.3 Research Methodology
4 KEY INDUSTRY TRENDS
- 4.1 GDP Distribution By Economic Activity
- 4.2 GDP Growth By Economic Activity
- 4.3 Economic Performance And Profile
- 4.3.1 Trends in E-Commerce Industry
- 4.3.2 Trends in Manufacturing Industry
- 4.4 Transport And Storage Sector GDP
- 4.5 Logistics Performance
- 4.5.1 Albania
- 4.5.2 Bulgaria
- 4.5.3 Croatia
- 4.5.4 Czech Republic
- 4.5.5 Denmark
- 4.5.6 Estonia
- 4.5.7 Finland
- 4.5.8 France
- 4.5.9 Germany
- 4.5.10 Hungary
- 4.5.11 Iceland
- 4.5.12 Italy
- 4.5.13 Latvia
- 4.5.14 Lithuania
- 4.5.15 Netherlands
- 4.5.16 Nordics
- 4.5.17 Norway
- 4.5.18 Poland
- 4.5.19 Romania
- 4.5.20 Russia
- 4.5.21 Slovak Republic
- 4.5.22 Slovenia
- 4.5.23 Spain
- 4.5.24 Sweden
- 4.5.25 Switzerland
- 4.5.26 United Kingdom
- 4.6 Length Of Roads
- 4.7 Export Trends
- 4.8 Import Trends
- 4.9 Fuel Pricing Trends
- 4.10 Trucking Operational Costs
- 4.11 Trucking Fleet Size By Type
- 4.12 Major Truck Suppliers
- 4.13 Road Freight Tonnage Trends
- 4.14 Road Freight Pricing Trends
- 4.15 Modal Share
- 4.16 Inflation
- 4.17 Regulatory Framework
- 4.18 Value Chain & Distribution Channel Analysis
5 MARKET SEGMENTATION (includes market size in Value in USD, Forecasts up to 2030 and analysis of growth prospects)
- 5.1 End User Industry
- 5.1.1 Agriculture, Fishing, and Forestry
- 5.1.2 Construction
- 5.1.3 Manufacturing
- 5.1.4 Oil and Gas, Mining and Quarrying
- 5.1.5 Wholesale and Retail Trade
- 5.1.6 Others
- 5.2 Country
- 5.2.1 France
- 5.2.2 Germany
- 5.2.3 Italy
- 5.2.4 Netherlands
- 5.2.5 Nordics
- 5.2.6 Russia
- 5.2.7 Spain
- 5.2.8 United Kingdom
- 5.2.9 Rest of Europe
6 COMPETITIVE LANDSCAPE
- 6.1 Key Strategic Moves
- 6.2 Market Share Analysis
- 6.3 Company Landscape
- 6.4 Company Profiles
- 6.4.1 C.H. Robinson
- 6.4.2 Dachser
- 6.4.3 DB Schenker
- 6.4.4 DHL Group
- 6.4.5 DSV A/S (De Sammensluttede Vognmaend af Air and Sea)
- 6.4.6 Nippon Express Holdings.
- 6.4.7 NYK (Nippon Yusen Kaisha) Line
- 6.4.8 Rhenus Group
- 6.4.9 XPO, Inc.
7 KEY STRATEGIC QUESTIONS FOR ROAD FREIGHT CEOS
8 APPENDIX
- 8.1 Global Logistics Market Overview
- 8.1.1 Overview
- 8.1.2 Porter's Five Forces Framework
- 8.1.3 Global Value Chain Analysis
- 8.1.4 Market Dynamics (Market Drivers, Restraints & Opportunities)
- 8.2 Sources & References
- 8.3 List of Tables & Figures
- 8.4 Primary Insights
- 8.5 Data Pack
- 8.6 Glossary of Terms
- 8.7 Currency Exchange Rate
