
|
시장보고서
상품코드
1692560
말레이시아의 도로 화물 운송 시장 : 점유율 분석, 산업 동향 및 통계, 성장 예측(2025-2030년)Malaysia Road Freight Transport - Market Share Analysis, Industry Trends & Statistics, Growth Forecasts (2025 - 2030) |
||||||
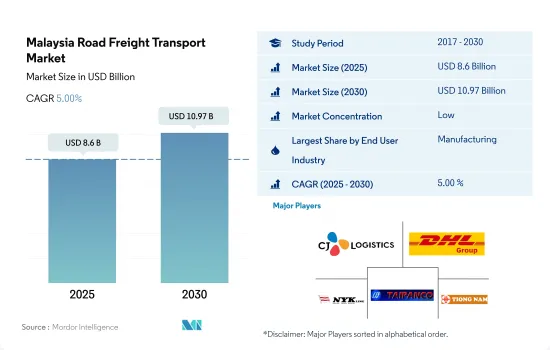
말레이시아의 도로 화물 운송 시장 규모는 2025년 86억 달러로 추정되며, 2030년에는 109억 7,000만 달러에 이를 것으로 예측되며, 예측 기간 중(2025-2030년) CAGR 5.00%로 성장할 전망입니다.
말레이시아의 전자상거래 부문은 2022년 전년 대비 2.98%의 성장을 이루며 시장 성장을 견인했습니다.
- 2022년 제조업의 69.2%를 차지하는 수출형 산업은 7.1% 증가, 국내형 산업은 10.3% 증가했습니다. 2023년 국내 제조업은 모든 서브섹터의 확대로 3.9%의 성장이 예상됩니다.
- 향후 수년간 말레이시아는 사물인터넷(IoT)이나 정밀농업 등의 기술을 이용하여 국내 생산을 늘리고 수입 의존도를 낮추는 것을 목표로 하고 있습니다. 또한, 탐사 및 생산 활동 증가가 석유 및 가스, 광업, 채석의 최종 사용자 부문을 견인할 것으로 예상됩니다.
말레이시아의 도로화물 운송 시장 동향
말레이시아의 운송 및 보관 부문은 725만 달러의 대외 직접 투자 적자에도 불구하고 2022년 전년 대비 33.42%의 성장을 경험
- 일대일로 구상은 말레이시아의 인프라 성장을 견인하고 있습니다. ECRL은 말레이시아의 경제 성장을 최대 2.7% 끌어올릴 것으로 예상됩니다.
- MRT3는 쿠알라룸푸르의 도시철도망을 완성시키는 마지막 중요한 노선으로, 전체 길이 50.8km, 쿠알라룸푸르 근교를 달립니다. East Coast Rail Link(ECRL)를 통해, 20역을 포함한 복선 철도 연결 인프라 프로젝트가 2017년에 개시되어, 여객역 14역, 여객 및 화물 병용역 5역, 화물역 1역이 설치되었습니다.
연료 소매 가격을 시장 가격에 맞추기 위해 디젤 보조금 폐지를 협의 중
- 말레이시아는 2024년 6월부터 디젤 보조금을 폐지하고 소매가격을 1리터당 3.35MYR(0.75달러) 시장 가격에 맞추는 계획으로 2.15MYR(0.48미국달러)에서 55%의 가격 인상이 될 것으로 예상됩니다. 디젤 보조금은 145억 MYR(32억 8,000만 달러)에 이르고, 정부는 이번 보조금 합리화로 연간 약 40억 MYR(9억 달러)의 절약을 전망했습니다. 이 나라의 디젤 보조금은 매월 10억 MYR(2억 2,000만 달러)에 달해, 1일의 누출에 의한 손실은 450만 MYR(102만 달러)에 달했습니다.
- 말레이시아의 디젤 가격은 2024년 6월에 50% 이상 늘어났습니다. 이 개혁은 보편적인 에너지 보조금을 폐지하고 보조를 가장 필요로 하는 사람들에게 집중시키는 것으로, 국가 재정의 압박을 완화하는 것을 목적으로 하고 있습니다.
말레이시아 도로화물 운송 산업 개요
말레이시아의 도로화물 운송 시장은 단편화되어 있으며, CJ Logistics Corporation, DHL Group, NYK (Nippon Yusen Kaisha) Line, Taipanco Sdn Bhd, Tiong Nam Logistics Holdings Bhd(알파벳순)가 주요 5개사입니다.
기타 혜택:
- 엑셀 형식 시장 예측(ME) 시트
- 3개월간의 애널리스트·지원
목차
제1장 주요 요약과 주요 조사 결과
제2장 보고서 제안
제3장 소개
- 조사의 전제조건과 시장 정의
- 조사 범위
- 조사 방법
제4장 주요 산업 동향
- 경제활동별 GDP 분포
- 경제활동별 GDP 성장률
- 경제성과 및 프로파일
- 전자상거래 산업의 동향
- 제조업의 동향
- 운수 및 창고업의 GDP
- 물류 실적
- 도로의 길이
- 수출 동향
- 수입 동향
- 연료 가격 동향
- 트럭 운송 비용
- 유형별 트럭 보유 대수
- 주요 트럭 공급업체
- 도로화물 톤수의 동향
- 도로화물 가격 동향
- 모달 점유율
- 인플레이션율
- 규제 프레임워크
- 밸류체인과 유통채널 분석
제5장 시장 세분화
- 최종 사용자 산업
- 농업, 어업, 임업
- 건설업
- 제조업
- 석유 및 가스, 광업, 채석업
- 도소매업
- 기타
- 수출처
- 국내화물
- 국제화물
- 트럭 적재량
- Full Truckload(FTL)
- Less-than-truckload(LTL)
- 컨테이너 수송
- 컨테이너 수송
- 컨테이너 없음
- 거리
- 장거리 수송
- 단거리 수송
- 상품 구성
- 유체상품
- 고체상품
- 온도 제어
- 비온도 제어
- 온도 제어
제6장 경쟁 구도
- 주요 전략 동향
- 시장 점유율 분석
- 기업 상황
- 기업 프로파일
- CJ Logistics Corporation
- DHL Group
- FM Global Logistics Holdings Bhd
- Gulf Agency Company(GAC)
- NYK(Nippon Yusen Kaisha) 라인
- Taipanco Sdn Bhd
- Tiong Nam Logistics Holdings Bhd
- Transocean Holdings Bhd
- Xin Hwa Holdings Bhd
제7장 CEO에 대한 주요 전략적 질문
제8장 부록
- 세계 물류 시장 개요
- 개요
- Porter's Five Forces 분석 프레임워크
- 세계 밸류체인 분석
- 시장 역학(시장 성장 촉진요인, 억제요인, 기회)
- 정보원과 참고문헌
- 도표 일람
- 주요 인사이트
- 데이터 팩
- 용어집
- 환율
The Malaysia Road Freight Transport Market size is estimated at 8.6 billion USD in 2025, and is expected to reach 10.97 billion USD by 2030, growing at a CAGR of 5.00% during the forecast period (2025-2030).
The e-commerce sector in Malaysia experienced a YoY growth of 2.98% in 2022, which drove the growth of the market
- In 2022, the export-oriented industries, which comprised 69.2% of the manufacturing sector, grew by 7.1%, while the domestic-oriented industries increased by 10.3%. Exports of manufactured goods rose by 22% YoY in 2022, boosted by exports of electrical and electronic products, which rose by 30%. In 2023, the domestic manufacturing sector is estimated to grow by 3.9% on account of expansion in all sub-sectors. Export-centric industries were expected to grow steadily, with the electronics and electrical segment continuing to drive growth in the sector.
- In the coming years, the country aims to increase domestic production using technologies such as the Internet of Things (IoT) and precision farming to reduce import dependency. Over the next 2-7 years, Malaysia aims to raise fish production from aquaculture from 26% of total fish production to 60%, which is expected to boost the agriculture, fishing, and forestry end-user segment. Moreover, an increase in exploration and production activities is expected to drive the oil and gas, mining, and quarrying end-user segment.
Malaysia Road Freight Transport Market Trends
Malaysia's transportation and storage sector experienced 33.42% YoY growth in 2022, despite USD 7.25 million FDI deficit
- The Belt and Road Initiative is driving Malaysia's infrastructure growth. The East Coast Rail Link (ECRL) seeks to improve connectivity between Kelantan, Terengganu, and Pahang in the East Coast with Negeri Sembilan, Selangor, and Putrajaya in the West Coast. These areas currently lack complete railway connections. The ECRL is forecasted to boost Malaysia's economic growth by up to 2.7%. Furthermore, two decades after its construction, Malaysia's economic growth is expected to reach 4.6%. The ECRL project is set to finish by December 2026 and is expected to start operating in January 2027.
- The MRT3 is the last critical route to complete the Kuala Lumpur urban rail network; the line is 50.8 km long and runs around Kuala Lumpur's outskirts. Its construction began in early 2023 and is slated for full completion by 2030, while operations for the first phase are anticipated to commence in 2028. Through East Coast Rail Link (ECRL), a double-track railway linking infrastructure project, which includes 20 stations, began in 2017, with 14 passenger stations, five combined passenger and freight stations, and one freight station.
Elimination of Diesel subsidies under discussions, in order to align retail fuel prices to align with market rates
- Starting in June 2024, Malaysia plans to eliminate diesel subsidies, allowing retail prices to align with the market rate of MYR 3.35 (USD 0.75) per litre, marking a 55% increase from MYR 2.15 (USD 0.48). Despite potential political consequences, this change is projected to have minimal impact on the country's inflation rate. In 2023, diesel subsidies amounted to MYR 14.5 billion (USD 3.28 billion), and the government anticipates saving approximately MYR 4 billion (USD 0.90 billion) annually through this Subsidy Rationalization. Diesel subsidies in the country amount to MYR 1 billion (USD 0.22 billion) monthly, with daily losses from leaks totaling MYR 4.5 million (USD 1.02 million).
- Diesel prices in Malaysia surged by over 50% in June 2024 as part of Prime Minister Anwar Ibrahim's efforts to reform the country's long-standing fuel subsidy system. The restructuring aimed to alleviate pressure on national finances by eliminating universal energy subsidies and focusing assistance on those most in need. This move also aims to address issues like the smuggling of subsidized diesel to neighboring countries, where it fetches higher prices.
Malaysia Road Freight Transport Industry Overview
The Malaysia Road Freight Transport Market is fragmented, with the major five players in this market being CJ Logistics Corporation, DHL Group, NYK (Nippon Yusen Kaisha) Line, Taipanco Sdn Bhd and Tiong Nam Logistics Holdings Bhd (sorted alphabetically).
Additional Benefits:
- The market estimate (ME) sheet in Excel format
- 3 months of analyst support
TABLE OF CONTENTS
1 EXECUTIVE SUMMARY & KEY FINDINGS
2 REPORT OFFERS
3 INTRODUCTION
- 3.1 Study Assumptions & Market Definition
- 3.2 Scope of the Study
- 3.3 Research Methodology
4 KEY INDUSTRY TRENDS
- 4.1 GDP Distribution By Economic Activity
- 4.2 GDP Growth By Economic Activity
- 4.3 Economic Performance And Profile
- 4.3.1 Trends in E-Commerce Industry
- 4.3.2 Trends in Manufacturing Industry
- 4.4 Transport And Storage Sector GDP
- 4.5 Logistics Performance
- 4.6 Length Of Roads
- 4.7 Export Trends
- 4.8 Import Trends
- 4.9 Fuel Pricing Trends
- 4.10 Trucking Operational Costs
- 4.11 Trucking Fleet Size By Type
- 4.12 Major Truck Suppliers
- 4.13 Road Freight Tonnage Trends
- 4.14 Road Freight Pricing Trends
- 4.15 Modal Share
- 4.16 Inflation
- 4.17 Regulatory Framework
- 4.18 Value Chain & Distribution Channel Analysis
5 MARKET SEGMENTATION (includes market size in Value in USD, Forecasts up to 2030 and analysis of growth prospects)
- 5.1 End User Industry
- 5.1.1 Agriculture, Fishing, and Forestry
- 5.1.2 Construction
- 5.1.3 Manufacturing
- 5.1.4 Oil and Gas, Mining and Quarrying
- 5.1.5 Wholesale and Retail Trade
- 5.1.6 Others
- 5.2 Destination
- 5.2.1 Domestic
- 5.2.2 International
- 5.3 Truckload Specification
- 5.3.1 Full-Truck-Load (FTL)
- 5.3.2 Less than-Truck-Load (LTL)
- 5.4 Containerization
- 5.4.1 Containerized
- 5.4.2 Non-Containerized
- 5.5 Distance
- 5.5.1 Long Haul
- 5.5.2 Short Haul
- 5.6 Goods Configuration
- 5.6.1 Fluid Goods
- 5.6.2 Solid Goods
- 5.7 Temperature Control
- 5.7.1 Non-Temperature Controlled
- 5.7.2 Temperature Controlled
6 COMPETITIVE LANDSCAPE
- 6.1 Key Strategic Moves
- 6.2 Market Share Analysis
- 6.3 Company Landscape
- 6.4 Company Profiles
- 6.4.1 CJ Logistics Corporation
- 6.4.2 DHL Group
- 6.4.3 FM Global Logistics Holdings Bhd
- 6.4.4 Gulf Agency Company (GAC)
- 6.4.5 NYK (Nippon Yusen Kaisha) Line
- 6.4.6 Taipanco Sdn Bhd
- 6.4.7 Tiong Nam Logistics Holdings Bhd
- 6.4.8 Transocean Holdings Bhd
- 6.4.9 Xin Hwa Holdings Bhd
7 KEY STRATEGIC QUESTIONS FOR ROAD FREIGHT CEOS
8 APPENDIX
- 8.1 Global Logistics Market Overview
- 8.1.1 Overview
- 8.1.2 Porter's Five Forces Framework
- 8.1.3 Global Value Chain Analysis
- 8.1.4 Market Dynamics (Market Drivers, Restraints & Opportunities)
- 8.2 Sources & References
- 8.3 List of Tables & Figures
- 8.4 Primary Insights
- 8.5 Data Pack
- 8.6 Glossary of Terms
- 8.7 Currency Exchange Rate
