


|
시장보고서
상품코드
1693531
유럽의 방출 조절 비료 시장 : 점유율 분석, 산업 동향, 성장 예측(2025-2030년)Europe Controlled Release Fertilizer - Market Share Analysis, Industry Trends & Statistics, Growth Forecasts (2025 - 2030) |
||||||
■ 보고서에 따라 최신 정보로 업데이트하여 보내드립니다. 배송일정은 문의해 주시기 바랍니다.
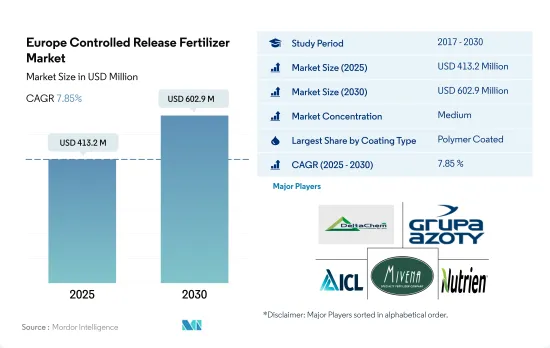
유럽의 방출 조절 비료 시장 규모는 2025년에 4억 1,320만 달러, 2030년에는 6억 290만 달러에 이를 것으로 예측되며, 예측 기간 중(2025-2030년) CAGR은 7.85%를 나타낼 것으로 예측됩니다.

환경 오염과 지하수 오염 증가로 이 지역에서는 CRF 채용이 증가
- 유럽의 방출 제어형 비료 시장은 2017-2021년에 걸쳐 142.4%로 크게 성장했습니다.
- 2017-2021년 동안 폴리머 코팅된 방출 조절 비료의 금액은 143.9%라는 현저한 증가가 있었지만, 수량은 24.3% 증가에 그쳤습니다. 공중합체, 포름알데히드나프탈렌술폰산 축합물 나트륨염, 식물성 기름 기반 알키드 등 다양한 유형의 중합체로 코팅되어 있습니다.
- 유럽 연합(EU)은 폴리머 봉입 시스템을 포함한 방출 제어형 비료에 관한 규칙과 규제를 정하고 있으며, 현재 2026년까지 생분해성 비료가 개발될 때까지 장래의 규제의 전망하에 있습니다.
- 농업 부문의 오염과 수질 오염에 대한 우려가 높아짐에 따라 농업 종사자는 지속 가능한 농법과 친환경 비료를 채용하게 되어 있습니다.
- 따라서 방출 제어형 비료의 기타 코팅 유형, 특히 생분해성과 폴리머 기반의 것이 2023-2030년 가장 높은 시장 잠재력을 가지고 있습니다.
프랑스에서의 과일 재배의 확대는 CRF의 이용을 확대
- 2022년 유럽의 방출 제어형 비료 시장에서는 프랑스가 22.4%의 최대 시장 점유율을 차지하고 영국이 약간 차이가 납니다.
- 과일 및 채소, 특히 포도와 양파 수요는 스페인에서 생산 활동의 중요한 원동력이 되고 있기 때문에 방출 제어형 코팅 비료 수요가 높아질 것으로 예측됩니다. 주어, 종래의 비료에서는 1헥타르당 30-40톤이었지만, 방출 제어형 비료에서는 70톤에 달할 전망입니다.
- 폴리머 피복 비료는 시장을 독점해, 2022년에는 76.4%의 점유율을 차지했습니다.
- 영국은 시장 전체의 74.4%라고 하는 대폭적인 급상승을 나타냈습니다.
- 세계 유수의 농업 생산국인 프랑스는 2021년에 520만 톤의 과일을 수확해, 스페인에 이은 유럽 제4위의 과일 생산국이 되었습니다. 프랑스는 작물의 품질과 생산량을 중시하고 있어, 용출 손실의 최소화, 기화의 저감, 살포 빈도의 최적화 등의 방출 조절 비료의 이점을 고려하면, 이러한 비료 수요는 향후 수년간 증가할 것으로 예측됩니다.
유럽 방출 조절 비료 시장 동향
농작물의 재배면적은 국내 소비와 수출 수요 증가에 대응하기 위해 지속적으로 확대되고 있습니다.
- 유럽에서는 유채, 밀, 호밀, 라이 밀 등의 밭작물이 주로 겨울 작물이며, 옥수수, 해바라기, 쌀, 콩은 여름에 재배됩니다. 유럽의 주요 식량 작물 전용 지역의 재배 면적은 인구 증가와 식용 곡물 수요 증가에 견인되어 꾸준히 확대하고 있습니다.
- 2021년에는 EU는 1억 2,990만 톤의 보통 밀과 철자를 수확하여 전체 곡물의 43.7%를 차지합니다. 이는 2020년 대비 1,100만 톤 증가한 수치로, 9.3%의 급증을 반영하고 있습니다.
- 2021년 EU의 옥수수 혼합 곡물 생산량은 7,300만 톤에 이르렀으며, 2020년부터 600만 톤 증가했습니다.
- 2019-2022년에 걸쳐, 이 지역의 수확 면적은 34% 감소했습니다. 그럼에도 불구하고 옥수수와 밀은 재배 면적이 각각 11%와 2% 증가한 반면, 다른 밭 작물은 감소했습니다.
이 지역의 토양 대부분은 질소가 부족하기 때문에 농작물에서 소비되는 주요 양분은 질소입니다.
- 2022년에는 농작물이 유럽에서의 양분 소비의 대부분을 차지하고, 전체의 85%를 차지해, 4,700만 톤을 이용했습니다.
- 유럽의 주요 농작물에는 밀, 유채, 호밀, 콩, 옥수수 등이 있어, 모두 비료에 크게 의존하고 있습니다.
- 질소는 유럽의 밭작물에 있어서 가장 수요가 높은 주요 양분 비료로서 부상하여 2022년의 평균 시용량은 130.64kg/헥타르가 되었습니다.
- 질소에 이어 칼륨이 비료 소비량의 2위를 차지하고 2022년의 평균 시용량은 103.75kg/헥타르입니다. 특히, 스웨덴, 스페인, 폴란드, 라트비아와 같은 국가에서는 주로 모래 토양이 많기 때문에 칼륨 부족이 현저합니다.
- 1차 영양소 비료는 대사 과정과 세포, 세포막, 엽록소 등의 중요한 식물 조직의 형성에 필수적이기 때문에 작물에 있어서 매우 중요한 역할을 담당하고 있습니다.
유럽 방출 조절 비료 산업 개요
유럽의 방출 조절 비료 시장은 적당히 통합되어 있으며 상위 5개 기업에서 51.97%를 차지하고 있습니다.
기타 혜택
- 엑셀 형식 시장 예측(ME) 시트
- 3개월의 애널리스트 서포트
목차
제1장 주요 요약과 주요 조사 결과
제2장 보고서 제안
제3장 소개
- 조사의 전제조건과 시장 정의
- 조사 범위
- 조사 방법
제4장 주요 산업 동향
- 주요 작물의 작부 면적
- 밭작물
- 원예작물
- 평균 양분 시용률
- 주요 양분
- 밭작물
- 원예작물
- 주요 양분
- 규제 프레임워크
- 밸류체인과 유통채널 분석
제5장 시장 세분화
- 코팅 유형
- 폴리머 코팅
- 폴리머·유황 코팅
- 기타
- 작물 유형
- 밭작물
- 원예작물
- 잔디 및 관상용
- 생산국
- 프랑스
- 독일
- 이탈리아
- 네덜란드
- 러시아
- 스페인
- 우크라이나
- 영국
- 기타 유럽
제6장 경쟁 구도
- 주요 전략 동향
- 시장 점유율 분석
- 기업 상황
- 기업 프로파일
- Ekompany International BV(DeltaChem)
- Grupa Azoty SA(Compo Expert)
- Haifa Group
- ICL Group Ltd
- Mivena BV
- Nutrien Ltd.
제7장 CEO에 대한 주요 전략적 질문
제8장 부록
- 세계 개요
- 개요
- Five Forces 분석 프레임워크
- 세계의 밸류체인 분석
- 시장 역학(DROs)
- 정보원과 참고문헌
- 도표 일람
- 주요 인사이트
- 데이터 팩
- 용어집
The Europe Controlled Release Fertilizer Market size is estimated at 413.2 million USD in 2025, and is expected to reach 602.9 million USD by 2030, growing at a CAGR of 7.85% during the forecast period (2025-2030).
Increasing environmental and groundwater contamination lead to higher adoption of CRFs in the region
- The European controlled-release fertilizer market grew significantly by 142.4% from 2017 to 2021. Polymer-coated CRF, among all the other coating types, held the major share, 76.4%, in 2022.
- Between 2017 and 2021, there was a striking increase of 143.9% in the value of polymer-coated controlled-release fertilizers, while the volume increased by only 24.3%. These fertilizers are coated with various types of polymers in the region, including polyurethanes, polyethylene co vinyl acetate, ethylene acrylic acid copolymer, formaldehyde-naphthalene sulfonic acid condensate sodium salts, and alkyds based on vegetable oils, as identified by the ECHA. The rise in market value can be mainly attributed to the surge in product prices, which rose by a significant 96.3% in 2022, compared to 2017.
- The European Union has set rules and regulations for controlled-release fertilizers, including polymer encapsulation systems, which are currently under the scope of future restrictions until they are developed to be biodegradable by 2026. These factors restrict the market growth in the region.
- Growing concerns over agricultural sector pollution and water contamination have led farmers to adopt sustainable agricultural practices and environmentally friendly fertilizers. CRFs reduce nutrient leaching and volatilization and release nutrients based on crop requirements, which will provide necessary nutrients to the crops when required and reduce the risk of nutrient losses.
- Hence, the other coating types segment of controlled-release fertilizers, particularly biodegradable and polymer-based ones, has the highest market potential from 2023 to 2030.
Expansion of fruit cultivation in France increases the CRFs' use
- France held the largest market share of 22.4% in the European controlled release fertilizer market in 2022, with the United Kingdom following closely behind.
- The demand for fruits and vegetables, particularly grapes and onions, is a key driver of production activity in Spain. This, in turn, is expected to boost the demand for controlled release coated fertilizers. The use of these fertilizers has shown a significant impact on grape yields, with controlled release fertilizers delivering 70 metric tons per hectare compared to the 30-40 metric tons achieved with conventional fertilizers. Consequently, the increased adoption of polymer-coated controlled release fertilizers has bolstered the market revenue in Spain.
- Polymer-coated fertilizers dominated the market, accounting for a substantial 76.4% share in 2022.
- The United Kingdom witnessed a significant 74.4% surge in the overall market value. This surge can be largely attributed to the Russia-Ukraine conflict that commenced in early 2022, leading to a supply shortage and subsequent price hikes in the country.
- France, a prominent global agricultural producer, harvested 5.2 million metric tons of fruit in 2021, ranking it as the fourth-largest fruit producer in Europe, trailing behind Spain. Given France's emphasis on crop quality, production, and the advantages of controlled release fertilizers, such as minimizing leaching losses, reducing vaporization, and optimizing application frequency, the demand for these fertilizers is projected to rise in the coming years.
Europe Controlled Release Fertilizer Market Trends
The cultivation area for field crops is consistently expanding to cater to both domestic consumption and the growing export demand
- In Europe, field crops like rapeseed, wheat, rye, and triticale are predominantly winter crops, while maize, sunflowers, rice, and soybean are grown in the summer. Barley, in both winter and spring varieties, is widely cultivated. The area dedicated to major food crops in Europe has been steadily expanding, driven by population growth and rising food grain demand. In 2017, the harvested area for field crops stood at 78.5 thousand ha, which climbed to 108 thousand ha by 2022.
- In 2021, the European Union harvested 129.9 million tonnes of common wheat and spelled, accounting for 43.7% of all cereal grains. This marked an 11.0 million tonne increase from 2020, reflecting a 9.3% surge. The rise was propelled by a 5.6% expansion in the harvested area, reaching 21.8 million hectares, and improved apparent yields.
- In 2021, the European Union's production of grain maize and corn cob mix reached 73.0 million tonnes, up by 6.0 million tonnes from 2020. This overall increase was primarily driven by significant rebounds in Romania (a 46.8% increase, adding 4.7 million tonnes) and France (a 14.5% increase, adding 1.9 million tonnes).
- From 2019 to 2022, the region witnessed a notable 34% decline in harvested area. Despite this, corn/maize and wheat saw respective increases of 11% and 2% in their cultivation areas, while other field crops saw reductions. Farmers are expected to boost fertilizer usage during 2023-2030 to bolster yields and counterbalance the declining harvested areas of recent years.
Nitrogen is the primary nutrient consumed more in field crops as most of the soil in the region is deficient in nitrogen
- In 2022, field crops dominated nutrient consumption in Europe, accounting for 85% of the total and utilizing 47 million metric tons. This high demand can be attributed to both the extensive cultivation of field crops and their significant nutrient requirements.
- The primary field crops in Europe include wheat, rapeseed, rye, soybean, and corn, all of which have a substantial reliance on fertilizers. In 2022, the average application rate of nitrogen, phosphorous, and potassium in these crops stood at 187.3 kg per hectare.
- Nitrogen emerged as the most in-demand primary nutrient fertilizer for European field crops, with an average application rate of 130.64 kg/hectare in 2022. Nitrogen deficiency poses the most significant yield constraint, with a majority of agricultural soils in the region lacking this nutrient, necessitating its widespread application.
- Following nitrogen, potassium took the second spot in fertilizer consumption, with an average application rate of 103.75 kg/hectare in 2022. Notably, countries like Sweden, Spain, Poland, and Latvia face more pronounced potassium deficiencies, primarily due to the prevalence of sandy soils. Phosphatic fertilizers followed with an application rate of 56.93 kg/hectare in 2022.
- Primary nutrient fertilizers hold immense significance for crops, as they are integral to metabolic processes and the formation of crucial plant tissues such as cells, cell membranes, and chlorophyll. Phosphorous plays a vital role in cultivating high-quality crops, while potassium activates enzymes essential for plant growth and development.
Europe Controlled Release Fertilizer Industry Overview
The Europe Controlled Release Fertilizer Market is moderately consolidated, with the top five companies occupying 51.97%. The major players in this market are Ekompany International BV (DeltaChem), Grupa Azoty S.A. (Compo Expert), ICL Group Ltd, Mivena BV and Nutrien Ltd. (sorted alphabetically).
Additional Benefits:
- The market estimate (ME) sheet in Excel format
- 3 months of analyst support
TABLE OF CONTENTS
1 EXECUTIVE SUMMARY & KEY FINDINGS
2 REPORT OFFERS
3 INTRODUCTION
- 3.1 Study Assumptions & Market Definition
- 3.2 Scope of the Study
- 3.3 Research Methodology
4 KEY INDUSTRY TRENDS
- 4.1 Acreage Of Major Crop Types
- 4.1.1 Field Crops
- 4.1.2 Horticultural Crops
- 4.2 Average Nutrient Application Rates
- 4.2.1 Primary Nutrients
- 4.2.1.1 Field Crops
- 4.2.1.2 Horticultural Crops
- 4.2.1 Primary Nutrients
- 4.3 Regulatory Framework
- 4.4 Value Chain & Distribution Channel Analysis
5 MARKET SEGMENTATION (includes market size in Value in USD and Volume, Forecasts up to 2030 and analysis of growth prospects)
- 5.1 Coating Type
- 5.1.1 Polymer Coated
- 5.1.2 Polymer-Sulfur Coated
- 5.1.3 Others
- 5.2 Crop Type
- 5.2.1 Field Crops
- 5.2.2 Horticultural Crops
- 5.2.3 Turf & Ornamental
- 5.3 Country
- 5.3.1 France
- 5.3.2 Germany
- 5.3.3 Italy
- 5.3.4 Netherlands
- 5.3.5 Russia
- 5.3.6 Spain
- 5.3.7 Ukraine
- 5.3.8 United Kingdom
- 5.3.9 Rest of Europe
6 COMPETITIVE LANDSCAPE
- 6.1 Key Strategic Moves
- 6.2 Market Share Analysis
- 6.3 Company Landscape
- 6.4 Company Profiles
- 6.4.1 Ekompany International BV (DeltaChem)
- 6.4.2 Grupa Azoty S.A. (Compo Expert)
- 6.4.3 Haifa Group
- 6.4.4 ICL Group Ltd
- 6.4.5 Mivena BV
- 6.4.6 Nutrien Ltd.
7 KEY STRATEGIC QUESTIONS FOR FERTILIZER CEOS
8 APPENDIX
- 8.1 Global Overview
- 8.1.1 Overview
- 8.1.2 Porter's Five Forces Framework
- 8.1.3 Global Value Chain Analysis
- 8.1.4 Market Dynamics (DROs)
- 8.2 Sources & References
- 8.3 List of Tables & Figures
- 8.4 Primary Insights
- 8.5 Data Pack
- 8.6 Glossary of Terms


샘플 요청 목록