|
시장보고서
상품코드
1693612
미국의 전기 버스 시장 : 점유율 분석, 산업 동향 및 통계, 성장 예측(2025-2030년)United States Electric Bus - Market Share Analysis, Industry Trends & Statistics, Growth Forecasts (2025 - 2030) |
||||||
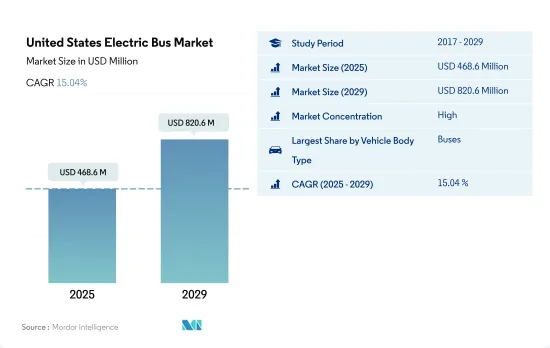
미국의 전기 버스 시장 규모는 2025년 4억 6,860만 달러로 예측되고, 2029년에는 8억 2,060만 달러에 이를 것으로 예측되며, 예측 기간 중(2025-2029년) CAGR 15.04%로 성장할 것으로 예측됩니다.

미국 전기버스 시장 동향
정부의 이니셔티브와 미국 수요 증가로 전기자동차 판매가 급성장
- 미국에서는 최근 전기차(EV)의 도입이 급증하고 있습니다. 2016년, 캘리포니아 주는 이산화탄소 배출량 억제와 대기 환경 개선을 목적으로 한 ZEV 프로그램을 도입했습니다. 이 대처는 캘리포니아 주에서의 전기자동차의 보급에 박차를 가했을 뿐만 아니라, 다른 주에도 비슷한 ZEV 규제를 도입하도록 영향을 주었습니다.
- 미국에서의 전기상용차 수요도 증가 경향에 있습니다. E-Commerce 산업의 활황, 물류 활동 증가, 보다 깨끗한 수송을 요구하는 정부의 대처 등의 요인이, 이 성장을 뒷받침하고 있습니다. 중요한 활동으로, 뉴욕 주지사가 2021년 9월 첨단 클린 트럭(ACT) 규칙에 서명했습니다. 이 규칙에서는 2035년까지 모든 신형 소형차를 제로 배출화해, 2045년까지 중형차와 대형차도 제로 배출화 하는 목표가 설정되어 있습니다. 그 결과, 미국에서는 2022년에 전기 상용차 수요가 전년 대비 21% 급증했습니다.
- 리베이트, 보조금, 전략적 계획 등 정부의 이니셔티브이 전국적인 자동차의 전동화를 더욱 뒷받침하고 있습니다. 2022년 5월, 바이든 대통령은 가스 자동차에서 전기자동차로 이행을 목표로, 국내에서 배터리 제조를 촉진하는 30억 달러의 계획을 발표했습니다. 이 추진에 의해 특히 2024-2030년간, 국내의 전동 모빌리티가 대폭적으로 촉진되어, 그것에 의해 배터리 팩 수요가 증대할 것으로 예상됩니다.
미국 전기 버스 산업 개요
미국의 전기 버스 시장은 상당히 통합되어 있으며 상위 5개 기업에서 81.60%를 차지하고 있습니다. 시장 주요 기업은 BYD Auto, GreenPower Motor Company Inc., Lion Electric Company, NFI Group Inc. and Proterra INC.가 있습니다(알파벳순).
기타 혜택
- 엑셀 형식 시장 예측(ME) 시트
- 3개월의 애널리스트 서포트
목차
제1장 주요 요약과 주요 조사 결과
제2장 보고서 제안
제3장 소개
- 조사의 전제조건과 시장 정의
- 조사 범위
- 조사 방법
제4장 주요 산업 동향
- 인구
- 1인당 GDP
- 자동차 구매를 위한 소비자 지출(cvp)
- 인플레이션율
- 자동차 대출 금리
- 공유 라이드
- 전화의 영향
- EV 충전소
- 배터리 팩 가격
- Xev 신모델 발표
- 연료 가격
- OEM 생산 통계
- 규제 프레임워크
- 밸류체인과 유통채널 분석
제5장 시장 세분화
- 연료 카테고리
- BEV
- FCEV
- HEV
제6장 경쟁 구도
- 주요 전략적 움직임
- 시장 점유율 분석
- 기업 상황
- 기업 프로파일
- Blue Bird Corporation
- BYD Auto Co. Ltd.
- Daimler Truck Holding AG
- GILLIG LLC
- GreenPower Motor Company Inc.
- Lion Electric Company
- NFI Group Inc.
- Proterra INC.
- REV group Inc.
- Volvo Group
제7장 CEO에 대한 주요 전략적 질문
제8장 부록
- 세계 개요
- 개요
- Porter's Five Forces 분석 프레임워크
- 세계의 밸류체인 분석
- 시장 역학(DROs)
- 정보원과 참고문헌
- 도표 일람
- 주요 인사이트
- 데이터 팩
- 용어집
The United States Electric Bus Market size is estimated at 468.6 million USD in 2025, and is expected to reach 820.6 million USD by 2029, growing at a CAGR of 15.04% during the forecast period (2025-2029).
United States Electric Bus Market Trends
Rapid growth in electric vehicle sales driven by government initiatives and increasing demand in the US
- The United States has witnessed a significant surge in the adoption of electric vehicles (EVs) in recent years. This uptick can be attributed to a heightened awareness of EVs, growing environmental concerns, and the implementation of government regulations. Notably, in 2016, California introduced the Zero-Emission Vehicle (ZEV) program aimed at curbing carbon emissions and improving air quality. This initiative has not only spurred the growth of electric cars within California but has also influenced other states to adopt similar ZEV regulations. Consequently, the nation saw a remarkable 634% surge in demand for battery electric vehicles (BEVs) from 2017 to 2022.
- The demand for electric commercial vehicles in the United States is also on the rise. Factors such as the booming e-commerce industry, increased logistics activities, and governmental initiatives for cleaner transportation have fueled this growth. In a significant move, the governor of New York signed the Advanced Clean Truck (ACT) Rule in September 2021. This rule sets a target for all new light-duty vehicles to be zero-emission by 2035 and the same for medium- and heavy-duty vehicles by 2045. As a result, the United States witnessed a 21% surge in demand for electric commercial vehicles in 2022 compared to the previous year.
- Governmental efforts, including rebates, subsidies, and strategic plans, are further bolstering the electrification of vehicles nationwide. In May 2022, President Biden unveiled a USD 3 billion plan to expedite domestic battery manufacturing, with the aim of transitioning gas-powered vehicles to electric ones. This push is expected to significantly boost electric mobility in the country, particularly during 2024-2030, thereby amplifying the demand for battery packs.
United States Electric Bus Industry Overview
The United States Electric Bus Market is fairly consolidated, with the top five companies occupying 81.60%. The major players in this market are BYD Auto Co. Ltd., GreenPower Motor Company Inc., Lion Electric Company, NFI Group Inc. and Proterra INC. (sorted alphabetically).
Additional Benefits:
- The market estimate (ME) sheet in Excel format
- 3 months of analyst support
TABLE OF CONTENTS
1 EXECUTIVE SUMMARY & KEY FINDINGS
2 REPORT OFFERS
3 INTRODUCTION
- 3.1 Study Assumptions & Market Definition
- 3.2 Scope of the Study
- 3.3 Research Methodology
4 KEY INDUSTRY TRENDS
- 4.1 Population
- 4.2 GDP Per Capita
- 4.3 Consumer Spending For Vehicle Purchase (cvp)
- 4.4 Inflation
- 4.5 Interest Rate For Auto Loans
- 4.6 Shared Rides
- 4.7 Impact Of Electrification
- 4.8 EV Charging Station
- 4.9 Battery Pack Price
- 4.10 New Xev Models Announced
- 4.11 Fuel Price
- 4.12 Oem-wise Production Statistics
- 4.13 Regulatory Framework
- 4.14 Value Chain & Distribution Channel Analysis
5 MARKET SEGMENTATION (includes market size in Value in USD and Volume, Forecasts up to 2029 and analysis of growth prospects)
- 5.1 Fuel Category
- 5.1.1 BEV
- 5.1.2 FCEV
- 5.1.3 HEV
6 COMPETITIVE LANDSCAPE
- 6.1 Key Strategic Moves
- 6.2 Market Share Analysis
- 6.3 Company Landscape
- 6.4 Company Profiles
- 6.4.1 Blue Bird Corporation
- 6.4.2 BYD Auto Co. Ltd.
- 6.4.3 Daimler Truck Holding AG
- 6.4.4 GILLIG LLC
- 6.4.5 GreenPower Motor Company Inc.
- 6.4.6 Lion Electric Company
- 6.4.7 NFI Group Inc.
- 6.4.8 Proterra INC.
- 6.4.9 REV group Inc.
- 6.4.10 Volvo Group
7 KEY STRATEGIC QUESTIONS FOR VEHICLES CEOS
8 APPENDIX
- 8.1 Global Overview
- 8.1.1 Overview
- 8.1.2 Porter's Five Forces Framework
- 8.1.3 Global Value Chain Analysis
- 8.1.4 Market Dynamics (DROs)
- 8.2 Sources & References
- 8.3 List of Tables & Figures
- 8.4 Primary Insights
- 8.5 Data Pack
- 8.6 Glossary of Terms