


|
시장보고서
상품코드
1693621
아시아태평양의 상용차 시장 : 점유율 분석, 산업 동향, 성장 예측(2025-2030년)Asia-Pacific Commercial Vehicles - Market Share Analysis, Industry Trends & Statistics, Growth Forecasts (2025 - 2030) |
||||||
■ 보고서에 따라 최신 정보로 업데이트하여 보내드립니다. 배송일정은 문의해 주시기 바랍니다.
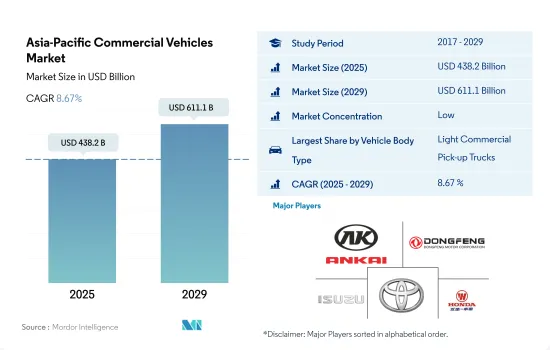
아시아태평양의 상용차 시장 규모는 2025년 4,382억 달러로 추정되며, 2029년에는 6,111억 달러에 이를 것으로 예측되며, 예측 기간 중(2025-2029년) CAGR 8.67%로 성장할 전망입니다.

세계 상용차 산업에서 매우 중요한 진출기업으로서의 아시아태평양의 중요성은 회복력, 적응력, 성장 가능성에 의해 나타납니다.
- 아시아태평양 상용차 시장의 소형 상용 픽업 트럭 부문은 탄력성과 꾸준한 성장을 보여줍니다. 2017년 462만 401대에서 시작되었으며 2018년과 2019년에는 일시적인 정체가 있었습니다. 그러나 그 후 몇 년간은 현저한 상승을 보였고, 이들 차량에 대한 왕성한 수요를 뒷받침하고 있습니다. 예측에 따르면, 2023년까지 이 부문은 604만 2,081대에 이르고, 눈부신 회복과 성장 궤도를 보여줍니다. 이와는 대조적으로 소형 상용 밴 부문은 2017년 117만 6,110대에서 2019년 88만 5,614대까지 감소를 기록했습니다. 2019년 이후, 완만한 회복을 볼 수 있지만, 픽업 트럭의 페이스에는 미치지 못하고 있습니다. 2023년 소형 상용차 밴의 예측은 108만 2,025대가 되었으며, 이러한 차량 수요는 안정적이지만 완만하다는 것을 보여줍니다.
- 아시아태평양 상용차 시장의 중형 상용 트럭 부문은 최근 과제에 직면해 있습니다. 대와 대폭적인 침체를 경험했습니다. 그러나, 회복의 밝은 조짐도 볼 수 있어 2023년에는 49만 2,106대까지 상승한다고 하는 예측도 있습니다.
- 마지막으로 대량수송에 빠뜨릴 수 없는 버스부문은 당초 아시아태평양시장 전체에서 2017년 68만 162대에서 2019년에는 54만 6,164대로 감소했습니다.
아시아태평양의 CV 등록 대수는 지속적으로 증가하고 있으며, 이 지역의 물류 및 상업 수요 증가를 지원할 가능성이 높습니다.
- 주로 중국으로의 산업 생산 이전은 무역 채널을 개방하고 간접적으로 상용차 시장과 물류 부문에 이익을 가져다줍니다. 물류 및 전자상거래 부문의 성장으로 LCV 수요가 증가할 것으로 예측됩니다. 중국 경제의 확대에 의해 중간층의 가처분 소득이 증가해, 상용차와 승용차의 양쪽 모두 수요를 밀어 올리고 있습니다. 또한, 동국의 생산 비용의 낮음이, 과거 5년간의 자동차 수요의 대폭적인 급증에 박차를 가하고 있습니다.
- 아시아태평양의 상용차 시장은 COVID-19 발생 시 후퇴에 직면해 현지 당국이 상업과 여행에 제한을 부과했습니다. 이 때문에 상용차의 판매는 급감했습니다.
- 인도 정부는 장애물에도 불구하고 공유, 커넥티드 및 전기 이동성 생태계 개발에 종사하고 있습니다. 이러한 노력은 장기적으로 상용 전기자동차 성장을 가속할 것으로 예측됩니다. 전역의 건축자재와 기계의 수송을 대폭 강화할 것으로 예측되고 있습니다.
아시아태평양 상용차 시장 동향
아시아태평양의 급속한 전기자동차 수요와 판매 성장은 정부의 이니셔티브와 상용차의 전동화가 원동력
- 아시아태평양에서는 최근 전기자동차(EV) 수요와 판매가 급증하고 있습니다. 밀고 있는 요인에는 환경문제에 대한 관심의 높아짐, 엄격한 규제, 연비효율, 유지비의 삭감, 이산화탄소 배출 제로 등의 EV의 이점 등이 있습니다.
- 기존 연료를 사용하는 상용차, 특히 트럭과 버스는 아시아태평양 국가의 오염 수준 상승의 원인이 되고 있습니다. 예를 들어, 2020년 12월, 인도네시아에서 자치체 버스를 운행하는 TransJakarta는 2030년까지 전기 버스(E버스) 차량을 1만대에 확대한다고 하는 야심적인 계획을 발표했습니다.
- 아시아태평양 각국의 정부기관은 화석연료자동차를 단계적으로 폐지하는 조치를 적극적으로 제안하고 있으며, 이 움직임은 전기상용차 시장을 강화하는 자세입니다.
아시아태평양 상용차 산업 개요
아시아태평양의 상용차 시장은 세분화되어 있으며 상위 5개 기업에서 31.67%를 차지하고 있습니다.
기타 혜택
- 엑셀 형식 시장 예측(ME) 시트
- 3개월의 애널리스트 서포트
목차
제1장 주요 요약과 주요 조사 결과
제2장 보고서 제안
제3장 소개
- 조사의 전제조건과 시장 정의
- 조사 범위
- 조사 방법
제4장 주요 산업 동향
- 인구
- 1인당 GDP
- 자동차 구매를 위한 소비자 지출(cvp)
- 인플레이션율
- 자동차 대출 금리
- 전화의 영향
- EV 충전소
- 배터리 팩 가격
- Xev 신모델 발표
- 물류성능지수
- 연료 가격
- OEM 생산 통계
- 규제 프레임워크
- 밸류체인과 유통채널 분석
제5장 시장 세분화
- 차종
- 상용차
- 버스
- 대형 상용 트럭
- 소형 상용 픽업 트럭
- 소형 상용 밴
- 중형 상용 트럭
- 상용차
- 추진 유형
- 하이브리드와 전기자동차
- 연료 카테고리별
- BEV
- FCEV
- HEV
- PHEV
- 내연기관
- 연료 카테고리별
- 천연가스
- 디젤
- 가솔린
- LPG
- 하이브리드와 전기자동차
- 국가명
- 호주
- 중국
- 인도
- 인도네시아
- 일본
- 말레이시아
- 한국
- 태국
- 기타 아시아태평양
제6장 경쟁 구도
- 주요 전략 동향
- 시장 점유율 분석
- 기업 상황
- 기업 프로파일
- Anhui Ankai Automobile Co. Ltd.
- Daihatsu Motor Co. Ltd.
- Dongfeng Motor Corporation
- Ford Motor Company
- General Motors Company
- Great Wall Motor Company Ltd(GWM)
- Honda Motor Co. Ltd.
- Hyundai Motor Company
- Isuzu Motors Limited
- Kia Corporation
- Mazda Motor Corporation
- Mitsubishi Motors Corporation
- Nissan Motor Co. Ltd.
- Renault-Nissan-Mitsubishi Alliance
- Subaru Corporation
- Suzuki Motor Corporation
- Tata Motors Limited
- Toyota Motor Corporation
- Wuling Motors Holdings Limited
제7장 CEO에 대한 주요 전략적 질문
제8장 부록
- 세계 개요
- 개요
- Porter's Five Forces 분석 프레임워크
- 세계의 밸류체인 분석
- 시장 역학(DROs)
- 정보원과 참고문헌
- 도표 일람
- 주요 인사이트
- 데이터 팩
- 용어집
The Asia-Pacific Commercial Vehicles Market size is estimated at 438.2 billion USD in 2025, and is expected to reach 611.1 billion USD by 2029, growing at a CAGR of 8.67% during the forecast period (2025-2029).
APAC's significance as a pivotal player in the global commercial vehicle industry is marked by resilience, adaptability, and growth potential
- The light commercial pickup trucks segment of the Asia-Pacific commercial vehicles market has been showcasing resilience and steady growth. Starting at 4,620,401 units in 2017, there was a brief lull in 2018 and 2019. However, subsequent years witnessed a notable uptick, underscoring a robust demand for these vehicles. Projections indicated that by 2023, this segment would hit 6,042,081 units, showcasing a remarkable recovery and growth trajectory. In contrast, the light commercial vans segment registered a decline from 1,176,110 units in 2017 to 885,614 units in 2019. While there has been a modest rebound since 2019, it has not matched the pace of pickup trucks. The forecast for 2023 stood at 1,082,025 units for light commercial vans, indicating a steady but moderate demand for these vehicles.
- The medium-duty commercial trucks segment of the Asia-Pacific commercial vehicles market has faced challenges in recent years. After peaking at 461,391 units in 2017, it experienced a significant drop to 327,819 units by 2019. However, there were positive signs of recovery, with projections indicating a rise to 492,106 units by 2023. In the heavy-duty commercial trucks segment, a distinct pattern emerges. While the figures fluctuated between 2017 and 2021, the overall trend has been upward. Starting at 1,459,599 units in 2017, there was a peak in 2020 at 1,754,298 units. Despite a dip in 2021, the segment rebounded strongly, with 2,318,219 units projected for 2023.
- Lastly, the buses segment, crucial for mass transit, initially saw a decline from 680,162 units in 2017 to 546,164 units in 2019 across the Asia-Pacific market. However, the post-2019 period has been marked by stabilization and gradual growth, with projections indicating a rise to 709,944 units by 2023.
Asia-Pacific is likely to continue witnessing a consistent increase in CV registrations, supporting the region's expanding logistical and commercial demands
- The relocation of industrial output, primarily to China, has opened up trade channels, indirectly benefiting the commercial vehicle market and the logistics sector. With the growth of the logistics and e-commerce sectors, the demand for LCVs is expected to rise. The expanding Chinese economy has led to an increase in disposable income for the middle class, driving up demand for both commercial and passenger vehicles. Additionally, the nation's low production costs have fueled a significant surge in automobile demand over the past five years.
- The Asia-Pacific commercial vehicles market faced a setback during the COVID-19 outbreak, with local authorities imposing restrictions on commerce and travel. This led to a sharp decline in commercial vehicle sales. The pandemic shifted consumer preferences toward low-cost goods, reshaping the local commercial vehicle market.
- Despite hurdles, the Indian government is committed to developing a shared, connected, and electric mobility ecosystem. Such initiatives are expected to drive the growth of commercial electric vehicles in the long term. Asian governments are projected to invest USD 26 trillion in infrastructure by 2030, significantly bolstering the transportation of construction materials and machinery across Asia-Pacific. Stringent pollution regulations have prompted automakers (OEMs) to pivot toward electric vehicles. With a growing understanding of the future of mobility, modern start-ups and entrepreneurs are increasingly favoring commercial electric vehicles.
Asia-Pacific Commercial Vehicles Market Trends
APAC's rapid electric vehicle demand and sales growth are driven by government initiatives and commercial vehicle electrification
- Electric vehicle (EV) demand and sales have surged in the APAC region in recent years. China, the dominant market, saw a 2.90% rise in electric car sales in 2022 compared to 2021, while Japan experienced an 11.11% increase during the same period. Factors driving this trend include mounting environmental concerns, stringent regulations, and the advantages of EVs, such as fuel efficiency, lower maintenance costs, and zero carbon emissions. Government subsidies further bolster the adoption of EVs in Asian nations.
- Conventional fuel-powered commercial vehicles, notably trucks and buses, are contributing to the escalating pollution levels in several Asia-Pacific countries. In response, many nations in the region are making substantial investments to transition their internal combustion engine (ICE) vehicles to electric ones, aiming to curb carbon emissions. For instance, in December 2020, TransJakarta, a city-owned bus operator in Indonesia, unveiled an ambitious plan to expand its electric bus (e-bus) fleet to 10,000 units by 2030. Such initiatives across the region are propelling the electrification of commercial vehicles.
- Government bodies in various APAC countries are actively proposing measures to phase out fossil fuel vehicles, a move that is poised to bolster the market for electric commercial vehicles. In a notable development, in May 2022, Tata Motors secured a government contract in India to supply 5,450 electric buses worth INR 5,000 crore under the FAME 2 scheme. Additionally, the company announced plans to deliver 20,000 light electric trucks to six major e-commerce players. These advancements in the EV space are anticipated to further fuel the demand for electric commercial vehicles in the APAC region from 2024 to 2030.
Asia-Pacific Commercial Vehicles Industry Overview
The Asia-Pacific Commercial Vehicles Market is fragmented, with the top five companies occupying 31.67%. The major players in this market are Anhui Ankai Automobile Co. Ltd., Dongfeng Motor Corporation, Isuzu Motors Limited, Toyota Motor Corporation and Wuling Motors Holdings Limited (sorted alphabetically).
Additional Benefits:
- The market estimate (ME) sheet in Excel format
- 3 months of analyst support
TABLE OF CONTENTS
1 EXECUTIVE SUMMARY & KEY FINDINGS
2 REPORT OFFERS
3 INTRODUCTION
- 3.1 Study Assumptions & Market Definition
- 3.2 Scope of the Study
- 3.3 Research Methodology
4 KEY INDUSTRY TRENDS
- 4.1 Population
- 4.2 GDP Per Capita
- 4.3 Consumer Spending For Vehicle Purchase (cvp)
- 4.4 Inflation
- 4.5 Interest Rate For Auto Loans
- 4.6 Impact Of Electrification
- 4.7 EV Charging Station
- 4.8 Battery Pack Price
- 4.9 New Xev Models Announced
- 4.10 Logistics Performance Index
- 4.11 Fuel Price
- 4.12 Oem-wise Production Statistics
- 4.13 Regulatory Framework
- 4.14 Value Chain & Distribution Channel Analysis
5 MARKET SEGMENTATION (includes market size in Value in USD and Volume, Forecasts up to 2029 and analysis of growth prospects)
- 5.1 Vehicle Type
- 5.1.1 Commercial Vehicles
- 5.1.1.1 Buses
- 5.1.1.2 Heavy-duty Commercial Trucks
- 5.1.1.3 Light Commercial Pick-up Trucks
- 5.1.1.4 Light Commercial Vans
- 5.1.1.5 Medium-duty Commercial Trucks
- 5.1.1 Commercial Vehicles
- 5.2 Propulsion Type
- 5.2.1 Hybrid and Electric Vehicles
- 5.2.1.1 By Fuel Category
- 5.2.1.1.1 BEV
- 5.2.1.1.2 FCEV
- 5.2.1.1.3 HEV
- 5.2.1.1.4 PHEV
- 5.2.2 ICE
- 5.2.2.1 By Fuel Category
- 5.2.2.1.1 CNG
- 5.2.2.1.2 Diesel
- 5.2.2.1.3 Gasoline
- 5.2.2.1.4 LPG
- 5.2.1 Hybrid and Electric Vehicles
- 5.3 Country
- 5.3.1 Australia
- 5.3.2 China
- 5.3.3 India
- 5.3.4 Indonesia
- 5.3.5 Japan
- 5.3.6 Malaysia
- 5.3.7 South Korea
- 5.3.8 Thailand
- 5.3.9 Rest-of-APAC
6 COMPETITIVE LANDSCAPE
- 6.1 Key Strategic Moves
- 6.2 Market Share Analysis
- 6.3 Company Landscape
- 6.4 Company Profiles
- 6.4.1 Anhui Ankai Automobile Co. Ltd.
- 6.4.2 Daihatsu Motor Co. Ltd.
- 6.4.3 Dongfeng Motor Corporation
- 6.4.4 Ford Motor Company
- 6.4.5 General Motors Company
- 6.4.6 Great Wall Motor Company Ltd (GWM)
- 6.4.7 Honda Motor Co. Ltd.
- 6.4.8 Hyundai Motor Company
- 6.4.9 Isuzu Motors Limited
- 6.4.10 Kia Corporation
- 6.4.11 Mazda Motor Corporation
- 6.4.12 Mitsubishi Motors Corporation
- 6.4.13 Nissan Motor Co. Ltd.
- 6.4.14 Renault-Nissan-Mitsubishi Alliance
- 6.4.15 Subaru Corporation
- 6.4.16 Suzuki Motor Corporation
- 6.4.17 Tata Motors Limited
- 6.4.18 Toyota Motor Corporation
- 6.4.19 Wuling Motors Holdings Limited
7 KEY STRATEGIC QUESTIONS FOR VEHICLES CEOS
8 APPENDIX
- 8.1 Global Overview
- 8.1.1 Overview
- 8.1.2 Porter's Five Forces Framework
- 8.1.3 Global Value Chain Analysis
- 8.1.4 Market Dynamics (DROs)
- 8.2 Sources & References
- 8.3 List of Tables & Figures
- 8.4 Primary Insights
- 8.5 Data Pack
- 8.6 Glossary of Terms


샘플 요청 목록