|
시장보고서
상품코드
1693766
아시아태평양의 바이오 비료 시장 : 시장 점유율 분석, 산업 동향 및 통계, 성장 예측(2025-2030년)Asia-Pacific Biofertilizer - Market Share Analysis, Industry Trends & Statistics, Growth Forecasts (2025 - 2030) |
||||||
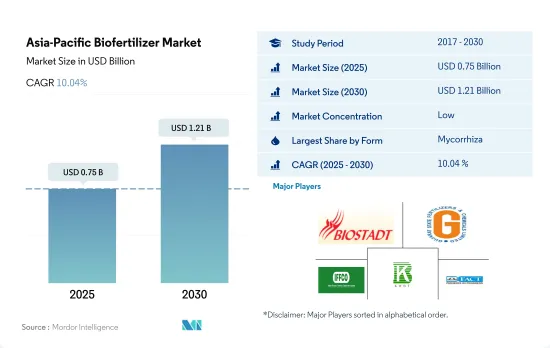
아시아태평양의 바이오 비료 시장 규모는 2025년에는 7억 5,000만 달러에 이르고, 2030년에는 12억 1,000만 달러에 달할 것으로 예상되며, 예측 기간 중(2025-2030년) CAGR은 10.04%를 나타낼 것으로 전망됩니다.

- 바이오 비료는 살아있는 미생물이며 토양의 양분 이용 가능성을 동원하거나 증가시킴으로써 식물의 영양을 촉진합니다. 이 지역의 바이오 비료 시장은 2017-2022년에 걸쳐 금액 기준으로 2.4%의 CAGR을 나타냈습니다.
- 이 바이오 비료 중에서 아조토박터는 아시아태평양에서 두 번째로 널리 이용되고 있으며, 2022년에는 1억 4,180만 달러로 시장의 24.6%를 차지했습니다.
- 바이오 비료의 소비는 연작 작물로 압도적으로 많아, 2022년에는 약 4억 7,910만 달러로 평가되었습니다. 연작 작물의 우위성은 주로 유기 재배 면적이 큰 것에 기인하고 있어, 2022년에는 이 지역의 유기 작물 재배 면적의 약 67.5%를 차지했습니다.
- 유기농 작물 생산의 확대와 국내외 시장에서의 유기 제품에 대한 수요가 높아짐에 따라 유기농업과 지속 가능한 농업을 추진하는 지역 각국의 정부의 대처가 증가하고 있습니다.
- 아시아태평양의 유기 재배 면적은 2017-2022년에 걸쳐 크게 확대되었으며, 각각 310만 헥타르에서 380만 헥타르가 되었습니다.
- 아시아태평양에서 두 번째로 인기 있는 바이오 비료는 아조토박터로, 2022년에는 시장의 24.6%를 차지해 1억 4,180만 달러에 달했습니다.
- 바이오이노큘란트로서의 아조토박터는 니코틴산, 비오틴, 헤테로아옥신, 비타민 B, 지베렐린 등 뿌리 개발과 미네랄 흡수를 지원하는 생물학적으로 활성인 화합물을 대량으로 합성 농업생산성을 10-12% 높인다는 것이 입증되었습니다.
- 중국은 2022년 바이오 비료 시장 전체의 93.5%를 차지했으며, 이 지역의 지배적인 나라가 되었습니다. 2022년 중국의 바이오 비료 시장은 농작물이 82.3%를 차지해 압도적이었습니다. 2022년에는 210만 헥타르의 유기 재배 면적이 확보되었습니다.
- 유기농 제품에 대한 소비자의 관심이 높아짐에 따라 농업 종사자들은 농약 투입에 의존하는 단점을 인식하게 되어 유기 재배 면적이 증가하고 있습니다. 아시아태평양의 바이오 비료 수요는 2023-2029년 사이에 CAGR 8.6%를 나타낼 것으로 예측됩니다.
아시아태평양의 바이오 비료 시장 동향
중국, 인도, 인도네시아, 호주 등의 국가에서 정부 지원이 확대되어 이 지역의 유기농업을 뒷받침
- FiBL의 통계에 따르면 아시아태평양의 유기농지면적은 2021년에는 370만 ha를 넘어 세계 유기농지면적의 26.4%를 차지했습니다. 유기 재배 면적은 2017-2022년 사이에 19.3% 증가했습니다. 2020년 기준 이 지역의 유기농 생산자는 183만명으로 인도는 130만명으로 최고였습니다. 중국, 인도, 인도네시아, 호주는 이 지역에서 유기농 면적이 큰 주요 국가입니다. 중국과 인도 등 정부 당국은 작물 재배에서 화학물질에 대한 의존도를 줄이기 위해 유기농업을 지속적으로 추진하고 있습니다. 예를 들어 인도는 Paramparagat Krishi Vikas Yojana와 All India Network Programme on Organic Farming(AI-NPOF)과 같은 제도를 실시했습니다.
- 2021년에는 중국이 250만 ha로 66.1%의 최대 점유율을 차지한 다음 인도가 19.3%, 인도네시아가 1.5%, 호주가 1.4%였습니다. 연작 작물은 이 지역의 유기농지의 67.5%, 즉 250만ha를 차지하고, 큰 점유율을 차지하고 있습니다.
- 환금작물의 점유율은 2위로 2021년에는 70만ha가 되어 유기농지의 18.5%를 차지했습니다.
유기농 제품에 대한 1인당 지출은 호주가 압도적으로 많아 중국의 유기농 식품 시장이 크게 성장
- 이 지역의 유기농 제품에 대한 1인당 지출은 2021년에는 85.1달러를 기록했습니다.
- 중국의 유기농 식품 시장은 2021년에 13.3% 성장하여 2023-2029년에 걸쳐의 CAGR은 7.1%를 나타내 플러스 성장 패턴이 계속될 것으로 예측됩니다. 또한 어머니의 취업수 증가와 건강과 웰니스 동향 채용 증가로 유기농 아기 식품 수요가 높아지고 있기 때문에 유기농 제품은 2025년까지 64억 달러 규모에 이를 것으로 예측됩니다.
- 인도의 유기농 제품은 세계 수요의 1.0%로 멀지 않고, 2021년 1인당 지출액은 불과 0.08달러였습니다. 하지만 인도 시장은 향후 수년간 성장해 왔으며, 2025년에는 1억 5,330만 달러에 달할 가능성이 있습니다. 현재이 지역의 유기농 제품 시장은 매우 세분화되어 있으며 일부 슈퍼마켓과 전문점 만이 유기농 제품을 판매합니다. 소비자 지식 증가와 구매 패턴의 변화는 이 지역의 유기농 식품의 지속가능성에 대한 이해를 깊게 할 수 있습니다. 1인당 소득 증가와 유기농 식품의 중요성에 대한 소비자 의식 향상으로 아시아태평양 유기농 식품에 대한 1인당 지출이 증가할 수 있습니다.
아시아태평양의 바이오 비료 산업 개요
아시아태평양의 바이오 비료 시장은 세분화되어 있으며 상위 5개 기업에서 30.04%를 차지합니다. 이 시장의 주요 기업은 Biostadt India Limited, Gujarat State Fertilizers & Chemicals Ltd, Indian Farmers Fertiliser Cooperative Limited, Kiwa Bio-Tech, The Fertilizers, Chemicals Travancore Limited 등입니다.
기타 혜택
- 엑셀 형식 시장 예측(ME) 시트
- 3개월의 애널리스트 서포트
목차
제1장 주요 요약과 주요 조사 결과
제2장 보고서 제안
제3장 서론
- 조사의 전제조건과 시장 정의
- 조사 범위
- 조사 방법
제4장 주요 산업 동향
- 유기 재배 면적
- 1인당 유기농 제품에 대한 지출
- 규제 프레임워크
- 호주
- 중국
- 인도
- 인도네시아
- 일본
- 필리핀
- 태국
- 베트남
- 밸류체인과 유통채널 분석
제5장 시장 세분화
- 형태
- 아조스피릴룸
- 아조토박터
- 마이코리자
- 인산염 가용화 박테리아
- 리조비움
- 기타 바이오 비료
- 작물 유형
- 환금작물
- 원예작물
- 경작작물
- 생산국
- 호주
- 중국
- 인도
- 인도네시아
- 일본
- 필리핀
- 태국
- 베트남
- 기타 아시아태평양
제6장 경쟁 구도
- 주요 전략 동향
- 시장 점유율 분석
- 기업 상황
- 기업 프로파일
- Atlantica Agricola
- Biolchim SpA
- Biostadt India Limited
- Gujarat State Fertilizers & Chemicals Ltd
- Indian Farmers Fertiliser Cooperative Limited
- IPL Biologicals Limited
- Kiwa Bio-Tech
- Sustane Natural Fertilizer Inc.
- Symborg Inc.
- The Fertilizers and Chemicals Travancore Limited
제7장 CEO에 대한 주요 전략적 질문
제8장 부록
- 세계 개요
- 개요
- Five Forces 분석 프레임워크
- 세계의 밸류체인 분석
- 시장 역학(DROs)
- 정보원과 참고문헌
- 도표 일람
- 주요 인사이트
- 데이터 팩
- 용어집
The Asia-Pacific Biofertilizer Market size is estimated at 0.75 billion USD in 2025, and is expected to reach 1.21 billion USD by 2030, growing at a CAGR of 10.04% during the forecast period (2025-2030).
- Biofertilizers are live microorganisms that promote plant nutrition by mobilizing or increasing nutrient availability in soils. Mycorrhiza, Azospirillum, Azotobacter, Rhizobium, and phosphate-solubilizing bacteria are the microorganisms most commonly utilized as biofertilizers in agriculture. The biofertilizer market in the region grew by 2.4% (CAGR) between 2017 and 2022 by value. However, the market value of biofertilizers is anticipated to increase by about 9.9% (CAGR) between 2023 and 2029.
- Among these biofertilizers, Azotobacter is the second most widely utilized in the Asia Pacific region, accounting for 24.6% of the market in 2022, with a value of USD 141.8 million. Azotobacter is a nitrogen-fixing bacterium that does not require symbiotic relationships to fix atmospheric nitrogen and make it available to plants. It is used as a biofertilizer for all non-leguminous plants, including rice, cotton, and vegetables.
- The consumption of biofertilizers is dominant in row crops, valued at about USD 479.1 million in 2022. The major row crops cultivated in the region include rice, wheat, barley, corn, and soybeans. The dominance of row crops is mainly due to their large organic cultivation area, which accounted for about 67.5% of the region's organic crop cultivation area in 2022.
- Government initiatives in various regional countries to promote organic or sustainable farming have increased in response to growing organic crop production and the rising demand for organic products in both domestic and international markets. These factors may have an impact on the market throughout the forecast period. The value of the Asia-Pacific biofertilizer market is anticipated to grow by about 9.9% (CAGR) between 2023 and 2029,.
- The organic area under cultivation in Asia-Pacific expanded significantly from 2017 to 2022, going from 3.1 million hectares to 3.8 million hectares, respectively. Owing to the growing demand for organically cultivated food in many Asia-Pacific countries. As a result, the Asia-Pacific biofertilizer market grew by 2.4% (CAGR) between 2017 and 2022.
- The second most popular biofertilizer in Asia-Pacific is Azotobacter, which accounted for 24.6% of the market in 2022, valued at USD 141.8 million. It can be used as a biofertilizer in agriculture to make crop production more sustainable through its ability to fix nitrogen and solubilize bacteria76
- Azotobacter as bioinoculants have been demonstrated to increase agricultural productivity by 10-12%, leading to the synthesis of significant amounts of biologically active compounds, including nicotinic acid, biotin, heteroauxins, vitamin B, and gibberellins, which support root development and mineral absorption. The majority of non-leguminous crops, including rice, wheat, millets, cotton, tomato, cabbage, mustard, and safflower, are recommended for Azotobacter use.
- China held 93.5% of the total biofertilizer market value in 2022, making it the dominant country in the region. Row crops dominated the Chinese biofertilizer market in 2022, accounting for 82.3%. Row crops held a major organic acreage in the country, which was 2.1 million hectares in 2022.
- Due to rising consumer interest in organic products, farmers have become more aware of the disadvantages of relying on agricultural chemical inputs and rising organic acreage. The demand for biofertilizers in Asia-Pacific is anticipated to increase between 2023 and 2029, with a CAGR of 8.6%.
Asia-Pacific Biofertilizer Market Trends
Growing government support in countries like China, India, Indonesia, and Australia, boosts organic farming in the region
- The area of organic agricultural land in Asia-Pacific was over 3.7 million ha in 2021, representing 26.4% of the global organic area, as per FiBL statistics. The organic area under cultivation grew by 19.3% between 2017-2022. As of 2020, the region had 1.83 million organic producers, with India topping the list with 1.3 million organic producers. China, India, Indonesia, and Australia are the major countries with large organic cultivation areas in the region. Government authorities in countries like China and India are constantly promoting organic agriculture to reduce reliance on chemical inputs for crop cultivation. For instance, India has implemented schemes like Paramparagat Krishi Vikas Yojana and the All India Network Programme on Organic Farming (AI-NPOF).
- In 2021, China accounted for a maximum share of 66.1%, with 2.5 million ha, followed by India, Indonesia, and Australia, with 19.3%, 1.5%, and 1.4%, respectively. The total organic land is divided into three crop types, namely row crops, horticultural crops, and cash crops. Row crops occupy a major share of organic agricultural land in the region, accounting for 67.5% share, i.e., 2.5 million ha in 2021. The major row crops grown in the region include paddy, wheat, pulses, soybeans, and millets.
- Cash crops held the second largest share, with 0.7 million ha in 2021, accounting for an 18.5% share of organic cropland. The demand for organic cash crops like sugar and organic tea is increasing worldwide. China and India are the largest organic green and black tea producers, respectively. The growing international demand is expected to increase the organic acreages in the region.
Per capita spending on organic product predominant in Australia and China's organic food market growing significantly
- The per capita spending on organic products in the region was recorded at USD 85.1 in 2021. Australia witnessed a higher per capita spending on organic products, with USD 34.49 in the same year, attributed to the higher demand due to consumers' perception of organic food as healthy. As per the Global Organic Trade data, the organic packaged food and beverage market in Australia was valued at USD 885.2 million in 2021.
- China's organic food market grew by 13.3% in 2021, and the positive growth pattern is expected to continue, with a CAGR of 7.1% between 2023 and 2029. With an increasing emphasis on the importance of organic products among the younger generation and the rising demand for organic baby food due to the growing number of mothers in the workforce and the increasing adoption of the health and wellness trend, organic products are expected to reach a value of USD 6.4 billion by 2025.
- Organic products in India represent far less than 1.0% of global demand, with a per capita expenditure of just USD 0.08 in 2021. However, the Indian market may grow over the coming years, reaching a value of USD 153.3 million by 2025. Currently, the region's organic goods market is highly fragmented, with just a few supermarkets and specialty stores selling them, as people from higher-income families are the only potential customers. Growing consumer knowledge and changing buying patterns may lead to a better understanding of organic food sustainability in the region. Increasing per capita income and increased consumer awareness of the importance of organic food can raise per capita expenditure on organic food items in the Asia-Pacific region.
Asia-Pacific Biofertilizer Industry Overview
The Asia-Pacific Biofertilizer Market is fragmented, with the top five companies occupying 30.04%. The major players in this market are Biostadt India Limited, Gujarat State Fertilizers & Chemicals Ltd, Indian Farmers Fertiliser Cooperative Limited, Kiwa Bio-Tech and The Fertilizers and Chemicals Travancore Limited (sorted alphabetically).
Additional Benefits:
- The market estimate (ME) sheet in Excel format
- 3 months of analyst support
TABLE OF CONTENTS
1 EXECUTIVE SUMMARY & KEY FINDINGS
2 REPORT OFFERS
3 INTRODUCTION
- 3.1 Study Assumptions & Market Definition
- 3.2 Scope of the Study
- 3.3 Research Methodology
4 KEY INDUSTRY TRENDS
- 4.1 Area Under Organic Cultivation
- 4.2 Per Capita Spending On Organic Products
- 4.3 Regulatory Framework
- 4.3.1 Australia
- 4.3.2 China
- 4.3.3 India
- 4.3.4 Indonesia
- 4.3.5 Japan
- 4.3.6 Philippines
- 4.3.7 Thailand
- 4.3.8 Vietnam
- 4.4 Value Chain & Distribution Channel Analysis
5 MARKET SEGMENTATION (includes market size in Value in USD and Volume, Forecasts up to 2030 and analysis of growth prospects)
- 5.1 Form
- 5.1.1 Azospirillum
- 5.1.2 Azotobacter
- 5.1.3 Mycorrhiza
- 5.1.4 Phosphate Solubilizing Bacteria
- 5.1.5 Rhizobium
- 5.1.6 Other Biofertilizers
- 5.2 Crop Type
- 5.2.1 Cash Crops
- 5.2.2 Horticultural Crops
- 5.2.3 Row Crops
- 5.3 Country
- 5.3.1 Australia
- 5.3.2 China
- 5.3.3 India
- 5.3.4 Indonesia
- 5.3.5 Japan
- 5.3.6 Philippines
- 5.3.7 Thailand
- 5.3.8 Vietnam
- 5.3.9 Rest of Asia-Pacific
6 COMPETITIVE LANDSCAPE
- 6.1 Key Strategic Moves
- 6.2 Market Share Analysis
- 6.3 Company Landscape
- 6.4 Company Profiles (includes Global Level Overview, Market Level Overview, Core Business Segments, Financials, Headcount, Key Information, Market Rank, Market Share, Products and Services, and Analysis of Recent Developments).
- 6.4.1 Atlantica Agricola
- 6.4.2 Biolchim SpA
- 6.4.3 Biostadt India Limited
- 6.4.4 Gujarat State Fertilizers & Chemicals Ltd
- 6.4.5 Indian Farmers Fertiliser Cooperative Limited
- 6.4.6 IPL Biologicals Limited
- 6.4.7 Kiwa Bio-Tech
- 6.4.8 Sustane Natural Fertilizer Inc.
- 6.4.9 Symborg Inc.
- 6.4.10 The Fertilizers and Chemicals Travancore Limited
7 KEY STRATEGIC QUESTIONS FOR AGRICULTURAL BIOLOGICALS CEOS
8 APPENDIX
- 8.1 Global Overview
- 8.1.1 Overview
- 8.1.2 Porter's Five Forces Framework
- 8.1.3 Global Value Chain Analysis
- 8.1.4 Market Dynamics (DROs)
- 8.2 Sources & References
- 8.3 List of Tables & Figures
- 8.4 Primary Insights
- 8.5 Data Pack
- 8.6 Glossary of Terms