|
시장보고서
상품코드
1842544
분석 기기 : 시장 점유율 분석, 산업 동향, 통계, 성장 예측(2025-2030년)Analytical Instrumentation - Market Share Analysis, Industry Trends & Statistics, Growth Forecasts (2025 - 2030) |
||||||
분석 기기 시장은 2025년에 552억 9,000만 달러, 2030년에는 768억 7,000만 달러에 이를 것으로 예상되며, CAGR 6.81%를 나타내 고정밀 측정 툴의 견조한 확대를 나타내고 있습니다.

의약품 및 환경 모니터링의 규제 감시 강화, 3nm 미만의 반도체 노드의 급속한 미세화, 인공지능과 실험실 하드웨어의 융합이 모든 주요 최종 사용자 그룹에서의 채용을 뒷받침하고 있습니다. 공급업체는 지속적인 의약품 제조를 위한 실시간 방출 테스트 솔루션, PFAS 제어를 위한 초미량 분광 분석 플랫폼, 생물학적 제형 파이프라인을 지원하는 멀티오믹스 질량 분석에 대한 투자를 강화하고 있습니다. 동시에 헬륨 공급 불안정이 가스 크로마토그래피 워크플로우를 재구성하고 분석 화학의 인력 부족이 계속되고 있기 때문에 아웃소싱 비용이 상승하고 구매자는 자동화를 지향하고 있습니다. 이러한 요인들이 함께 분석 기기 시장은 가격 경쟁력을 유지하고 업그레이드를 가속화하고 있습니다.
세계의 분석 기기 시장 동향과 인사이트
생물 제제의 QA/QC에서 하이픈 넣기 기술 채택 증가
복잡한 생물학적 제제에 대한 수요가 증가함에 따라 제조업체는 단일 차원 방법에서 하이픈 화 액체 크로마토그래피 질량 분석 플랫폼으로의 교체를 촉진합니다. 현재 바이오 의약품 공장의 78% 가까이가 품질 업무에 최소한 하나의 하이픈 넣기 워크플로우를 도입하고 있어 2023년 수준에서 상승하여 중요한 품질 속성의 다속성 모니터링이 가능해 배치 불합격률을 15% 삭감할 수 있습니다. 향상된 시스템 통합을 통해 번역 후 수정의 실시간 프로파일링이 가능해지고 스케일업 및 릴리스 일정이 가속화됩니다. 향상된 시스템 통합을 통해 번역 후 수정의 실시간 프로파일링이 가능해지고 확장 및 릴리스 일정이 가속화됩니다. 이러한 이점을 통해 자본 예산은 고해상도 LC-MS/MS로 향해 자동 데이터 파이프라인에 공급업체의 투자를 강화하고 있습니다.
PFAS와 마이크로 플라스틱의 세계 규제 강화가 초미량 분석을 뒷받침
2024년 미국 식수 규제와 병행하는 유럽 지침의 1조분의 1 규제로 실험실은 차세대 고분해능 질량 분석기와 1µm까지의 입자를 식별할 수 있는 라만 또는 FTIR 현미경을 추가했습니다. 이러한 추세는 초단쇄 PFAS 검출이 의무화됨에 따라 지속될 것으로 보입니다. 시장 리더는 현재 런타임 간격을 연장하고 감지 임계값을 낮추는 자동 샘플 준비를 번들로 제공하여 소모품의 경상 수익을 강화하고 있습니다.
고해상도 MS의 높은 총 소유 비용
플래그십 질량 분석기의 가격은 50만 달러에서 150만 달러 사이이지만, 서비스 계약, 인프라 리노베이션 및 특수 소모품으로 인해 5년간의 운영비가 구매 가격을 초과하는 경우가 많습니다. 신흥 시장의 실험실은 관세 및 현지 서비스 능력의 제한으로 TCO가 30%에서 45% 높아집니다. 이러한 장벽은 규제가 강화되어도 수질과 식품안전환경에서의 채용을 늦추고, 벤더에 합리화된 '밸류엔지니어링' 모델과 공유서비스 허브의 전개를 촉진하고 있습니다.
부문 분석
크로마토그래피 시스템은 2024년에 154억 8,000만 달러의 수익을 올렸으며 분석 기기 시장 점유율의 28%를 차지했습니다. AI를 활용한 캘리브레이션 루틴이 처리량을 최대 70% 향상시키는 한편, 예측 알고리즘은 유지보수 필요성을 나타내며 HPLC와 가스 크로마토그래프 모두에서 지속적인 업그레이드를 지원합니다. 환경 실험실에서는 PFAS를 프로파일링할 필요성 때문에 첨단 컬럼 화학 및 탠덤 검출기 수요가 부활하고 있습니다. 한편 질량 분석계는 가장 급속히 확대하고 있는 제품군으로 이동도 정합 단편화에 의한 병렬 어큐뮬레이션 등의 이온 모빌리티 혁신이 샘플 처리량을 5배로 하고 감도의 상한을 밀어 올리기 때문에 2030년까지의 CAGR은 7.1%를 나타낼 전망입니다.
질량분석계의 분석 기기 시장 규모는 임상 단백질체학, 식품의 진정성, 배터리 재료 등 보다 깊은 분자 수준의 인사이트가 필요한 산업 분야에서의 이용이 진행되고 있습니다. 트리플 쿼드러플과 Q-TOF 구성은 속도와 분해능의 균형으로 새로운 도입의 대부분을 차지합니다. 공급업체의 로드맵은 하드웨어 진보와 클라우드 기반 디컨볼루션 플랫폼을 결합한 초고자장 Orbitrap 및 timsTOF 아키텍처를 중심으로 구축되어 데이터 처리 시간을 단축하고 분석가의 소중한 시간을 확보합니다. 분자분광법은 여전히 일상적인 QA/QC의 핵심 수익의 기둥이지만, 인라인 프로브가 실시간으로 블렌드의 균일성을 검증하는 의약품의 연속 제조에서는 라만이 상승하고 있습니다.
고성능·초고속 액체 크로마토그래피 시스템은 재현성과 매트릭스 내성으로 인해 역가, 불순물, 안정성 시험에 필수적이기 때문에 이 카테고리의 56%를 차지하여 86억 7,000만 달러에 달했습니다. 인공지능 플러그인이 그라디언트 설계, 이동상 선택, 장해 예측을 자동화하여 컬럼 낭비를 생략하면서 샘플 처리량을 최대 70% 향상시킵니다. 마이크로플루이딕스 칩 컬럼은 단백질체학 워크플로우에 도입되어 고속 스캔 질량 분석기와 동기화된 서브미니츠 분리를 실현하여 데이터가 풍부한 멀티오믹스 연구를 지원합니다.
초임계 유체 크로마토그래피는 2030년까지 연평균 복합 성장률(CAGR) 7.3%로 진보할 것으로 예상되며, 액상 분리 중 가장 빠른 속도로 진보하고 있습니다. CO2와 최소한의 공용매를 사용하면 그린 케미컬의 목표를 달성하고 샘플당 용매 비용을 낮출 수 있으므로 키랄 약물 스크리닝과 불순물 분리에 매력적인 투자 회수가 가능합니다. 가스 크로마토그래피는 휘발성 분석에 필수적이지만, 헬륨 부족으로 인해 운전 비용이 상승하고 수소 캐리어와 마이크로채널로의 전환이 가속화되고 있습니다. 이온 크로마토그래피는 규제 당국이 식수 및 산업 폐수의 이온성 오염물질의 규제치를 엄격하게 했기 때문에 다시 주목받고 있습니다. 유틸리티 회사는 24시간 365일 모니터링을 지원할 수 있는 자동 인라인 억제 시스템을 추가하라는 메시지가 표시됩니다.
지역 분석
북미는 2024년에 193억 5,000만 달러를 창출해 분석 기기 시장의 35%에 해당했습니다. 수요는 FDA 주도의 실시간 방출 시험, EPA가 의무화한 1조분의 1PFAS 규제, 서브 나노미터 계측을 사양으로 하는 새로운 공장에 자금을 제공하는 520억 달러의 CHIPS법에 지지되고 있습니다. 실험실은 헬륨 비용과 용매 폐기를 줄이기 위해 수소 대응 가스 크로마토 그래프와 저소모량 HPLC 펌프를 채택하여 환경 친화적인 워크 플로우에 대한 의욕을 보여줍니다.
아시아태평양의 CAGR은 7.6%로 예측되는데, 이는 중국과 인도에서의 의약품 제조의 스케일 업, 대만과 한국에서의 첨단 로직과 메모리 생산을 반영하고 있습니다. 지역 정부는 수질 기준과 공업 배출 기준을 엄격히 하고 있으며, 국영 실험실이 ICP-MS, LC-MS/MS, 핸드헬드 라만 등의 여러 해 조달 계약을 입찰하도록 촉구하고 있습니다. 아시아태평양의 반도체 QA/QC에 할당되는 분석 기기 시장 규모는 주조 제조업체가 게이트 전주위 트랜지스터와 고대역폭 메모리 개발에 힘차게 하는 가운데 다른 모든 업종을 능가할 것으로 예측됩니다.
유럽은 규제 주도의 견고한 자세를 유지하고 있습니다. 유럽 그린딜은 전국 PFAS 모니터링, 순환 경제 연구, 무용매 크로마토그래피의 파일럿 사업에 자금을 제공합니다. 독일, 아일랜드 및 스위스의 의약품 허브는 PAT 분석을 통합한 연속 제조 라인을 통합합니다. 한편 남미와 중동 및 아프리카에서는 정유소, 농산물 수출업체, 광산사들이 국제무역인증을 충족하기 위해 실험실을 근대화해 꾸준히 소규모 성장을 기록하고 있습니다. TCO의 높이가 여전히 허들이기 때문에 판매자는 처음 구입하는 사람의 진입 장벽을 낮게 하는 리스·투·오운 방식이나 페이·파·샘플 방식을 점점 추진하고 있습니다.
기타 혜택 :
- 엑셀 형식 시장 예측(ME) 시트
- 3개월의 애널리스트 지원
목차
제1장 서론
- 조사 전제조건과 시장 정의
- 조사 범위
제2장 조사 방법
제3장 주요 요약
제4장 시장 상황
- 시장 개요
- 시장 성장 촉진요인
- 생물제제의 QA/QC에 있어서 하이프네이션 기술의 채용 증가
- PFAS와 마이크로 플라스틱에 관한 세계의 규제 강화에 의한 초미량 분석법의 뒷받침
- 제약 생산에서 실시간 방출 시험(RTRT)으로의 이동
- 반도체 노드의 3nm 미만으로의 미세화에는 초고감도 표면 분석 요구
- 재생 가능한 항공 연료 프로그램의 확대에 의한 원료 인증 촉진
- 인라보 분석에 의한 전지 기가팩토리의 품질 보증의 급증
- 시장 성장 억제요인
- 신흥 시장에 있어서 고분해능 MS의 총소유비용 높이
- 숙련 분석 화학자의 부족에 의한 아웃소싱 비용의 상승
- GC 오퍼레이션에 영향을 미치는 헬륨공급망 변동
- 규제 분야에서의 신규 분석법의 긴 밸리데이션 사이클
- 업계 생태계 분석
- 규제 전망
- 기술적 전망
- Porter's Porter's Five Forces
- 공급기업의 협상력
- 구매자의 협상력
- 신규 참가업체의 위협
- 대체품의 위협
- 경쟁도
제5장 시장 규모·성장 예측(금액)
- 제품 유형별
- 크로마토그래피 기기
- 가스 크로마토그래피(GC) 시스템
- 고성능/초고성능 액체 크로마토그래피(HPLC/UHPLC)
- 이온 크로마토그래피(IC) 시스템
- 초임계 유체 크로마토그래피(SFC) 시스템
- 분자 분광법
- 자외선-가시광선 분광계
- 푸리에 변환 적외선(FT-IR) 분광계
- 근적외선(NIR) 분광계
- 라만 분광계
- 형광 분광계
- 원소 분광법
- 원자 흡수 분광계(AAS)
- ICP-광방출 분광계(ICP-OES)
- ICP-질량 분석계(ICP-MS)
- X선 형광(XRF) 분광계
- 질량 분석법
- 단일 사중극자 질량 분석기 시스템
- 삼중 사중극자 질량 분석기 시스템
- 사중극자 비행시간 질량 분석기(Q-TOF) 시스템
- 오비트랩 및 FT-MS 시스템
- MALDI-TOF 질량 분석기 시스템
- 분석 현미경 및 이미징 시스템
- 주사전자현미경(SEM)
- 투과전자현미경(TEM)
- 원자력현미경(AFM)
- 공초점 및 광학 현미경
- 표면, 열 및 입자 특성 분석 장치
- X선 회절(XRD) 시스템
- 열 분석 장치(DSC, TGA 등)
- 입자 크기 및 제타 전위 분석기
- 소모품 및 액세서리
- 데이터 관리 소프트웨어 및 서비스
- 크로마토그래피 기기
- 최종 사용자 산업별
- 제약 및 바이오의약품
- 신약 개발 및 연구
- 제조 품질 보증/품질 관리
- 임상 및 진단 실험실
- 환경 시험 실험실
- 식음료 시험
- 화학 및 석유화학
- 석유 및 가스(상류, 중류, 하류)
- 재료 과학 및 야금
- 반도체 및 일렉트로닉스
- 학술 및 정부 연구 기관
- 법의학 및 보안
- 상하수도 시설
- 제약 및 바이오의약품
- 지역별
- 북미
- 미국
- 캐나다
- 멕시코
- 유럽
- 독일
- 영국
- 프랑스
- 이탈리아
- 스페인
- 북유럽
- 기타 유럽
- 아시아태평양
- 중국
- 일본
- 한국
- 인도
- 동남아시아
- 호주
- 기타 아시아태평양
- 남미
- 브라질
- 기타 남미
- 중동 및 아프리카
- 중동
- 아랍에미리트(UAE)
- 사우디아라비아
- 기타 중동
- 아프리카
- 남아프리카
- 기타 아프리카
- 북미
제6장 경쟁 구도
- 시장의 집중
- 전략적인 동향(M&A, 제휴, 자금 조달)
- 시장 점유율 분석
- 기업 프로파일
- Agilent Technologies, Inc.
- Thermo Fisher Scientific Inc.
- Shimadzu Corporation
- Danaher Corporation(SCIEX, Leica Microsystems)
- Bruker Corporation
- Waters Corporation
- PerkinElmer Inc.
- Metrohm AG
- Mettler Toledo International Inc.
- Malvern Panalytical Ltd.(Spectris)
- Hitachi High-Tech Corporation
- HORIBA, Ltd.
- JEOL Ltd.
- Anton Paar GmbH
- Bio-Rad Laboratories, Inc.
- ZEISS Group
- Oxford Instruments plc
- Nikon Instruments Inc.
- Rigaku Corporation
- LECO Corporation
- Sartorius AG
- Merck KGaA(MilliporeSigma)
제7장 시장 기회와 전망
KTH 25.11.05The analytical instrumentation market is valued at USD 55.29 billion in 2025 and is projected to reach USD 76.87 billion by 2030, reflecting a 6.81% CAGR and signaling robust expansion in high-precision measurement tools.
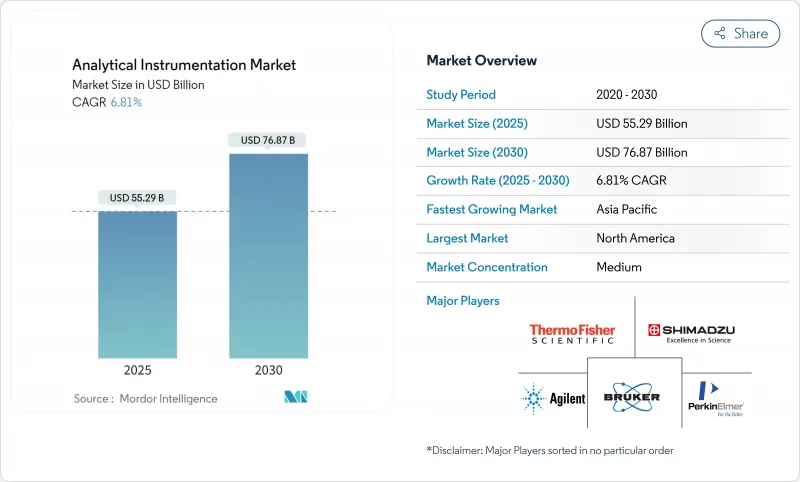
Increasing regulatory oversight in pharmaceuticals and environmental monitoring, rapid semiconductor node shrinkage below 3 nm, and the convergence of artificial intelligence with laboratory hardware are boosting adoption across every major end-user group. Vendors are intensifying investments in real-time release testing solutions for continuous pharmaceutical manufacturing, ultra-trace spectrometry platforms for PFAS control, and multi-omics mass spectrometry to support biologics pipelines. Simultaneously, helium supply volatility is reshaping gas chromatography workflows, while persistent talent shortages in analytical chemistry elevate outsourcing costs and nudge buyers toward automation. Together, these forces are sustaining pricing power and fueling incremental upgrades in the analytical instrumentation market.
Global Analytical Instrumentation Market Trends and Insights
Rising Adoption of Hyphenated Techniques for Biologics QA/QC
Growing demand for complex biologics is encouraging manufacturers to replace single-dimension methods with hyphenated liquid chromatography-mass spectrometry platforms. Nearly 78% of biopharmaceutical plants now deploy at least one hyphenated workflow in quality operations, up from 2023 levels, enabling multi-attribute monitoring of critical quality attributes and trimming batch rejection rates by 15%.Enhanced system integration allows real-time profiling of post-translational modifications, accelerating scale-up and release schedules. These gains are pushing capital budgets toward high-resolution LC-MS/MS and reinforcing supplier investments in automated data pipelines.
Stringent Global Limits on PFAS and Micro-plastics Boosting Ultra-Trace Spectrometry
Parts-per-trillion limits in the 2024 U.S. drinking-water rule and parallel European directives are forcing laboratories to add next-generation high-resolution mass spectrometers and Raman or FTIR microscopes capable of identifying particles down to 1 µm. Environmental labs increased capital outlays for such systems by 34% in 2024 alone, a trend likely to continue as ultrashort-chain PFAS detection becomes compulsory.Market leaders now bundle automated sample preparation that extends run-time intervals and lowers detection thresholds, thereby strengthening recurring consumables revenue.
High Total Cost of Ownership for High-Resolution MS
Pricing for flagship mass spectrometers ranges between USD 500,000 and USD 1.5 million, yet five-year operating expenses often exceed purchase price because of service contracts, infrastructure retrofits, and specialized consumables. Emerging-market labs face 30% to 45% higher TCO due to tariffs and limited local service capacity. These barriers delay adoption in water-quality and food-safety settings even as regulations tighten, prompting vendors to roll out streamlined "value-engineered" models and shared-service hubs.
Other drivers and restraints analyzed in the detailed report include:
- Shift Toward Real-Time Release Testing in Pharma Production
- Semiconductor Node Shrinkage Less than 3 nm Requiring Ultra-Sensitive Surface Analysis
- Shortage of Skilled Analytical Chemists Elevating Outsourcing Costs
For complete list of drivers and restraints, kindly check the Table Of Contents.
Segment Analysis
Chromatography systems generated USD 15.48 billion in revenue and commanded 28% of analytical instrumentation market share in 2024. AI-enabled calibration routines now boost throughput by up to 70% while predictive algorithms flag maintenance needs, supporting sustained upgrades in both HPLC and gas chromatograph. In environmental labs, the need to profile PFAS has revived demand for advanced column chemistries and tandem detectors. Mass spectrometry, meanwhile, represents the fastest-expanding product family, slated for 7.1% CAGR through 2030 as ion-mobility innovations such as parallel accumulation with mobility-aligned fragmentation quintuple sample throughput and push sensitivity ceilings .
The analytical instrumentation market size for mass spectrometers is benefiting from cross-industry uptake-clinical proteomics, food authenticity, and battery materials all require deeper molecular insight. Triple-quadrupole and Q-TOF configurations account for the bulk of new installations owing to their balance between speed and resolution. Supplier roadmaps center on ultrahigh-field Orbitrap and timsTOF architectures that couple hardware advances with cloud-based deconvolution platforms, trimming data-processing times and freeing scarce analyst hours. Molecular spectroscopy remains a core revenue pillar for routine QA/QC, though Raman is gaining ground in pharmaceutical continuous manufacturing, where in-line probes verify blend uniformity in real time.
High-performance and ultra-high-performance liquid chromatography systems commanded 56% of this category, valued at USD 8.67 billion, as their reproducibility and matrix tolerance make them indispensable for potency, impurity, and stability testing. Artificial-intelligence plug-ins now automate gradient design, mobile-phase selection, and fault prediction, boosting sample throughput by up to 70% while reducing column waste. Microfluidic chip columns are entering proteomic workflows, delivering sub-minute separations that synchronize with fast-scanning mass spectrometers and support data-rich multi-omics studies.
Supercritical-fluid chromatography is projected to advance at 7.3% CAGR through 2030, the quickest cadence within liquid-phase separations. Its use of CO2 and minimal co-solvent meets green-chemistry targets and lowers per-sample solvent cost, creating attractive payback in chiral drug screening and impurity isolation. Gas chromatography remains vital for volatile analyses, yet helium scarcity elevates operating expenses, accelerating migration to hydrogen carriers and micro-channel alternatives. Ion chromatography is back in focus as regulators tighten ionic-contaminant limits in drinking water and industrial effluent, prompting utilities to add automated inline suppressor systems that can handle 24/7 monitoring.
The Analytical Instrumentation Market Report is Segmented by Product Type (Chromatography Instruments, Molecular Spectroscopy, Elemental Spectroscopy, Mass Spectrometry, and More), End-User Industry (Pharmaceuticals and Biopharmaceuticals, Clinical and Diagnostics Laboratories, Environmental Testing Laboratories, Chemical and Petrochemical, and More), and Geography. The Market Forecasts are Provided in Terms of Value (USD).
Geography Analysis
North America generated USD 19.35 billion in 2024, equivalent to 35% of the analytical instrumentation market. Demand is anchored in FDA-driven real-time release testing, EPA-mandated parts-per-trillion PFAS limits, and a USD 52 billion CHIPS Act outlay that funds new fabs, each specifying sub-nanometer metrology. Laboratories adopt hydrogen-ready gas chromatographs and low-dead-volume HPLC pumps to mitigate helium costs and solvent waste, illustrating an appetite for greener workflows.
Asia-Pacific is forecast to deliver a 7.6% CAGR, reflecting pharmaceutical manufacturing scale-ups in China and India, plus advanced logic and memory production in Taiwan and South Korea. Regional governments tighten water-quality and industrial-emission standards, encouraging state-owned labs to tender multi-year procurement contracts for ICP-MS, LC-MS/MS, and handheld Raman. The analytical instrumentation market size allocated to semiconductor QA/QC in Asia-Pacific is projected to outgrow every other vertical as foundries race for gate-all-around transistors and high-bandwidth memory.
Europe maintains a robust, regulation-driven posture. The European Green Deal funds nationwide PFAS monitoring, circular-economy research, and solvent-free chromatography pilots. Pharmaceutical hubs in Germany, Ireland, and Switzerland integrate continuous-manufacturing lines that embed PAT analytics. Meanwhile, South America and the Middle East and Africa record steady but smaller gains as refineries, agro-exporters, and mining firms modernize labs to meet international trade certifications. High TCO remains a hurdle, so distributors increasingly promote lease-to-own and pay-per-sample schemes that lower entry barriers for first-time buyers.
- Agilent Technologies, Inc.
- Thermo Fisher Scientific Inc.
- Shimadzu Corporation
- Danaher Corporation (SCIEX, Leica Microsystems)
- Bruker Corporation
- Waters Corporation
- PerkinElmer Inc.
- Metrohm AG
- Mettler Toledo International Inc.
- Malvern Panalytical Ltd. (Spectris)
- Hitachi High-Tech Corporation
- HORIBA, Ltd.
- JEOL Ltd.
- Anton Paar GmbH
- Bio-Rad Laboratories, Inc.
- ZEISS Group
- Oxford Instruments plc
- Nikon Instruments Inc.
- Rigaku Corporation
- LECO Corporation
- Sartorius AG
- Merck KGaA (MilliporeSigma)
Additional Benefits:
- The market estimate (ME) sheet in Excel format
- 3 months of analyst support
TABLE OF CONTENTS
1 INTRODUCTION
- 1.1 Study Assumptions and Market Definition
- 1.2 Scope of the Study
2 RESEARCH METHODOLOGY
3 EXECUTIVE SUMMARY
4 MARKET LANDSCAPE
- 4.1 Market Overview
- 4.2 Market Drivers
- 4.2.1 Rising Adoption of Hyphenated Techniques for Biologics QA/QC
- 4.2.2 Stringent Global Limits on PFAS and Micro-plastics Boosting Ultra-Trace Spectrometry
- 4.2.3 Shift Toward Real-Time Release Testing (RTRT) in Pharma Production
- 4.2.4 Semiconductor Node Shrinkage < 3 nm Requiring Ultra-Sensitive Surface Analysis
- 4.2.5 Expansion of Renewable Aviation Fuel Programs Driving Feedstock Certification
- 4.2.6 In-Lab Analytics Surge for Battery Gigafactory Quality Assurance
- 4.3 Market Restraints
- 4.3.1 High Total Cost of Ownership of High-Resolution MS in Emerging Markets
- 4.3.2 Shortage of Skilled Analytical Chemists Elevating Outsourcing Costs
- 4.3.3 Helium Supply-Chain Volatility Impacting GC Operations
- 4.3.4 Lengthy Validation Cycles for Novel Analytical Methods in Regulated Sectors
- 4.4 Industry Ecosystem Analysis
- 4.5 Regulatory Outlook
- 4.6 Technological Outlook
- 4.7 Porter's Five Forces Analysis
- 4.7.1 Bargaining Power of Suppliers
- 4.7.2 Bargaining Power of Buyers
- 4.7.3 Threat of New Entrants
- 4.7.4 Threat of Substitutes
- 4.7.5 Degree of Competition
5 MARKET SIZE AND GROWTH FORECASTS (VALUES)
- 5.1 By Product Type
- 5.1.1 Chromatography Instruments
- 5.1.1.1 Gas Chromatography (GC) Systems
- 5.1.1.2 High-/Ultra-High-Performance Liquid Chromatography (HPLC/UHPLC)
- 5.1.1.3 Ion Chromatography (IC) Systems
- 5.1.1.4 Supercritical Fluid Chromatography (SFC) Systems
- 5.1.2 Molecular Spectroscopy
- 5.1.2.1 UV-Visible Spectrometers
- 5.1.2.2 Fourier Transform Infrared (FT-IR) Spectrometers
- 5.1.2.3 Near-Infrared (NIR) Spectrometers
- 5.1.2.4 Raman Spectrometers
- 5.1.2.5 Fluorescence Spectrometers
- 5.1.3 Elemental Spectroscopy
- 5.1.3.1 Atomic Absorption Spectrometers (AAS)
- 5.1.3.2 ICP-Optical Emission Spectrometers (ICP-OES)
- 5.1.3.3 ICP-Mass Spectrometers (ICP-MS)
- 5.1.3.4 X-Ray Fluorescence (XRF) Spectrometers
- 5.1.4 Mass Spectrometry
- 5.1.4.1 Single Quadrupole MS Systems
- 5.1.4.2 Triple Quadrupole MS Systems
- 5.1.4.3 Quadrupole-Time-of-Flight (Q-TOF) MS Systems
- 5.1.4.4 Orbitrap and FT-MS Systems
- 5.1.4.5 MALDI-TOF MS Systems
- 5.1.5 Analytical Microscopes and Imaging Systems
- 5.1.5.1 Scanning Electron Microscopes (SEM)
- 5.1.5.2 Transmission Electron Microscopes (TEM)
- 5.1.5.3 Atomic Force Microscopes (AFM)
- 5.1.5.4 Confocal and Optical Microscopes
- 5.1.6 Surface, Thermal and Particle Characterisation Instruments
- 5.1.6.1 X-Ray Diffraction (XRD) Systems
- 5.1.6.2 Thermal Analysis Instruments (DSC, TGA, etc.)
- 5.1.6.3 Particle Size and Zeta Potential Analysers
- 5.1.7 Consumables and Accessories
- 5.1.8 Data Management Software and Services
- 5.1.1 Chromatography Instruments
- 5.2 By End-User Industry
- 5.2.1 Pharmaceuticals and Biopharmaceuticals
- 5.2.1.1 Drug Discovery and Development
- 5.2.1.2 Manufacturing QA/QC
- 5.2.2 Clinical and Diagnostics Laboratories
- 5.2.3 Environmental Testing Laboratories
- 5.2.4 Food and Beverage Testing
- 5.2.5 Chemical and Petrochemical
- 5.2.6 Oil and Gas (Upstream, Midstream, Downstream)
- 5.2.7 Materials Science and Metallurgy
- 5.2.8 Semiconductor and Electronics
- 5.2.9 Academic and Government Research Institutes
- 5.2.10 Forensic and Security
- 5.2.11 Water and Wastewater Utilities
- 5.2.1 Pharmaceuticals and Biopharmaceuticals
- 5.3 By Geography
- 5.3.1 North America
- 5.3.1.1 United States
- 5.3.1.2 Canada
- 5.3.1.3 Mexico
- 5.3.2 Europe
- 5.3.2.1 Germany
- 5.3.2.2 United Kingdom
- 5.3.2.3 France
- 5.3.2.4 Italy
- 5.3.2.5 Spain
- 5.3.2.6 Nordics
- 5.3.2.7 Rest of Europe
- 5.3.3 Asia-Pacific
- 5.3.3.1 China
- 5.3.3.2 Japan
- 5.3.3.3 South Korea
- 5.3.3.4 India
- 5.3.3.5 South East Asia
- 5.3.3.6 Australia
- 5.3.3.7 Rest of Asia-Pacific
- 5.3.4 South America
- 5.3.4.1 Brazil
- 5.3.4.2 Rest of South America
- 5.3.5 Middle East and Africa
- 5.3.5.1 Middle East
- 5.3.5.1.1 United Arab Emirates
- 5.3.5.1.2 Saudi Arabia
- 5.3.5.1.3 Rest of Middle East
- 5.3.5.2 Africa
- 5.3.5.2.1 South Africa
- 5.3.5.2.2 Rest of Africa
- 5.3.1 North America
6 COMPETITIVE LANDSCAPE
- 6.1 Market Concentration
- 6.2 Strategic Moves (M&A, Partnerships, Funding)
- 6.3 Market Share Analysis
- 6.4 Company Profiles (includes Global level Overview, Market level overview, Core Segments, Financials as available, Strategic Information, Market Rank/Share for key companies, Products and Services, and Recent Developments)
- 6.4.1 Agilent Technologies, Inc.
- 6.4.2 Thermo Fisher Scientific Inc.
- 6.4.3 Shimadzu Corporation
- 6.4.4 Danaher Corporation (SCIEX, Leica Microsystems)
- 6.4.5 Bruker Corporation
- 6.4.6 Waters Corporation
- 6.4.7 PerkinElmer Inc.
- 6.4.8 Metrohm AG
- 6.4.9 Mettler Toledo International Inc.
- 6.4.10 Malvern Panalytical Ltd. (Spectris)
- 6.4.11 Hitachi High-Tech Corporation
- 6.4.12 HORIBA, Ltd.
- 6.4.13 JEOL Ltd.
- 6.4.14 Anton Paar GmbH
- 6.4.15 Bio-Rad Laboratories, Inc.
- 6.4.16 ZEISS Group
- 6.4.17 Oxford Instruments plc
- 6.4.18 Nikon Instruments Inc.
- 6.4.19 Rigaku Corporation
- 6.4.20 LECO Corporation
- 6.4.21 Sartorius AG
- 6.4.22 Merck KGaA (MilliporeSigma)
7 MARKET OPPORTUNITIES AND FUTURE OUTLOOK
- 7.1 White-Space and Unmet-Need Assessment