
|
시장보고서
상품코드
1851588
리튬 이온 배터리 시장 : 점유율 분석, 산업 동향, 통계, 성장 예측(2025-2030년)Lithium-ion Battery - Market Share Analysis, Industry Trends & Statistics, Growth Forecasts (2025 - 2030) |
||||||
세계의 리튬 이온 배터리 시장 규모는 2025년 1,136억 1,000만 달러로 추정되며, 2030년까지 3,042억 2,000만 달러에 이를 것으로 예측되며, 예측 기간 중(2025-2030년) CAGR은 21.77%로 예상됩니다.

2024년 팩 평균 가격은 1kWh당 115달러까지 하락했으며 2017년 이후 가장 급격한 연간 하락을 보였습니다. 아시아태평양의 55% 시장 점유율은 중국이 셀 생산과 음극재를 장악하고 있음을 반영하며, 북미와 유럽은 공급 리스크를 헤지하기 위해 현지화를 가속화하고 있습니다. 제품 혁신은 에너지 밀도 향상을 축으로 하고, 실리콘 리치 음극은 상업적 실용화를 향해 움직이고 있습니다. 전력회사는 재생가능에너지에 의한 발전을 안정화시키기 위해 여러 시간 저장을 채용하고, 자동차 제조업체는 엔트리 레벨의 EV를 비용을 중시해 LFP 화학으로 전환시키고 있습니다. 이러한 요인들이 결합되어 장기적인 수요를 지원하는 수량 증가와 비용 저하의 선순환이 강화되고 있습니다.
세계 리튬 이온 배터리 시장 동향과 통찰
장거리 EV 플랫폼에서 고 에너지 밀도 배터리 수요 급증
제조업체는 300Wh kg-1을 넘어, 팩을 대형화하지 않고 400마일의 항속 거리를 약속하는 셀을 목표로 하고 있습니다. 실리콘을 주성분으로 하는 음극은 흑연에 비해 비에너지를 최대 40% 향상시킵니다. 이 움직임은 구조적인 무게를 줄이고 제조 비용을 낮추는 셀 투 팩 아키텍처의 채택과 시간을 동일하게 합니다. 기존의 화학물질과 가격이 동등하게 되는 것은 2029년 이전으로 예상되고 있으며, 이는 이전 예상보다 3년 빠릅니다. 자동차 제조업체는 항속거리에 대한 불안이 주요 장애물이 되고 있는 북미와 유럽 시장에서 EV를 주류로 받아들이기 위해서는 이러한 진보가 필수적이라고 생각하고 있습니다. 그 결과, 조달 계약에서는 에너지 밀도의 목표치를 규정하는 것이 늘어나고, 리튬 이온 배터리 시장에 새로운 프리미엄 틈새를 창출하고 있습니다.
중국의 산업정책('Made in China 2025')이 국내 리튬 이온 기가팩토리 건설을 가속화
중국은 2024년에 세계 축전지의 93.5%를 출하했는데, 이는 셀 제조와 업스트림 재료에 있어서 비교할 수 없는 규모를 반영하고 있습니다. 원료의 정제부터 모듈의 조립에 이르기까지 수직적인 통합이 이루어지기 때문에 유사한 원재료를 투입하고 있음에도 불구하고 생산비용은 유럽의 동업자를 약 20% 밑돌고 있습니다. 챔피언 공급업체인 CATL은 이 비용 우위를 활용하여 인도네시아에서 사업을 확대하여 니켈 공급을 확보하고, 몇 GWh의 플랜트가 유럽의 OEM에 공급되는 헝가리에서도 사업을 확대하고 있습니다. 정책 주도의 급성장은 중국공급업체 우위를 확고하게 하고 라이벌 지역은 전략적 자율성을 유지하기 때문에 현지 프로젝트에 보조금을 내야 합니다. 이 구조적 이점은 리튬 이온 배터리 시장에서 중국 기업의 매우 중요한 역할을 지원합니다.
중국의 환경 규제에 의한 흑연 양극 공급 박박
중국은 세계 양극재의 약 90%를 공급하고 있습니다. 헤이룽장과 몽골에서는 2024년 환경검사로 일시적으로 생산량이 15% 삭감되었습니다. 미국과 유럽의 다운스트림 셀 공장에서는 리드 타임의 연장과 스팟 가격의 상승이 보고되어 지리적 집중 위험이 노출되었습니다. 한국과 미국의 인조흑연 프로젝트는 공급의 다양화를 목표로 하고 있지만, 상업 생산량은 수년간은 수요에 뒤처질 것으로 보입니다. 부족 위험으로 인해 일부 자동차 제조업체들은 실리콘 리치 애노드 평가를 예정보다 빨리 수행하고 리튬 이온 배터리 시장 전체의 재료 로드맵을 재구성합니다.
부문 분석
2024년 리튬 이온 배터리 시장 점유율은 NMC가 45%를 차지하며 프리미엄 EV에 적합한 높은 에너지 밀도로 지지되고 있습니다. LFP의 리튬 이온 배터리 시장 규모는 2030년까지 연평균 복합 성장률(CAGR) 23.4%를 보일 것으로 예측되며 비용 중시 모델이 보급됨에 따라 NMC의 리드를 침식합니다. 캐소드 코팅의 개선과 셀 공차의 엄격화로 LFP의 에너지 밀도는 한때 니켈이 풍부한 화학물질에만 허용된 범위로 끌어올려 팩의 총 비용이 저하되고 코발트 가격의 변동이 완화됩니다.
수요의 궤도는 용도에 따라 다릅니다. NMC는 최대의 항속거리를 필요로 하는 고성능 EV와 항공우주 프로젝트로 발판을 굳히고 있는 반면 LCO는 주력가전제품에서 관련성을 유지하고 있습니다. LTO와 LMFP는 극단적인 사이클 수명과 온도 내성이 최우선적인 틈새 이용 사례에 대응하고 있습니다. LFP에 망간을 첨가하는 크로스 케미스트리 하이브리드화는 리튬 이온 배터리 산업의 특정 성능 범위를 수용하기 위해 공급업체가 전기 화학을 사용자 정의하는 방법을 돋보이게합니다.
2024년 리튬 이온 배터리 시장에서는 고도로 자동화된 조립 라인을 활용하는 기존 자동차 제조업체를 중심으로 원통형 셀이 50%를 차지했습니다. 그러나, 파우치형 셀은 박형으로 인해 한정된 공간에서도 높은 충전 효율을 얻을 수 있기 때문에 2030년까지 연평균 복합 성장률(CAGR) 22.5%로 확대될 것으로 보입니다. 비교 테스트에 따르면, 파우치 유형은 스케이트보드 섀시에 통합될 때 팩 레벨에서 6-8% 높은 중량 에너지를 발휘합니다.
출하량의 약 40%를 차지하는 프리즘형 셀은 기계적 견고성과 체적 효율의 균형을 이루며 중국 버스 및 트럭 플랫폼에서 인기가 있습니다. 따라서 폼 팩터는 OEM 설계 사상에 의해 구분됩니다. Tesla의 4,680 원통형 셀의 로드맵은 규모와 에너지 밀도를 선호하며, BYD의 블레이드형 각기둥은 안전과 비용을 중시합니다. 이 공존은 다양화하는 리튬 이온 배터리 시장에서 차별화된 전략이 얼마나 번창하는지를 보여줍니다.
리튬 이온 배터리 시장 보고서는 제품 유형(산화 코발트 리튬, 인산철 리튬, 니켈 망간 코발트 리튬 등), 폼 팩터(원통형, 각주형, 파우치), 전력 용량(0-3,000 MAh, 3,001-10,000 MAh, 기타), 최종 이용 산업(자동차, 가전, 기타), 지역(북미, 유럽, 아시아태평양, 남미, 중동 및 아프리카)으로 구분됩니다.
지역 분석
아시아태평양은 2024년 리튬 이온 배터리 시장의 55%를 차지했고, 2030년까지 CAGR은 31%로 예측되고 있습니다. 중국만으로 세계의 셀 생산량의 약 70%, 양극 재료의 90%를 차지하고 있어 스케일 메리트와 통합된 공급 체인을 활용하고 있습니다. 일본과 한국은 계속해서 고성능 화학물질에 주력해, 인도는 2030년까지 연간 104GWh의 생산 능력을 목표로 하는 생산 연동형 인센티브 프로그램 아래, 국내의 기가 팩토리 건설을 가속시키고 있습니다.
북미는 인플레이션 억제법의 혜택을 받아 셀 네임플레이트 용량은 2030년까지 연간 1,300GWh에 이르고 1,000만대의 EV에 충분히 대응할 수 있을 것으로 예측됩니다. 새로운 공장은 배터리 등급의 니켈, 수산화 리튬 및 재활용 시설이 동거하는 중서부에서 남동부까지의 회랑을 따라 집적되어 있습니다. 전구체 양극재료의 스케일 업에는 과제가 남아 있고, 프로세스의 노하우를 이전하기 위해 아시아 파트너와의 합작 사업이 진행되고 있습니다.
유럽은 폴란드의 115GWh 규모 LG Energy Solution와 헝가리의 새로운 프로젝트에 견인되어 2030년까지 세계 셀 생산량의 30%를 목표로 하고 있습니다. 엄격한 탄소 실적 규제가 제조업체를 재생 가능 전력과 견고한 재활용 방식으로 향하게 합니다. 한편, 남미에서는 아르헨티나의 Sal de Vida사가 연간 15kt의 배터리 등급 탄산염 생산을 목표로 하고 있습니다. 중동 및 아프리카에서는 우간다의 리튬 이온 팩 공장으로 대표되는 바와 같이 중요한 광물 자원과의 파트너십을 활용하여 지역의 태양열 + 스토리지 수요에 대응하고 있습니다.
기타 혜택:
- 엑셀 형식 시장 예측(ME) 시트
- 3개월간의 애널리스트 서포트
목차
제1장 서론
- 조사의 전제조건과 시장의 정의
- 조사 범위
제2장 조사 방법
제3장 주요 요약
제4장 시장 상황
- 시장 개요
- 시장 성장 촉진요인
- 장거리 EV 플랫폼에서의 고에너지 밀도 전지 수요 급증
- 중국의 산업 정책(「Made in China 2025」)에 의해 국내의 리튬 이온 기가 팩토리 건설이 가속
- 미국에서 유틸리티 규모의 축전지 조달이 급속한 전개
- 북유럽 국가의 VRLA에서 리튬 이온으로 거치형 데이터센터 백업 이행
- 해사 IMO의 GHG 목표가 유럽에서 마링레이드 리튬 이온 채용을 촉진
- 인도에서 비용중시의 엔트리 EV용 OEM의 LFP 화학으로 전환
- 시장 성장 억제요인
- 중국의 환경 규제에 의한 흑연 부극공급 박박
- 우크라이나 분쟁 후 고전압 전해질 첨가제 비용 인플레이션
- 미국과 EU의 중요한 광물에 관한 무역 장벽이 대서양 횡단 공급망을 약화
- 오세아니아에서 재활용 인프라 지연이 순환형 머티리얼 플로우를 저해
- 공급망 분석
- 최근 동향
- 규제 전망
- 기술 전망
- 가격 동향 분석
- Porter's Five Forces
- 공급기업의 협상력
- 구매자의 협상력
- 신규 참가업체의 위협
- 대체품의 위협
- 경쟁 기업간 경쟁 관계
제5장 시장 규모와 성장 예측
- 제품 유형별
- 코발트산리튬(LCO)
- 인산철 리튬(LFP)
- 리튬 니켈 망간 코발트(NMC)
- 리튬 니켈 코발트 알루미늄(NCA)
- 망간산 리튬(LMO)
- 티타네이트리튬(LTO)
- 폼 팩터별
- 원통형
- 프리즘
- 파우치
- 전력 용량별
- 0-3,000 mAh
- 3,001-10,000 mAh
- 10,001-60,000 mAh
- 60,000mAh 이상
- 최종 이용 산업별
- 자동차(EV, HEV, PHEV)
- 컨슈머 일렉트로닉스
- 산업용 및 전동 공구
- 거치형 에너지 저장
- 항공우주 및 방위
- 선박
- 지역별
- 북미
- 미국
- 캐나다
- 멕시코
- 유럽
- 영국
- 독일
- 프랑스
- 스페인
- 북유럽 국가
- 러시아
- 기타 유럽
- 아시아태평양
- 중국
- 인도
- 일본
- 한국
- 말레이시아
- 태국
- 인도네시아
- 베트남
- 호주
- 기타 아시아태평양
- 남미
- 브라질
- 아르헨티나
- 콜롬비아
- 기타 남미
- 중동 및 아프리카
- 아랍에미리트(UAE)
- 사우디아라비아
- 남아프리카
- 이집트
- 기타 중동 및 아프리카
- 북미
제6장 경쟁 구도
- 시장 집중도
- 전략적 움직임(M&A, 제휴, PPA)
- 시장 점유율 분석(주요 기업의 시장 순위/점유율)
- 기업 프로파일
- Contemporary Amperex Technology Co., Ltd.(CATL)
- BYD Company Limited
- LG Energy Solution Ltd.
- Panasonic Holdings Corp.
- Samsung SDI Co., Ltd.
- SK On Co., Ltd.
- AESC(Envision AESC Group)
- CALB Co., Ltd.
- Gotion High-Tech Co., Ltd.
- EVE Energy Co., Ltd.
- Farasis Energy Inc.
- Sunwoda Electronic Co., Ltd.
- Murata Manufacturing Co., Ltd.
- VARTA AG
- Toshiba Corporation
- Saft Groupe SAS
- Northvolt AB
- Microvast Holdings, Inc.
- A123 Systems LLC
- Hitachi Energy Ltd.
- Lithium Werks BV
- Tesla Inc.(Battery Division)
제7장 시장 기회와 장래의 전망
JHS 25.11.25The Lithium-ion Battery Market size is estimated at USD 113.61 billion in 2025, and is expected to reach USD 304.22 billion by 2030, at a CAGR of 21.77% during the forecast period (2025-2030).
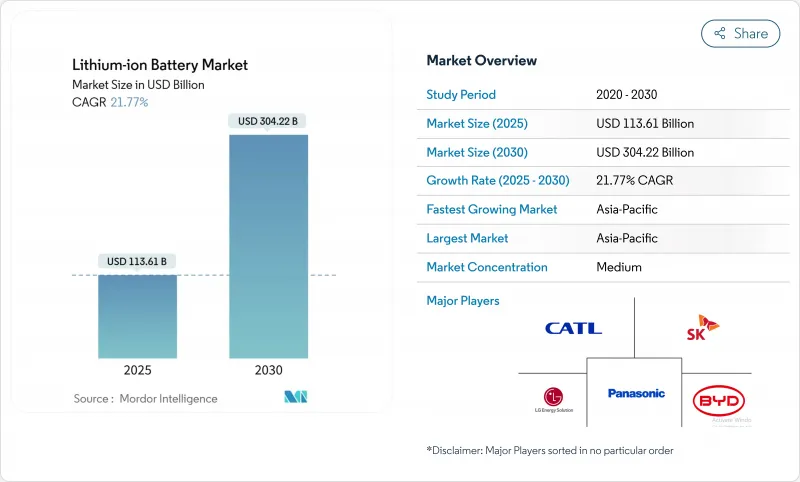
Momentum comes from steep cost deflation-average pack prices fell to USD 115 per kWh in 2024, their sharpest annual drop since 2017-and from policy mandates that require large-scale electrification across transport and power systems. A 55% market share in Asia-Pacific reflects China's command of cell production and anode materials, while North America and Europe accelerate localisation to hedge supply risk. Product innovation pivots around energy density gains, with silicon-rich anodes moving toward commercial viability. Utilities are adopting multi-hour storage to stabilise renewable generation, and automakers shift entry-level EVs toward cost-oriented LFP chemistry. Together these factors reinforce a virtuous cycle of rising volumes and falling cost that underpins long-term demand.
Global Lithium-ion Battery Market Trends and Insights
Surging Demand for High-Energy-Density Batteries in Long-Range EV Platforms
Manufacturers are pushing beyond 300 Wh kg-1 toward cells that promise 400-mile driving range without enlarging packs. Silicon-dominant anodes raise specific energy by up to 40% relative to graphite. The move coincides with adoption of cell-to-pack architectures that reduce structural weight and lower production cost. Price parity with incumbent chemistries is now expected before 2029, three years sooner than earlier estimates. Automakers view these advances as critical to mainstream EV acceptance in North America and Europe, markets where range anxiety remains a primary hurdle. As a result, procurement contracts increasingly stipulate energy density targets, creating new premium niches in the lithium-ion battery market.
China's Industrial Policy ("Made in China 2025") Accelerating Domestic Li-ion Gigafactory Build-out
China shipped 93.5% of global energy-storage batteries in 2024, reflecting unrivalled scale in cell manufacturing and upstream materials. Vertical integration spans raw-material refining through module assembly, enabling production costs roughly 20% below European peers despite similar commodity inputs. Champion supplier CATL leverages this cost edge to expand in Indonesia, securing nickel supply, and in Hungary, where a multi-GWh plant will serve European OEMs. The policy-driven surge cements China's supplier dominance and forces rival regions to subsidise local projects to preserve strategic autonomy. This structural advantage sustains a pivotal role for Chinese firms in the lithium-ion battery market.
Graphite Anode Supply Tightness Owing to Chinese Environmental Curtailments
China supplies about 90% of global anode material. Temporary shutdowns in Heilongjiang and Inner Mongolia cut output 15% during 2024 environmental inspections. Downstream cell plants in the United States and Europe reported lead-time extensions and spot-price increases, exposing geographic concentration risk. Synthetic graphite projects in South Korea and the United States aim to diversify supply; however, commercial volumes will lag demand for several years. Shortage risk prompts some automakers to evaluate silicon-rich anodes faster than planned, reshaping material roadmaps across the lithium-ion battery market.
Other drivers and restraints analyzed in the detailed report include:
- Rapid Roll-out of Utility-Scale Battery Energy Storage Procurements in the United States
- Stationary Data-Centre Back-up Migration from VRLA to Lithium-ion in Nordic Countries
- High-Voltage Electrolyte Additive Cost Inflation Post-Ukraine Conflict
For complete list of drivers and restraints, kindly check the Table Of Contents.
Segment Analysis
NMC accounted for 45% of lithium-ion battery market share in 2024, supported by its high energy density that suits premium EVs. The lithium-ion battery market size for LFP is forecast to rise at 23.4% CAGR through 2030, eroding NMC's lead as cost-sensitive models proliferate. Improved cathode coatings and tighter cell tolerances lift LFP energy density into ranges once reserved for nickel-rich chemistries, lowering total pack cost and mitigating cobalt-price volatility.
Demand trajectories are diverging by application. NMC retains a foothold in performance EVs and aerospace projects requiring maximal range, whereas LCO maintains relevance in flagship consumer electronics. LTO and LMFP serve niche use cases where extreme cycle life or temperature tolerance is paramount. Cross-chemistry hybridisation-such as adding manganese to LFP-highlights how suppliers customise electro-chemistry to address specific performance envelopes inside the lithium-ion battery industry.
Cylindrical cells held 50% of the lithium-ion battery market in 2024, anchored by automotive incumbents exploiting highly automated assembly lines. Pouch cells, however, expand 22.5% CAGR by 2030 as their thin profile enables higher packing efficiency in constrained spaces. Comparative testing shows pouch formats deliver 6-8% higher gravimetric energy at pack level when integrated into skateboard chassis.
Prismatic cells, representing around 40% of shipments, strike a balance between mechanical robustness and volumetric efficiency, making them popular among Chinese bus and truck platforms. The form-factor landscape thus segments by OEM design philosophy: Tesla's 4680 cylindrical cell roadmap prioritises scale and energy density, while BYD's blade-style prismatics champion safety and cost. This coexistence demonstrates how differentiated strategies thrive within the diversified lithium-ion battery market.
The Lithium-Ion Battery Market Report is Segmented by Product Type (Lithium Cobalt Oxide, Lithium Iron Phosphate, Lithium Nickel Manganese Cobalt, and Others), Form Factor (Cylindrical, Prismatic, and Pouch), Power Capacity (0 To 3, 000 MAh, 3, 001 To 10, 000 MAh, and Others), End-Use Industry (Automotive, Consumer Electronics, and Others), and Geography (North America. Europe, Asia-Pacific, South America, and Middle East and Africa).
Geography Analysis
Asia-Pacific commanded 55% of the lithium-ion battery market in 2024 and is forecast to post a 31% CAGR to 2030. China alone accounts for roughly 70% of global cell output and 90% of anode materials, leveraging economies of scale and integrated supply chains. Japan and South Korea continue to focus on high-performance chemistries, while India accelerates domestic gigafactory builds under its Production-Linked Incentive programme targeting 104 GWh annual capacity by 2030.
North America benefits from the Inflation Reduction Act, with cell nameplate capacity projected to reach 1,300 GWh yr-1 by 2030, sufficient for 10 million EVs. New plants cluster along the Midwest-to-Southeast corridor where battery-grade nickel, lithium-hydroxide and recycling facilities co-locate. Challenges remain in scaling precursor cathode materials, prompting joint ventures with Asian partners to transfer process know-how.
Europe seeks 30% of global cell production by 2030, led by Poland's 115 GWh LG Energy Solution complex and new projects in Hungary. Strict carbon-footprint regulations push manufacturers toward renewable electricity and robust recycling schemes. Meanwhile, South America monetises lithium brine resources, with Argentina's Sal de Vida targeting 15 kt yr-1 of battery-grade carbonate. The Middle East & Africa leverages critical mineral partnerships, exemplified by a Ugandan lithium-ion pack plant serving regional solar-plus-storage demand.
- Contemporary Amperex Technology Co., Ltd. (CATL)
- BYD Company Limited
- LG Energy Solution Ltd.
- Panasonic Holdings Corp.
- Samsung SDI Co., Ltd.
- SK On Co., Ltd.
- AESC (Envision AESC Group)
- CALB Co., Ltd.
- Gotion High-Tech Co., Ltd.
- EVE Energy Co., Ltd.
- Farasis Energy Inc.
- Sunwoda Electronic Co., Ltd.
- Murata Manufacturing Co., Ltd.
- VARTA AG
- Toshiba Corporation
- Saft Groupe SAS
- Northvolt AB
- Microvast Holdings, Inc.
- A123 Systems LLC
- Hitachi Energy Ltd.
- Lithium Werks BV
- Tesla Inc. (Battery Division)
Additional Benefits:
- The market estimate (ME) sheet in Excel format
- 3 months of analyst support
TABLE OF CONTENTS
1 Introduction
- 1.1 Study Assumptions & Market Definition
- 1.2 Scope of the Study
2 Research Methodology
3 Executive Summary
4 Market Landscape
- 4.1 Market Overview
- 4.2 Market Drivers
- 4.2.1 Surging Demand for High-Energy-Density Batteries in Long-Range EV Platforms
- 4.2.2 China's Industrial Policy ("Made in China 2025") Accelerating Domestic Li-ion Gigafactory Build-out
- 4.2.3 Rapid Roll-out of Utility-Scale Battery Energy Storage Procurements in the United States
- 4.2.4 Stationary Data-centre Back-up Migration from VRLA to Lithium-ion in Nordic Countries
- 4.2.5 Maritime IMO GHG targets Driving Marine-Grade Li-ion Adoption in Europe
- 4.2.6 OEM Shift to LFP Chemistry for Cost-Sensitive Entry-Level EVs in India
- 4.3 Market Restraints
- 4.3.1 Graphite Anode Supply Tightness Owing to Chinese Environmental Curtailments
- 4.3.2 High-Voltage Electrolyte Additive Cost Inflation Post-Ukraine Conflict
- 4.3.3 US-EU Trade Barriers on Critical Minerals Undermining Trans-Atlantic Supply Chains
- 4.3.4 Recycling Infrastructure Lag Delaying Circular Material Flows in Oceania
- 4.4 Supply-Chain Analysis
- 4.5 Recent Trends & Developments
- 4.6 Regulatory Outlook
- 4.7 Technology Outlook
- 4.8 Price Trend Analysis
- 4.9 Porter's Five Forces
- 4.9.1 Bargaining Power of Suppliers
- 4.9.2 Bargaining Power of Buyers
- 4.9.3 Threat of New Entrants
- 4.9.4 Threat of Substitutes
- 4.9.5 Intensity of Competitive Rivalry
5 Market Size & Growth Forecasts
- 5.1 By Product Type
- 5.1.1 Lithium Cobalt Oxide (LCO)
- 5.1.2 Lithium Iron Phosphate (LFP)
- 5.1.3 Lithium Nickel Manganese Cobalt (NMC)
- 5.1.4 Lithium Nickel Cobalt Aluminium (NCA)
- 5.1.5 Lithium Manganese Oxide (LMO)
- 5.1.6 Lithium Titanate (LTO)
- 5.2 By Form Factor
- 5.2.1 Cylindrical
- 5.2.2 Prismatic
- 5.2.3 Pouch
- 5.3 By Power Capacity
- 5.3.1 0 to 3,000 mAh
- 5.3.2 3,001 to 10,000 mAh
- 5.3.3 10,001 to 60,000 mAh
- 5.3.4 Above 60,000 mAh
- 5.4 By End-use Industry
- 5.4.1 Automotive (EV, HEV, PHEV)
- 5.4.2 Consumer Electronics
- 5.4.3 Industrial and Power Tools
- 5.4.4 Stationary Energy Storage
- 5.4.5 Aerospace and Defense
- 5.4.6 Marine
- 5.5 By Geography
- 5.5.1 North America
- 5.5.1.1 United States
- 5.5.1.2 Canada
- 5.5.1.3 Mexico
- 5.5.2 Europe
- 5.5.2.1 United Kingdom
- 5.5.2.2 Germany
- 5.5.2.3 France
- 5.5.2.4 Spain
- 5.5.2.5 Nordic Countries
- 5.5.2.6 Russia
- 5.5.2.7 Rest of Europe
- 5.5.3 Asia-Pacific
- 5.5.3.1 China
- 5.5.3.2 India
- 5.5.3.3 Japan
- 5.5.3.4 South Korea
- 5.5.3.5 Malaysia
- 5.5.3.6 Thailand
- 5.5.3.7 Indonesia
- 5.5.3.8 Vietnam
- 5.5.3.9 Australia
- 5.5.3.10 Rest of Asia-Pacific
- 5.5.4 South America
- 5.5.4.1 Brazil
- 5.5.4.2 Argentina
- 5.5.4.3 Colombia
- 5.5.4.4 Rest of South America
- 5.5.5 Middle East and Africa
- 5.5.5.1 United Arab Emirates
- 5.5.5.2 Saudi Arabia
- 5.5.5.3 South Africa
- 5.5.5.4 Egypt
- 5.5.5.5 Rest of Middle East and Africa
- 5.5.1 North America
6 Competitive Landscape
- 6.1 Market Concentration
- 6.2 Strategic Moves (M&A, Partnerships, PPAs)
- 6.3 Market Share Analysis (Market Rank/Share for key companies)
- 6.4 Company Profiles (includes Global level Overview, Market level overview, Core Segments, Financials as available, Strategic Information, Products & Services, and Recent Developments)
- 6.4.1 Contemporary Amperex Technology Co., Ltd. (CATL)
- 6.4.2 BYD Company Limited
- 6.4.3 LG Energy Solution Ltd.
- 6.4.4 Panasonic Holdings Corp.
- 6.4.5 Samsung SDI Co., Ltd.
- 6.4.6 SK On Co., Ltd.
- 6.4.7 AESC (Envision AESC Group)
- 6.4.8 CALB Co., Ltd.
- 6.4.9 Gotion High-Tech Co., Ltd.
- 6.4.10 EVE Energy Co., Ltd.
- 6.4.11 Farasis Energy Inc.
- 6.4.12 Sunwoda Electronic Co., Ltd.
- 6.4.13 Murata Manufacturing Co., Ltd.
- 6.4.14 VARTA AG
- 6.4.15 Toshiba Corporation
- 6.4.16 Saft Groupe SAS
- 6.4.17 Northvolt AB
- 6.4.18 Microvast Holdings, Inc.
- 6.4.19 A123 Systems LLC
- 6.4.20 Hitachi Energy Ltd.
- 6.4.21 Lithium Werks BV
- 6.4.22 Tesla Inc. (Battery Division)
7 Market Opportunities & Future Outlook
- 7.1 White-space & Unmet-Need Assessment
