


|
시장보고서
상품코드
1851934
차세대 시퀀싱(NGS) 시장 : 시장 점유율 분석, 업계 동향, 통계, 성장 예측(2025-2030년)Next-generation Sequencing (NGS) - Market Share Analysis, Industry Trends & Statistics, Growth Forecasts (2025 - 2030) |
||||||
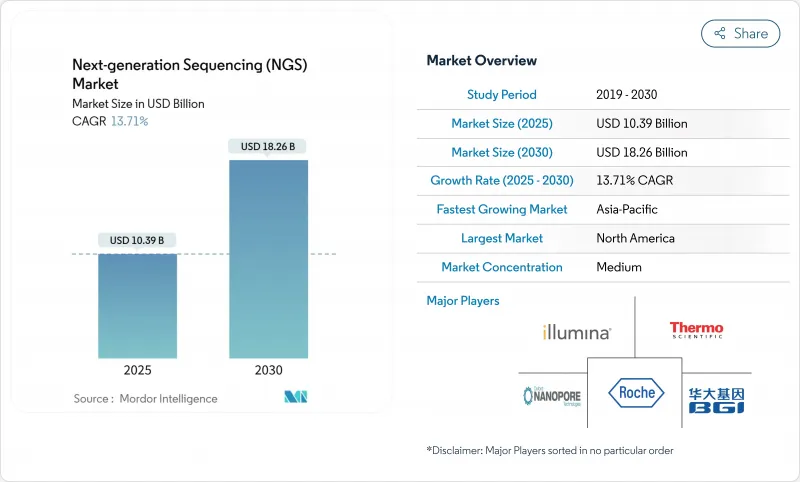
차세대 시퀀싱 시장 규모는 2025년에 약 103억 9,000만 달러로 추정되고, 2025-2030년 13.7%의 연평균 복합 성장률(CAGR)로 성장할 전망이며, 2030년까지 거의 182억 6,000만 달러에 달할 것으로 예측되고 있습니다.
이 확장은 시퀀싱 비용이 유전체당 100달러에 가까워지고 의료 시스템 도입을 위한 저렴한 장벽이 낮아짐에 따라 기술 중심 단계에서 광범위한 임상 개발로의 전환을 보여줍니다. 시약 및 소모품이 주요 수익원인 것은 아니지만, 엘리먼트 바이오사이언시스, 울티마 제노믹스 및 기타 과제의 진입으로 플랫폼 선택이 확대되고 가격 경쟁이 격화되고 있습니다. 종양가 계속해서 우선되지만, 집단 규모의 유전체 해석, 약리 유전체 해석, 희귀질환 진단이 수요를 확대하고 있습니다. FDA의 임상검사(LDT) 규칙이 가까워지면서 품질 기준의 명확화가 기대되는 한편, 중소 검사실이 관리해야 하는 컴플라이언스 업무의 부담도 증대합니다.
세계의 차세대 시퀀싱(NGS) 시장 동향 및 인사이트
종양 및 희귀질환의 치료 패스웨이에서 Precision Medicin 및 Companion 진단제의 도입 가속
암 영역은 2023년 임상 시퀀싱량이 조사 사용을 웃도는 마일스톤을 넘어 유전체 데이터가 약제 선택의 지침이 되어 회피 가능한 치료를 줄일 수 있다는 병원의 확신을 확인했습니다. 미국의 NGS 종양 분야만으로도 2023년에 30억 달러에 이르렀고, 2025년에는 40억 달러에 이르는 기세이며, 보다 광범위한 패널 검사에 대한 의료 시스템의 의욕을 보여주고 있습니다. TruSight Oncology Comprehensive와 같은 종합적인 분석이 FDA에 승인됨에 따라 지불자 수락이 확대되고 단일 유전자 패널에서 다중 유전자 패널로 실험실 전환이 가속화되었습니다. 포인트 오브 케어에서 파마 코게노믹 경보를 제공하는 EHR 통합 파일럿과 함께, 임상의는 시퀀싱을 드문 검사가 아닌 일상 검사로 간주하게 되었습니다. 차세대 시퀀싱 시장은 치료 지침이 유전체의 시그니처를 참조하게 되어 반복 처리량이 향상되었습니다.
보다 높은 처리량의 화학 및 혁신적인 장비 기술에 견인된 유전체당 비용 지속적인 감소
케미스트리의 소형화, 광학 시스템의 업그레이드, 베이스 콜 알고리즘에 의해 인간 유전체당의 비용은 일루미나의 NovaSeq X 시스템에서는 200달러 미만, 신흥의 경쟁사에서는 100달러를 향하고 있습니다. 종양학 및 신생아학 공급자는 가격이 더 이상 진단을 절약하는 것을 압도하지 않기 때문에 다중 단계 레거시 분석보다 시퀀싱을 정당화할 수 있습니다. 소모품 비용의 감소는 학술 핵심 시설에 의한 장비 함대 확장을 촉진하고 차세대 시퀀싱 시장을 지원하는 시약 수요 증가를 촉진하고 있습니다. 플로우셀 재사용성과 키트 다중화의 지속적인 발전으로 2년 이내에 샘플당 비용이 20-30% 더 줄어들어 자본 설비의 투자 회수 기간이 단축될 것으로 예측됩니다.
임상 NGS 검증에 대한 세계 규제 상황의 단편화
대부분의 LDT를 의료기기로 분류하는 FDA의 최종 규칙은 2028년까지 단계적 컴플라이언스가 도입될 전망이며, 임상 실험실은 시판 전 심사를 받거나 FDA가 허가한 키트로 전환해야 합니다. 이 방침은 품질의 조화를 목표로 하는 것이지만, 임상 검사 협회로부터의 법적 과제에 의해 스케줄은 불투명한 것이 되고 있습니다. 임상실은 타당성 확인시험 및 잠재적인 시스템 업그레이드를 위한 예산을 짜야 하며, 일시적으로 자본 주문이 지연됩니다. 미국 이외에서는 중국의 NMPA, EU의 IVDR, 일본의 PMDA간에 요구사항이 다르기 때문에 벤더는 문서의 현지화를 강요하고 차세대 시퀀싱 시장에서 비용이 들고 제품 출시가 장기화합니다.
부문 분석
타겟 리시퀀싱의 2024년 매출은 38.1%로, 48시간 이내에 완료되는 실용적인 암 및 생식세포 계열 패널의 주력으로서의 역할이 강화되었습니다. 그 초점의 좁은 범위는 데이터 분석의 부담을 경감해, 상환 코드와 정합하고 있기 때문에 차세대 시퀀싱 시장에 있어서 대부분의 병원 랩이 참가하는 포인트가 되고 있습니다. 전체 엑솜 시퀀싱은 비용이 낮아짐에 따라 증가하고 있으며, 2030년까지 연평균 복합 성장률(CAGR)은 14.2%로 성장을 지속할 전망이며, 희귀질환의 진단 수율 45%의 제1선택 검사로서의 역할을 합니다. RNA 시퀀싱은 융합 검출이 표적 치료에 대한 지침이 되는 혈액 악성 종양에서 계속 성장합니다. 한편, 전체 유전체 시퀀싱의 채용은 아직 겸손하지만, 집단 프로젝트에서 전체 커버리지의 데이터가 요구되고 있기 때문에 증가 경향이 있습니다. AI 주도의 어노테이션이 가속되는 가운데, WGS의 차세대 시퀀싱 시장 규모는 2028년 이후 시장 전체를 상회할 것으로 예측됩니다.
엑솜 또는 유전체 처리량에 최적화된 장치는 현재 온박스의 2차 분석을 통합하여 별도의 서버 필요성을 줄이고 엔드 투 엔드 턴어라운드를 보다 예측하기 쉽게 합니다. 엑솜에서 유전체 워크플로우로 전환한 실험실에서는 기존의 추출 키트와 라이브러리 키트를 유지하는 경우가 많아 마이그레이션 비용이 완화됩니다. 공급업체는 여러 실행 모드에서 플로우 셀 카트리지를 재사용하는 업그레이드 경로를 제공함으로써 카니버리제이션 위험에 대응하고 있습니다. 그 결과 차세대 시퀀싱 시장은 런 포맷이 다양화 되더라도 소모품 수요가 안정되어 있기 때문에 이익을 얻고 있습니다.
시약 및 소모품은 2024년 차세대 시퀀싱 시장 점유율의 69.9%를 차지하며 벤더의 수익성을 지원하는 면도기와 칼날 같은 모델을 부각하고 있습니다. 시약 및 소모품의 이점은 가동률 90%를 초과하는 임상 실험실에서 플로우셀, 효소 및 캡처 프로브의 월간 보충 사이클을 반영합니다. 이 장치는 더 작은 기반이지만 일루미나의 단일 흐름 셀 NovaSeq X 업그레이드와 같은 혁신은 바닥 면적을 줄이면서 처리량을 확대합니다. 시약을 여러년 계약에 번들하고 자본 예산을 완화하는 임대 모델을 통해 장비 매출은 2030년까지 14.4%의 연평균 복합 성장률(CAGR)을 기록합니다.
아카데믹한 핵심 시설부터 상업용 레퍼런스 랩에 이르기까지 서비스 제공업체는 복잡한 바이오인포매틱스 작업 부하를 계속 흡수하고 있습니다. 특히 모자이크 변형 및 구조 재배열에 대한 데이터 분석에 대한 수요가 분석의 아웃소싱을 2자리 증가로 견인하고 있습니다. 인공지능이 1차 기반 통화를 자동화함에 따라 벤더는 3차 분석과 임상 보고를 통해 서비스 차별화를 도모하고 있습니다. 이 개척은 차세대 시퀀싱 시장 전체에서 시약 가격이 하락하는 가운데 경상 수익층을 늘리고 마진 확보에 기여하고 있습니다.
지역 분석
북미는 고도의 임상상환 및 시퀀서 신흥기업에 대한 벤처자금을 배경으로 2024년 매출액에 41.9% 기여했습니다. 미국 시장의 확대는 대규모 체세포 패널로 환불을 하는 CMS의 보험 적용 결정에 의해 강화되는 한편, 단계적인 LDT 규칙에 의해 품질이 표준화되고 지불자의 신뢰가 서서히 높아질 것으로 예측됩니다. 주요 학술 의료 센터는 집단 건강 유전체 분석을 위해 NIH 보조금을 활용하고 차세대 시퀀싱 시장에서 장비 업그레이드와 소모품의 안정적인 흐름을 보장합니다.
아시아태평양은 중국의 National Genomics Data Center와 BGI 등 국내 혁신가가 견인하여 2030년까지 연평균 복합 성장률(CAGR) 14.2%로 가장 빠르게 성장할 전망입니다. 현지의 제조 장려책 및 대규모 종양 발생률이 수입 가격을 밑도는 국산 시퀀서에게 유리한 경제성을 창출하고 있습니다. 일본과 한국은 시퀀서를 국가의 암 검진 프로그램에 통합하고 있으며, 인도는 신생아 스크리닝 프로젝트를 시험적으로 실시하여 시약 소비를 확대하고 있습니다. 수입 허가를 간소화하는 지역 규제 개혁은 기술 이전과 플랫폼의 보급을 더욱 가속화합니다.
유럽은 Horizon Europe의 자금 지원과 조정된 희귀질환 네트워크에 의해 지원되고 큰 점유율을 유지하고 있습니다. 그럼에도 불구하고 GDPR(EU 개인정보보호규정)에 의한 데이터 현지화 제약이 운영 비용을 밀어 올리기 때문에 실험실은 국경을 넘어선 규칙을 준수하는 협력 분석에 투자하고 있습니다. 중동 및 아프리카는 규모가 작은 반면, 걸프 협력 회의의 정밀의료 허브와 COVID-19에 대응하는 동안 플릿 시퀀서를 취득한 아프리카 기반의 병원체 유전체학 감시 컨소시엄에 의해 2자리 성장을 나타내고 있습니다. 전반적으로 지리적 다양화는 외환 위험을 완화하고 차세대 시퀀싱 시장의 장기적인 탄력성을 지원합니다.
기타 혜택 :
- 엑셀 형식 시장 예측(ME) 시트
- 3개월간의 애널리스트 서포트
목차
제1장 서론
- 조사의 전제조건 및 시장 정의
- 조사 범위
제2장 조사 방법
제3장 주요 요약
제4장 시장 상황
- 시장 개요
- 시장 성장 촉진요인
- 종양 및 희귀질환의 치료 패스웨이에서 프리시젼 메디신 및 동반진단의 도입 가속
- 보다 높은 스루풋의 케미스트리 및 혁신적인 기기 기술에 의해 유전체당의 비용은 계속적으로 저하
- 세계의 정부 및 민간 컨소시엄이 지원하는 집단 규모의 유전체 해석 프로그램 확대
- 의약품의 창약 및 바이오마커 식별 워크플로우에서 NGS의 이용 확대
- 임상 진료 가이드라인(NCCN, ACMG 등)에 의한 NGS 검사의 추천이 증가해, 지불측 상환 강화
- 대규모 데이터 분석과 해석을 합리화하는 AI 대응 바이오인포매틱스 파이프라인 통합
- 시장 성장 억제요인
- 임상 NGS 검증을 위한 단편적인 세계 규제 상황
- 국경을 넘은 유전체 데이터 전송에 대한 데이터 프라이버시 주도의 제한
- 롱 리드 및 공간 시퀀싱 플랫폼에 대한 고액 설비 투자
- 임상 등급 해석을 위한 바이오인포매틱스 인력 부족
- 규제 전망
- 기술적 상황
- Porter's Five Forces 분석
- 구매자의 협상력
- 공급기업의 협상력
- 신규 참가업체의 위협
- 대체품의 위협
- 경쟁 기업 간 경쟁 관계
제5장 시장 규모 및 성장 예측
- 시퀀싱 유형별
- 전체 유전체 시퀀싱
- 표적 재시퀀싱
- 모든 엑솜 시퀀싱
- RNA 시퀀싱
- CHIP 시퀀싱
- 데노보 시퀀싱
- 메틸 시퀀싱
- 제품 유형별
- 기기
- 시약 및 소모품
- 서비스
- 용도별
- 창약 및 맞춤형 의료
- 유전자 스크리닝
- 진단
- 농업 및 동물 연구
- 기타 용도(에피유전체학, 군유전체학, 전사체학)
- 최종 사용자별
- 병원 및 의료 기관
- 아카데믹스
- 의약품 및 바이오테크놀러지 기업
- 지역별
- 북미
- 미국
- 캐나다
- 멕시코
- 유럽
- 독일
- 영국
- 프랑스
- 이탈리아
- 스페인
- 기타 유럽
- 아시아태평양
- 중국
- 일본
- 인도
- 한국
- 호주
- 기타 아시아태평양
- 중동 및 아프리카
- GCC
- 남아프리카
- 기타 중동 및 아프리카
- 남미
- 브라질
- 아르헨티나
- 기타 남미
- 북미
제6장 경쟁 구도
- 시장 집중도
- 전략적 동향
- 시장 점유율 분석
- 기업 프로파일
- Illumina Inc.
- Thermo Fisher Scientific Inc.
- BGI Genomics Co. Ltd.
- F. Hoffmann-La Roche Ltd.
- Oxford Nanopore Technologies Plc
- Pacific Biosciences of California Inc.
- Qiagen NV
- Agilent Technologies Inc.
- Bio-Rad Laboratories Inc.
- PerkinElmer Inc.
- Eurofins Scientific SE
- Macrogen Inc.
- CD Genomics Inc.
- Genapsys Inc.
- 10x Genomics Inc.
- Twist Bioscience Corp.
- Guardant Health Inc.
- Fulgent Genetics Inc.
제7장 시장 기회 및 향후 전망
AJY 25.11.19The Next Generation Sequencing market size generated around USD 10.39 billion in 2025 and is forecast to reach nearly USD 18.26 billion by 2030, reflecting a compound annual growth rate (CAGR) of 13.7% during 2025-2030.

This expansion signals the shift from a technology-centric phase to wide clinical deployment as sequencing costs approach USD 100 per genome, lowering the affordability barrier for health-system adoption. Reagents and consumables remain the main revenue engine, while the entrance of Element Biosciences, Ultima Genomics and other challengers is expanding platform choice and encouraging price competition. Oncology retains priority, but population-scale genomics, pharmacogenomics and rare-disease diagnostics are broadening demand. Imminent FDA rules on Laboratory Developed Tests (LDTs) promise clearer quality standards, yet they also increase compliance workloads that smaller laboratories must manage.
Global Next-generation Sequencing (NGS) Market Trends and Insights
Accelerating Adoption of Precision Medicine and Companion Diagnostics Across Oncology and Rare Disease Care Pathways
Oncology crossed a milestone in 2023 when clinical sequencing volumes surpassed research use, confirming hospital confidence that genomic data can guide drug selection and reduce avoidable treatments. The United States NGS oncology segment alone touched USD 3 billion in 2023 and is tracking toward USD 4 billion by 2025, illustrating health-system appetite for broader panel tests. FDA approval of comprehensive assays such as TruSight Oncology Comprehensive widens payer acceptance and accelerates lab conversion from single-gene to multi-gene panels. Combined with EHR integration pilots that deliver pharmacogenomic alerts at the point of care, clinicians now view sequencing as a routine rather than rare test. The next generation sequencing market consequently gains recurring throughput as treatment guidelines reference genomic signatures.
Continuous Decline in Cost Per Genome Driven by Higher-Throughput Chemistries and Innovative Instrument Technologies
Chemistry miniaturization, optics upgrades and base-calling algorithms have pushed the cost per human genome below USD 200 on Illumina's NovaSeq X system and toward USD 100 on emerging competitors. Providers in oncology and neonatology can now justify sequencing over multi-step legacy assays because price no longer overwhelms diagnostic savings. Falling consumable costs also encourage academic core facilities to expand instrument fleets, driving additional reagent demand that sustains the next generation sequencing market. Continued advancements in flow-cell reusability and kit multiplexing are expected to shave another 20%-30% from per-sample expense within two years, compressing payback periods for capital equipment.
Fragmented Global Regulatory Landscape for Clinical NGS Validation
The FDA final rule classifying most LDTs as medical devices introduces phased compliance through 2028 and compels clinical labs to submit premarket reviews or pivot to FDA-cleared kits. While the policy aims to harmonize quality, legal challenges from laboratory associations create uncertainty over timelines. Laboratories must budget for validation studies and potential system upgrades, temporarily slowing capital orders. Outside the United States, divergent requirements among China's NMPA, the EU's IVDR and Japan's PMDA force vendors to localize documentation, adding expense and lengthening product launches in the next generation sequencing market.
Other drivers and restraints analyzed in the detailed report include:
- Expansion Of Population-Scale Genomics Programs Supported by Governments and Private Consortia Worldwide
- Increasing Utilization of NGS In Pharmaceutical Drug Discovery and Biomarker Identification Workflows
- Data-Privacy-Driven Restrictions on Cross-Border Genomic Data Transfer
For complete list of drivers and restraints, kindly check the Table Of Contents.
Segment Analysis
Targeted resequencing held 38.1% revenue in 2024, reinforcing its role as the workhorse for actionable cancer and germline panels that can be completed within forty-eight hours. Its focused scope reduces data-analysis burden and aligns with reimbursement codes, making it the entry point for most hospital labs in the next generation sequencing market. Whole exome sequencing is gaining as costs fall, recording a 14.2% CAGR to 2030 and serving as the first-line test with 45% diagnostic yield for rare diseases. RNA sequencing continues to proliferate in hematologic malignancies where fusion detection guides targeted therapy. Meanwhile, whole genome sequencing adoption remains modest yet rising because population projects increasingly demand full-coverage data. As AI-driven annotation accelerates, the next generation sequencing market size for WGS is forecast to outpace the overall market after 2028.
Instruments optimized for exome or genome throughput now integrate on-box secondary analysis, reducing the need for separate servers and making end-to-end turnaround more predictable. Laboratories switching from exome to genome workflows often retain existing extraction and library kits, cushioning transition costs. Vendors counterbalance cannibalization risk by offering upgrade paths that re-use flow-cell cartridges across multiple run modes. Consequently, the next generation sequencing market benefits from stickier consumable demand even as run formats diversify.
Reagents and consumables captured 69.9% of the next generation sequencing market share in 2024, underscoring the razor-and-blade model that underpins vendor profitability. Their dominant position reflects the monthly restocking cycle of flow cells, enzymes and capture probes in clinical labs that push 90% run capacity utilization. Although instruments represent a smaller base, innovations like Illumina's single-flow-cell NovaSeq X upgrade are expanding throughput while shrinking floor space. Instrument revenue thus posts a 14.4% CAGR to 2030, reinforced by leasing models that bundle reagents into multi-year contracts and cushion capital budgets.
Service providers-ranging from academic core facilities to commercial reference labs-continue to absorb complex bioinformatics workloads. Demand for data interpretation, particularly around mosaic variants and structural rearrangements, is driving a double-digit expansion in outsourced analysis. As artificial intelligence automates primary base-calling, vendors increasingly differentiate services through tertiary analytics and clinical reporting. That development anchors additional layers of recurring revenue and helps defend margins as reagent prices fall across the next generation sequencing market.
The Next Generation Sequencing (NGS) Market Report is Segmented by Type of Sequencing (Whole Genome Sequencing, and More), Product Type (Instruments, and More), Application (Drug Discovery and Personalized Medicine, and More), End User (Hospitals and Healthcare Institutions, and More), and Geography (North America, Europe, and More). The Market Forecasts are Provided in Terms of Value (USD).
Geography Analysis
North America contributed 41.9% revenue in 2024 on the back of advanced clinical reimbursement and venture funding for sequencing start-ups. The United States market expansion is reinforced by CMS coverage decisions that reimburse large somatic panels, while the phased LDT rule is expected to standardize quality and gradually accelerate payer confidence. Major academic medical centers leverage NIH grants for population-health genomics, ensuring a steady flow of instrument upgrades and consumables within the next generation sequencing market.
Asia-Pacific registers the fastest 14.2% CAGR through 2030, led by China's National Genomics Data Center and domestic innovators such as BGI. Local manufacturing incentives and large oncology incidence create favorable economics for home-grown sequencers that often undercut import prices. Japan and South Korea integrate sequencing into national cancer screening programs, while India scales pilot newborn-screening projects, widening reagent consumption. Regional regulatory reforms that streamline import licensing further accelerate technology transfer and platform penetration.
Europe maintains a significant share, supported by Horizon Europe funding and coordinated rare-disease networks. Nevertheless, GDPR data-localization constraints inflate operating costs; laboratories invest in federated analytics that comply with cross-border rules. The Middle East and Africa, though smaller, observe double-digit growth paced by precision-medicine hubs in the Gulf Cooperation Council and by Africa-based pathogen-genomics surveillance consortia that acquired fleet sequencers during the COVID-19 response. Overall, geographic diversification cushions currency risk and underpins long-term resilience of the next generation sequencing market.
- Illumina
- Thermo Fisher Scientific
- BGI Genomics Co. Ltd.
- Roche
- Oxford Nanopore Technologies Plc
- Pacific Bioscience
- QIAGEN
- Agilent Technologies
- Bio-Rad Laboratories
- PerkinElmer
- Eurofins
- Macrogen
- CD Genomics Inc.
- Genapsys Inc.
- 10x Genomics Inc.
- Twist Bioscience Corp.
- Guardant Health
- Fulgent Genetics Inc.
Additional Benefits:
- The market estimate (ME) sheet in Excel format
- 3 months of analyst support
TABLE OF CONTENTS
1 Introduction
- 1.1 Study Assumptions & Market Definition
- 1.2 Scope of the Study
2 Research Methodology
3 Executive Summary
4 Market Landscape
- 4.1 Market Overview
- 4.2 Market Drivers
- 4.2.1 Accelerating Adoption of Precision Medicine and Companion Diagnostics Across Oncology and Rare Disease Care Pathways
- 4.2.2 Continuous Decline in Cost Per Genome Driven by Higher-Throughput Chemistries and Innovative Instrument Technologies
- 4.2.3 Expansion Of Population-Scale Genomics Programs Supported by Governments and Private Consortia Worldwide
- 4.2.4 Increasing Utilization of NGS In Pharmaceutical Drug Discovery and Biomarker Identification Workflows
- 4.2.5 Clinical-practice Guidelines (e.g., NCCN, ACMG) Increasingly Endorsing NGS Tests, Bolstering Payer Reimbursement
- 4.2.6 Integration of AI-enabled Bioinformatics Pipelines that Streamline Large-scale Data Analysis and Interpretation
- 4.3 Market Restraints
- 4.3.1 Fragmented Global Regulatory Landscape for Clinical NGS Validation
- 4.3.2 Data-Privacy-Driven Restrictions on Cross-Border Genomic Data Transfer
- 4.3.3 High Capital Outlay for Long-Read & Spatial Sequencing Platforms
- 4.3.4 Shortage of Bioinformatics Talent for Clinical Grade Interpretation
- 4.4 Regulatory Outlook
- 4.5 Technological Landscape
- 4.6 Porter's Five Forces Analysis
- 4.6.1 Bargaining Power of Buyers
- 4.6.2 Bargaining Power of Suppliers
- 4.6.3 Threat of New Entrants
- 4.6.4 Threat of Substitutes
- 4.6.5 Intensity of Competitive Rivalry
5 Market Size & Growth Forecasts (Value, USD)
- 5.1 By Type of Sequencing
- 5.1.1 Whole Genome Sequencing
- 5.1.2 Targeted Resequencing
- 5.1.3 Whole Exome Sequencing
- 5.1.4 RNA Sequencing
- 5.1.5 CHIP Sequencing
- 5.1.6 De Novo Sequencing
- 5.1.7 Methyl Sequencing
- 5.2 By Product Type
- 5.2.1 Instruments
- 5.2.2 Reagents and Consumables
- 5.2.3 Services
- 5.3 By Application
- 5.3.1 Drug Discovery and Personalized Medicine
- 5.3.2 Genetic Screening
- 5.3.3 Diagnostics
- 5.3.4 Agriculture and Animal Research
- 5.3.5 Other Applications (Epigenomics, Metagenomics, Transcriptomics)
- 5.4 By End User
- 5.4.1 Hospitals and Healthcare Institutions
- 5.4.2 Academics
- 5.4.3 Pharmaceuticals and Biotechnology Companies
- 5.5 Geography
- 5.5.1 North America
- 5.5.1.1 United States
- 5.5.1.2 Canada
- 5.5.1.3 Mexico
- 5.5.2 Europe
- 5.5.2.1 Germany
- 5.5.2.2 United Kingdom
- 5.5.2.3 France
- 5.5.2.4 Italy
- 5.5.2.5 Spain
- 5.5.2.6 Rest of Europe
- 5.5.3 Asia-Pacific
- 5.5.3.1 China
- 5.5.3.2 Japan
- 5.5.3.3 India
- 5.5.3.4 South Korea
- 5.5.3.5 Australia
- 5.5.3.6 Rest of Asia-Pacific
- 5.5.4 Middle-East and Africa
- 5.5.4.1 GCC
- 5.5.4.2 South Africa
- 5.5.4.3 Rest of Middle East and Africa
- 5.5.5 South America
- 5.5.5.1 Brazil
- 5.5.5.2 Argentina
- 5.5.5.3 Rest of South America
- 5.5.1 North America
6 Competitive Landscape
- 6.1 Market Concentration
- 6.2 Strategic Moves
- 6.3 Market Share Analysis
- 6.4 Company Profiles (includes Global level Overview, Market level overview, Core Business Segments, Financials, Headcount, Key Information, Market Rank, Market Share, Products and Services, and analysis of Recent Developments)
- 6.4.1 Illumina Inc.
- 6.4.2 Thermo Fisher Scientific Inc.
- 6.4.3 BGI Genomics Co. Ltd.
- 6.4.4 F. Hoffmann-La Roche Ltd.
- 6.4.5 Oxford Nanopore Technologies Plc
- 6.4.6 Pacific Biosciences of California Inc.
- 6.4.7 Qiagen N.V.
- 6.4.8 Agilent Technologies Inc.
- 6.4.9 Bio-Rad Laboratories Inc.
- 6.4.10 PerkinElmer Inc.
- 6.4.11 Eurofins Scientific SE
- 6.4.12 Macrogen Inc.
- 6.4.13 CD Genomics Inc.
- 6.4.14 Genapsys Inc.
- 6.4.15 10x Genomics Inc.
- 6.4.16 Twist Bioscience Corp.
- 6.4.17 Guardant Health Inc.
- 6.4.18 Fulgent Genetics Inc.
7 Market Opportunities & Future Outlook
- 7.1 White-Space & Unmet-Need Assessment
