


|
시장보고서
상품코드
1906910
PET 포장 : 시장 점유율 분석, 업계 동향 및 통계, 성장 예측(2026-2031년)PET Packaging - Market Share Analysis, Industry Trends & Statistics, Growth Forecasts (2026 - 2031) |
||||||
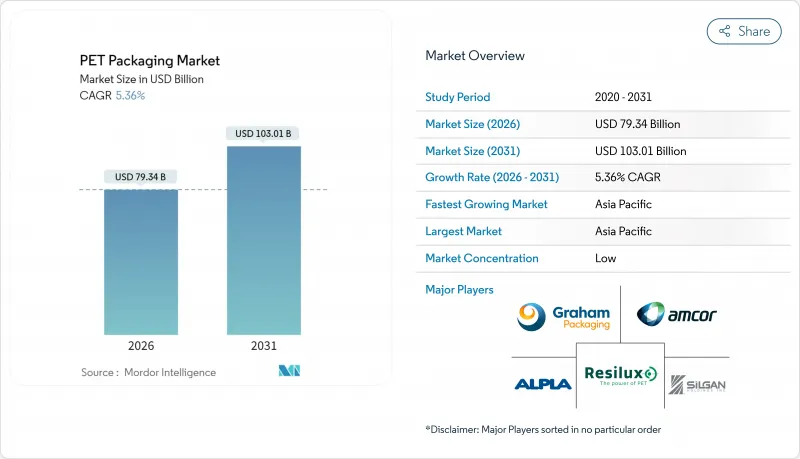
PET 포장 시장은 2025년 753억 달러로 평가되었으며, 2026년 793억 4,000만 달러에서 2031년까지 1,030억 1,000만 달러에 이를 것으로 예상됩니다.
예측 기간(2026-2031년)의 CAGR은 5.36%를 나타낼 것으로 전망됩니다.

음료, 식품, 의약품 분야의 안정적인 수요로 지속가능성에 대한 압력이 높아지는 가운데 PET 포장 시장은 꾸준한 성장 궤도를 유지하고 있습니다. 재생재의 사용을 의무화하는 규제, 전자상거래량 증가, 화학적 리사이클 기술의 진보가 함께 PET의 확고한 지위를 강화하고 있습니다. 브랜드 소유자에 의한 재생 PET 사용의 최소 기준에 대한 노력은 재활용 능력에 대한 대규모 투자를 촉진하는 반면, 경량화는 물류 배출량과 비용 절감으로 이어지고 있습니다. 한편, 변동하는 버진 수지 가격과 지역마다 다른 일회용 플라스틱 금지 조치로 버진 원료와 재생 원료의 균형을 맞추는 통합 공급망의 중요성이 높아지고 있습니다.
세계의 PET 포장 시장 동향과 인사이트
높은 재활용성과 경량화의 이점
PET는 물성의 현저한 열화 없이 기계적 재활용을 반복할 수 있어 경쟁 소재에 대해 순환성 면에서 우위를 발휘합니다. 그 밀도는 유리보다 약 40% 낮아 지역 내 및 국경 간 물류에서 화물 운송 시 배출량과 비용을 절감합니다. 리옹 델 바젤의 독일 공장과 같은 화학적 탈중합 플랜트는 순도가 95% 이상인 단량체를 회수하여 폐쇄형 루프 공급망을 강화하고 있습니다. 화학적 재활용과 기계적 재활용 옵션이 모두 확대됨에 따라 공급 안정성이 향상되고, PET 포장 시장은 경쟁재료를 추종할 수 없는 비용 우위를 확보하고 있습니다. 따라서 브랜드 소유자는 비싼 라인 개조 없이 기후 변화 대책과 순환 목표를 달성하기 위한 현실적인 수단으로 PET를 포착하고 있습니다.
EU 및 미국에서 식품 등급 rPET의 의무화
EU 규정 2025/40에 따라 음료 병은 2030년까지 30%, 2040년까지 65%의 재활용 소재 함유가 의무화되어 지역의 재활용 PET 공급을 급격히 긴축시킵니다. FDA의 21 CFR 177.1630에 근거한 지침도 마찬가지로 명확해지며, 가공업자는 식품 접촉 용도에 대한 특정 재활용 프로세스를 인증할 수 있습니다. 다국적 음료 제조업체는 더욱 엄격한 중간 목표를 내걸고 있으며, 수요의 전도와 고품질 rPET의 프리미엄 가격 상승을 초래하고 있습니다. 이 수급 격차이 PET 포장 시장의 밸류 체인 전체에서 신규·기존 리사이클 프로젝트를 촉진. 투자자들은 PET 재활용 능력을 환경 의무가 아닌 전략적 자산으로 파악하기 시작했습니다.
일회용 파우치에 대한 새로운 플라스틱 규제의 움직임
호주의 각 주와 캐나다 주에서는 특정 PET 가방과 소형 용기가 금지되기 시작했습니다. 음료 병의 대부분은 여전히 적용 제외이지만, 이 동향은 불확실성을 낳고, 연구개발비가 리필 가능한 형식으로 시프트할 가능성을 가지고 있습니다. 조미료 파우치 등의 틈새 용도에서는 컨버터 각사는 규제 당국의 감시를 회피하기 위해 대체 기재의 검토와 대형 멀티서브 팩에 집중하고 있으며, 광범위한 PET 포장 시장에서 해당 부문의 성장을 억제하고 있습니다.
부문 분석
경질 PET는 2025년 매출의 83.12%를 차지하며, 탄산음료와 상온보존식품용 병저에 의해 PET 포장 시장의 기반을 유지했습니다. 이 이점은 세계의 충전 라인과의 호환성, 우수한 장벽 성능, 비용 효율적인 공급망에 뿌리를두고 있습니다. 그러나 플렉서블 PET 제품은 급속히 확대되고 있으며, 고산소 배리어성을 갖추면서 재료 사용량을 40-60% 삭감할 수 있는 다층 필름의 채용에 의해 CAGR 6.08%를 달성하고 있습니다. 브랜드 소유자는 연포장을 활용하여 운송 중량을 줄이고 공간 효율적인 형태를 선호하는 전자상거래 수요의 급증에 대응하고 있습니다.
유연한 PET 포장 시장 규모는 고온 충전 지원 파우치가 주스와 유제품 라인에 도입됨에 따라 가속 성장 궤도에 있습니다. 운송시 환경 부하 경감과 파손 위험 저감이 온라인 소매업체에게 지지되는 한편, 배리어 필름에 의해 품질은 경질 용기와 동등 수준을 유지하고 있습니다. 재활용 시스템이 단일 소재 PET 파우치를 수락하기 시작하면 회수 장벽이 완화될 것으로 예상되며, 이 부문의 장기적인 전망은 더욱 견고합니다.
병과 항아리는 2025년 수익의 75.74%를 차지하며 물, 청량음료, 식용유, 개인보호액제 분야의 보급도를 반영했습니다. 고속 라인 대응, 표준화된 캡 및 소비자의 인지도가 높이에 의해 주도적 지위를 유지하고 있습니다. 에너지 음료 분야에서 알루미늄 캔과 고급 주류 분야에서 유리병과의 경쟁이 있음에도 불구하고, PET 병 시장 점유율은 여전히 큽니다. 현재 연구개발에서는 병 1개당 수지 사용량을 삭감하면서 상부 하중 강도를 손상시키지 않는 경량 프리폼의 개발이 초점이 되고 있습니다.
파우치와 향 주머니는 현재 규모가 작고 CAGR 6.33%로 가장 높은 성장률을 보였습니다. 단회 사용의 가정용 세제, 유아용 요구르트, 휴대용 음료 등이, 재봉 가능한 파우치에의 이행을 진행시키고 있습니다. 투명한 PET 층은 제품의 가시성을 요구하는 브랜드 요구 사항을 충족하며, 쏟아지는 캡은 편리한 쏟아져 있습니다. 호주와 캐나다의 일부 지역에서 일회용 파우치로의 규제 강화는 해당 지역의 성장을 억제하고 있지만, 아시아와 라틴아메리카에서의 확대가 이를 웃돌고 있습니다.
지역별 분석
아시아태평양은 2025년 수익의 38.55%를 차지했으며 중간층 소비 확대와 현지 생산 규모 확대를 배경으로 CAGR 7.42%에서 가장 급속히 확대하고 있습니다. 통합석유화학 콤플렉스에 의한 저비용 수지 공급과 정부의 재활용 능력에 대한 외자유치가 함께 성장을 가속하고 있습니다. 인도네시아의 Indorama Ventures사와 Ganesha Ecopet사, PT Amandina사의 공동 사업 등에 의해 다국적 음료 브랜드용으로 병에서 병에의 고품질 rPET 공급이 보증되고 있습니다. 일부 국가에서는 일회용 금지가 논의되지만 PET 병은 일반적으로 최근 규제 대상이 아니며 단기 성장이 유지될 것으로 예측됩니다.
유럽은 재활용 소재 사용률의 의무화와 엄격한 식품 접촉 규제를 통해 역외에 규제 영향력을 발휘하고 있습니다. 리요넬베셀사나 이스트만사에 의한 화학적 리사이클 플랜트공급 증가에 의해 유럽의 PET 포장 시장 규모는 꾸준히 확대. 높은 분별율과 보증금 반환 제도가 병 투 병 순환을 지지해, 브랜드 각사의 2030년 목표 달성을 가능하게 하고 있습니다. 고품질 rPET 가격 설정은 통합 사업자에게 매력적인 수익원이 되었습니다.
북미에서는 성숙한 충전 네트워크와 견고한 호별 회수 시스템이 정비되어 있지만, 일회용 포장재에 관한 주 수준의 규제는 변동이 있습니다. FDA의 가이던스에 의해 재생 PET의 승인이 간소화되고, 물이나 탄산음료 라인에서의 채용이 진행되고 있습니다. 남미 및 중동 및 아프리카는 회수 인프라에서 지연을 겪고 있지만 인구 증가와 도시화가 포장 상품 수요를 가속화하기 때문에 성장의 여지가 있습니다. 컨버터는 PET를 선택하는 경향이 있습니다. 대체 소재는 보다 저온의 콜드체인이나 내상성 코팅이 필요하여 비용 상승을 초래하기 때문입니다.
기타 혜택 :
- 엑셀 형식 시장 예측(ME) 시트
- 애널리스트 지원(3개월간)
자주 묻는 질문
목차
제1장 서론
- 조사 전제조건 및 시장 정의
- 조사 범위
제2장 조사 방법
제3장 주요 요약
제4장 시장 상황
- 시장 개요
- 시장 성장 촉진요인
- 높은 재활용성과 경량화의 장점
- EU 및 미국에서 식품 등급 rPET의 의무화
- 고온 충전 라인 및 탄산 음료 라인에서의 채용 확대
- 전자상거래 대응 포장 형태의 성장
- 화학적 재활용 인프라 정비
- 브랜드 소유자의 rPET 함유율 25-50% 달성에의 대처
- 시장 성장 억제요인
- 버진 PET 수지 가격의 변동성
- 일회용 파우치에 대한 새로운 플라스틱 규제의 움직임
- 병·투·병 순환형 공급의 갭
- 소비자의 「플라스틱 프리」지향으로의 변화
- 업계 밸류체인 분석
- 규제 상황
- 기술의 전망
- Porter's Five Forces 분석
- 신규 진입업자의 위협
- 구매자의 협상력
- 공급기업의 협상력
- 대체품의 위협
- 경쟁 기업 간 경쟁 관계
- 거시경제 요인이 시장에 미치는 영향
제5장 시장 규모와 성장 예측
- 포장 형태별
- 경질 PET 포장 시장
- 연질 PET 포장 시장
- 제품 유형별
- 병 및 자
- 파우치 및 봉지
- 트레이 및 크램쉘
- 뚜껑-캡 및 밀폐재
- 프리폼 및 기타 제품 유형
- 수지 등급별
- 버진 PET(vPET)
- 재생 PET(rPET)
- 최종 사용자 업계별
- 식품 및 음료
- 제약
- 퍼스널케어 및 화장품
- 가정용품
- 산업 제품
- 기타 최종 사용자 산업
- 지역별
- 북미
- 미국
- 캐나다
- 멕시코
- 유럽
- 독일
- 영국
- 프랑스
- 이탈리아
- 스페인
- 기타 유럽
- 아시아태평양
- 중국
- 일본
- 인도
- 한국
- 호주
- 태국
- 말레이시아
- 기타 아시아태평양
- 남미
- 브라질
- 아르헨티나
- 기타 남미
- 중동 및 아프리카
- 중동
- 아랍에미리트(UAE)
- 사우디아라비아
- 튀르키예
- 기타 중동
- 아프리카
- 남아프리카
- 나이지리아
- 기타 아프리카
- 중동
- 북미
제6장 경쟁 구도
- 시장 집중도
- 전략적 동향
- 시장 점유율 분석
- 기업 프로파일
- Amcor plc
- Resilux NV
- Gerresheimer AG
- ALPLA Werke Alwin Lehner GmbH and Co KG
- Silgan Holdings Inc.
- Graham Packaging Company LP
- GTX Hanex Plastic Sp. z oo
- Dunmore Corporation
- Comar LLC
- TOPPAN Holdings Inc.
- Huhtamaki Oyj
- Nampak Ltd.
- Plastipak Holdings Inc.
- ACTI PACK SAS
- RETAL Industries Ltd
- Sealed Air Corporation
- Pactiv Evergreen Inc.
- Uflex Ltd.
- Zhongfu Industrial Co. Ltd.
- Novapet SA
제7장 시장 기회와 향후 전망
KTH 26.01.20The PET packaging market was valued at USD 75.30 billion in 2025 and estimated to grow from USD 79.34 billion in 2026 to reach USD 103.01 billion by 2031, at a CAGR of 5.36% during the forecast period (2026-2031).
Consistent demand from beverages, food, and pharmaceuticals keeps the PET packaging market on a steady growth path even as sustainability pressures intensify. Regulatory mandates that require recycled content, rising e-commerce volumes, and advances in chemical recycling all reinforce PET's entrenched position. Brand-owner commitments to minimum recycled PET thresholds are catalyzing large-scale investments in recycling capacity, while lightweighting gains lower logistics emissions and costs. Meanwhile, volatile virgin resin prices and a patchwork of single-use plastic bans place a premium on integrated supply chains able to balance virgin and recycled inputs.
Global PET Packaging Market Trends and Insights
High Recyclability and Light-Weighting Advantage
PET allows repeated mechanical recycling without substantial property loss, which gives it a circular edge over rival substrates. Its density is roughly 40% lower than glass, cutting freight emissions and costs in regional and cross-border logistics. Chemical depolymerization plants such as LyondellBasell's German site reclaim 95%-plus pure monomers, reinforcing closed-loop supply chains. As both chemical and mechanical recycling options scale, supply stability improves, and the PET packaging market secures a cost advantage that competing materials struggle to match. Brand owners thus view PET as a pragmatic path to meet climate and circularity goals without costly line retrofits.
Food-Grade rPET Mandates in EU and US
Regulation (EU) 2025/40 compels beverage bottles to carry 30% recycled content by 2030 and 65% by 2040, instantly tightening regional rPET supply. FDA guidance under 21 CFR 177.1630 offers parallel clarity, allowing converters to qualify specific recycling processes for food contact. Multinational beverage firms have pledged even steeper interim targets, pulling demand forward and raising premiums for high-quality rPET. The resulting supply-demand gap is spurring green-field and brown-field recycling projects across the PET packaging market value chain. Investors now see PET recycling capacity as a strategic asset rather than an environmental obligation.
Emerging Plastic Bans on Single-Use Sachets
Australia's states and Canadian provinces have begun banning certain PET sachets and small containers. Although most beverage bottles remain exempt, the policy trend seeds uncertainty that may shift R&D spending toward refillable formats. For niche applications such as condiment sachets, converters now weigh alternate substrates or concentrate on larger multi-serve packs to avoid regulatory scrutiny, tempering segment growth within the broader PET packaging market.
Other drivers and restraints analyzed in the detailed report include:
- Increased Adoption in Hot-Fill and CSD Lines
- Deployment of Chemical Recycling Infrastructure
- Bottle-to-Bottle Loop Supply Gap
For complete list of drivers and restraints, kindly check the Table Of Contents.
Segment Analysis
Rigid PET commanded 83.12% of 2025 revenue and continues to anchor the PET packaging market thanks to bottles and jars in carbonated drinks and shelf-stable foods. This dominance is rooted in global filling-line compatibility, strong barrier performance, and cost-efficient supply chains. However, flexible PET options are scaling quickly, achieving 6.08% CAGR as converters adopt multilayer films with high oxygen barriers and 40-60% lower material use. Brand owners leverage flexible packs to cut shipping weight and adapt to e-commerce demand spikes that favor space-efficient formats.
The PET packaging market size for flexible formats is on an accelerating trajectory as hot-fill capable pouches enter juice and dairy lines. Smaller transportation footprints and lower breakage risk appeal to online retailers, while barrier films keep quality on par with rigid containers. As recycling systems begin accepting mono-material PET pouches, collection hurdles are projected to ease, which strengthens the long-term outlook for this segment.
Bottles and jars held 75.74% of 2025 revenue, reflecting their ubiquity across water, soft drinks, edible oils, and personal-care liquids. High line speeds, standardized closures, and consumer familiarity sustain leadership. The PET packaging market share for bottles remains sizable despite competition from aluminum in energy drinks and glass in premium spirits. R&D now targets lightweight preforms that trim resin usage per bottle without compromising top-load strength.
Pouches and sachets, though smaller today, exhibit the highest growth at 6.33% CAGR. Unit-dose household cleaners, toddler yogurts, and on-the-go beverages all migrate toward resealable pouches. Transparent PET layers satisfy brand demands for product visibility, while spouted caps enable convenient pouring. Regulatory scrutiny of single-use sachets in parts of Australia and Canada tempers growth in those regions but is outweighed by expansion in Asia and Latin America.
The PET Packaging Market Report is Segmented by Packaging Format (Rigid PET Packaging, and Flexible PET Packaging), Product Type (Bottles and Jars, Pouches and Sachets, Trays and Clamshells, and More), Resin Grade (Virgin PET, and Recycled PET), End-User Industry (Food and Beverage, Pharmaceuticals, Personal Care and Cosmetics, and More), and Geography. The Market Forecasts are Provided in Terms of Value (USD).
Geography Analysis
Asia-Pacific captured 38.55% of 2025 revenue and is expanding fastest at 7.42% CAGR, fueled by rising middle-class spending and local manufacturing scale. Integrated petrochemical complexes deliver low-cost resin, while governments court foreign investment in recycling capacity. Projects such as Indorama Ventures' venture with Ganesha Ecopet and PT Amandina in Indonesia guarantee bottle-to-bottle quality rPET for multinational beverage brands. Although some countries debate single-use bans, PET bottles usually remain outside immediate regulatory targets, preserving short-term growth.
Europe wields regulatory influence beyond its borders through mandatory recycled-content quotas and strict food-contact rules. The PET packaging market size in Europe steadily climbs as chemical recycling plants from LyondellBasell and Eastman augment supply. High sorting rates and deposit-return schemes underpin bottle-to-bottle loops that enable brands to meet 2030 targets. Premium rPET pricing generates attractive returns for integrated players.
North America hosts mature filler networks and a robust curbside collection system, but faces divergent state-level regulations on single-use packaging. FDA guidance simplifies rPET approvals, aiding adoption in water and carbonated drink lines. South America and the Middle East & Africa trail in collection infrastructure, yet present upside as population growth and urbanization accelerate packaged goods demand. Converters gravitate toward PET because alternative substrates require colder chains or scratch-resistant finishes that raise costs.
- Amcor plc
- Resilux NV
- Gerresheimer AG
- ALPLA Werke Alwin Lehner GmbH and Co KG
- Silgan Holdings Inc.
- Graham Packaging Company LP
- GTX Hanex Plastic Sp. z o.o.
- Dunmore Corporation
- Comar LLC
- TOPPAN Holdings Inc.
- Huhtamaki Oyj
- Nampak Ltd.
- Plastipak Holdings Inc.
- ACTI PACK S.A.S
- RETAL Industries Ltd
- Sealed Air Corporation
- Pactiv Evergreen Inc.
- Uflex Ltd.
- Zhongfu Industrial Co. Ltd.
- Novapet S.A.
Additional Benefits:
- The market estimate (ME) sheet in Excel format
- 3 months of analyst support
TABLE OF CONTENTS
1 INTRODUCTION
- 1.1 Study Assumptions and Market Definition
- 1.2 Scope of the Study
2 RESEARCH METHODOLOGY
3 EXECUTIVE SUMMARY
4 MARKET LANDSCAPE
- 4.1 Market Overview
- 4.2 Market Drivers
- 4.2.1 High Recyclability and Light-Weighting Advantage
- 4.2.2 Food-Grade rPET Mandates in EU and US
- 4.2.3 Increased Adoption in Hot-Fill and CSD Lines
- 4.2.4 Growth of E-Commerce Ready Packaging Formats
- 4.2.5 Deployment of Chemical Recycling Infrastructure
- 4.2.6 Brand-Owner Commitments to 25-50% rPET Content
- 4.3 Market Restraints
- 4.3.1 Volatility in Virgin PET Resin Prices
- 4.3.2 Emerging Plastic Bans on Single-Use Sachets
- 4.3.3 Bottle-to-Bottle Loop Supply Gap
- 4.3.4 Consumer Perception Shift Toward "Plastic-Free"
- 4.4 Industry Value Chain Analysis
- 4.5 Regulatory Landscape
- 4.6 Technological Outlook
- 4.7 Porter's Five Forces Analysis
- 4.7.1 Threat of New Entrants
- 4.7.2 Bargaining Power of Buyers
- 4.7.3 Bargaining Power of Suppliers
- 4.7.4 Threat of Substitute Products
- 4.7.5 Intensity of Competitive Rivalry
- 4.8 Impact of Macroeconomic Factors on the Market
5 MARKET SIZE AND GROWTH FORECASTS (VALUE)
- 5.1 By Packaging Format
- 5.1.1 Rigid PET Packaging
- 5.1.2 Flexible PET Packaging
- 5.2 By Product Type
- 5.2.1 Bottles and Jars
- 5.2.2 Pouches and Sachets
- 5.2.3 Trays and Clamshells
- 5.2.4 Lids-Caps and Closures
- 5.2.5 Preforms and Other Product Types
- 5.3 By Resin Grade
- 5.3.1 Virgin PET (vPET)
- 5.3.2 Recycled PET (rPET)
- 5.4 By End-User Industry
- 5.4.1 Food and Beverage
- 5.4.2 Pharmaceuticals
- 5.4.3 Personal Care and Cosmetics
- 5.4.4 Household
- 5.4.5 Industrial Goods
- 5.4.6 Other End-User Industries
- 5.5 By Geography
- 5.5.1 North America
- 5.5.1.1 United States
- 5.5.1.2 Canada
- 5.5.1.3 Mexico
- 5.5.2 Europe
- 5.5.2.1 Germany
- 5.5.2.2 United Kingdom
- 5.5.2.3 France
- 5.5.2.4 Italy
- 5.5.2.5 Spain
- 5.5.2.6 Rest of Europe
- 5.5.3 Asia-Pacific
- 5.5.3.1 China
- 5.5.3.2 Japan
- 5.5.3.3 India
- 5.5.3.4 South Korea
- 5.5.3.5 Australia
- 5.5.3.6 Thailand
- 5.5.3.7 Malaysia
- 5.5.3.8 Rest of Asia-Pacific
- 5.5.4 South America
- 5.5.4.1 Brazil
- 5.5.4.2 Argentina
- 5.5.4.3 Rest of South America
- 5.5.5 Middle East and Africa
- 5.5.5.1 Middle East
- 5.5.5.1.1 United Arab Emirates
- 5.5.5.1.2 Saudi Arabia
- 5.5.5.1.3 Turkey
- 5.5.5.1.4 Rest of Middle East
- 5.5.5.2 Africa
- 5.5.5.2.1 South Africa
- 5.5.5.2.2 Nigeria
- 5.5.5.2.3 Rest of Africa
- 5.5.5.1 Middle East
- 5.5.1 North America
6 COMPETITIVE LANDSCAPE
- 6.1 Market Concentration
- 6.2 Strategic Moves
- 6.3 Market Share Analysis
- 6.4 Company Profiles (includes Global level Overview, Market level overview, Core Segments, Financials as available, Strategic Information, Market Rank/Share for key companies, Products and Services, and Recent Developments)
- 6.4.1 Amcor plc
- 6.4.2 Resilux NV
- 6.4.3 Gerresheimer AG
- 6.4.4 ALPLA Werke Alwin Lehner GmbH and Co KG
- 6.4.5 Silgan Holdings Inc.
- 6.4.6 Graham Packaging Company LP
- 6.4.7 GTX Hanex Plastic Sp. z o.o.
- 6.4.8 Dunmore Corporation
- 6.4.9 Comar LLC
- 6.4.10 TOPPAN Holdings Inc.
- 6.4.11 Huhtamaki Oyj
- 6.4.12 Nampak Ltd.
- 6.4.13 Plastipak Holdings Inc.
- 6.4.14 ACTI PACK S.A.S
- 6.4.15 RETAL Industries Ltd
- 6.4.16 Sealed Air Corporation
- 6.4.17 Pactiv Evergreen Inc.
- 6.4.18 Uflex Ltd.
- 6.4.19 Zhongfu Industrial Co. Ltd.
- 6.4.20 Novapet S.A.
7 MARKET OPPORTUNITIES AND FUTURE OUTLOOK
- 7.1 White-Space and Unmet-Need Assessment
