
|
시장보고서
상품코드
1934623
싱가포르의 재생에너지 : 시장 점유율 분석, 업계 동향과 통계, 성장 예측(2026-2031년)Singapore Renewable Energy - Market Share Analysis, Industry Trends & Statistics, Growth Forecasts (2026 - 2031) |
||||||
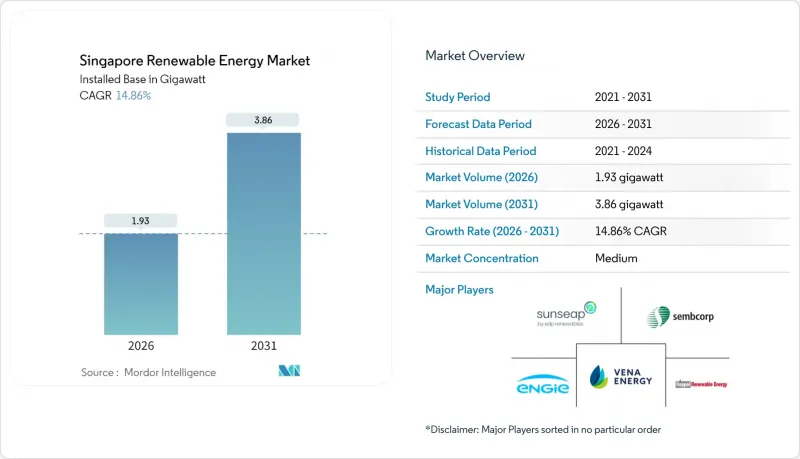
싱가포르의 재생에너지 시장 규모는 2026년에 1.93기가와트에 이를 것으로 예측되고 있습니다.
이는 2025년 1.68기가와트에서 성장한 수치이며, 2031년에는 3.86기가와트에 달할 것으로 예측됩니다. 2026년부터 2031년까지 연평균 성장률(CAGR)은 14.86%로 예측됩니다.
청정 전력에 대한 기업 수요 증가, 엄격한 넷제로 규제, 지역 전체의 전력 수입 계획이 투자를 가속화하고 있습니다. 국토 면적이 728평방킬로미터에 불과한 도시국가에서 옥상형, 부유식, 연안형이 가장 공간 효율이 높은 선택이기 때문에 태양광 발전은 주도적인 역할을 유지하고 있습니다. 동남아시아 최대 규모인 285MWh의 전력 저장 시스템 도입과 620만 싱가포르 달러의 R&D 보조금을 통한 태양광 발전 예측 모델 개발은 송전망 운영자가 간헐성 문제를 어떻게 해결하고 있는지를 보여줍니다. 2035년까지 6기가와트 규모의 지역 간 전력 수입 목표는 공급원 다변화를 가져오는 동시에 싱가포르가 국경을 초월한 청정 전력 허브로서의 입지를 확고히할 것입니다. 급성장하는 데이터센터 클러스터의 지속가능성 요건이 강화됨에 따라 프로젝트 개발자는 장기적인 전력 수요에 대한 확신을 더욱 높일 수 있게 되었습니다.
싱가포르의 재생에너지 시장 동향과 전망
2050년 넷제로 및 2030년 그린플랜 목표가 재생에너지 도입을 가속화합니다.
2050년까지 법적 구속력이 있는 넷제로 목표와 2035년까지 4500만-5,000만 톤의 CO2e 감축이라는 갱신된 목표가 분명한 수요 시그널을 만들어내고 있습니다. 2025년 2월 정책 갱신 직후, 탄소회수 기능을 갖춘 수소발전소(총 10억 달러 규모)에 대한 최종 투자 결정이 내려졌습니다. 신규 발전설비는 최소 30%의 수소 대응이 의무화되어 재생에너지와의 하이브리드화를 촉진하는 기술 혁신이 요구되고 있습니다. 에너지시장청(EMA)은 배출량 기반 입찰 기준을 전력시장에 도입하여 탄소 집약적 발전의 비용을 억제하고 있습니다. 국가기후 변화사무국의 명확한 책임 메커니즘을 통해 재생가능에너지의 위치가 '선택적 효율화 수단'에서 '규제 준수 필수 요건'으로 바뀌었습니다. 따라서 부유식 태양광 발전이나 대규모 축전설비 등 도입에 긴 리드타임이 필요한 자산은 싱가포르의 재생에너지 시장에서 보다 빠른 인허가와 저비용의 그린 파이낸싱을 확보할 수 있습니다.
높은 지붕면 일사량에 따른 태양광 발전 설비투자 감소
2024년부터 2025년까지 Tier 1 모듈의 자본비용이 7% 더 낮아져 싱가포르의 연간 일사량 1,700kWh/m2와 결합하여 프로젝트의 경제성을 개선하고 있습니다. 정부는 고정가격임베디드제도(FIT)를 도입하지 않고, 대신 간소화된 크레딧 제도를 통해 소유자는 관료적 지연 없이 잉여 전력을 판매할 수 있습니다. 2024년 신규 도입 용량의 63.5%를 민간부문이 공급할 것으로 예상되며, 순수한 비용 경쟁력이 도입을 주도하고 있음을 입증했습니다. 고도화된 기상 분석과 연동된 태양광 발전 예측을 통해 계통연계 조정요금을 절감하고 내부 수익률을 향상시키고 있습니다. 지붕 설치형 임대 계약은 15-20년의 회수 기간을 전제로 구축되기 때문에 상업용 부동산 소유주들은 싱가포르의 재생에너지 시장에서 태양광 발전을 ESG 대책의 부가가치가 아닌 핵심적인 인프라 업데이트로 인식하는 경향이 강해지고 있습니다.
대규모 발전설비를 위한 심각한 토지 부족
싱가포르 국토 면적 중 산업용지 및 인프라 용지로 지정된 면적은 23%에 불과해 지상 설치형 프로젝트의 제약 요인으로 작용하고 있습니다. 개발업체들은 25년의 자산 수명에 맞추어 보다 장기적인 토지 임대차 계약을 요구하고 있지만, 정부기관은 15년 이하의 계약기간으로 토지를 배정하는 경우가 많습니다. 유엔기후 변화협약(UNFCCC)의 '대체에너지 취약지역' 지정은 구조적 한계를 드러내고 있습니다. 건물 외벽에 수직 양면 어레이와 주차장 캐노피 시스템과 같은 혁신 기술로 인해 간과되기 쉬운 표면에 전력을 공급할 수 있게 되었지만, 그 총 기여도는 여전히 미미합니다. 따라서 정책은 지역으로부터의 수입에 중점을 두고 있으며, 부유식 태양광 발전이 싱가포르의 재생에너지 시장의 성장 모멘텀을 유지하고 있습니다.
부문 분석
태양광은 2025년 용량의 83.65%를 공급하고 2031년까지 연평균 복합 성장률(CAGR) 15.38%를 유지할 것으로 예상되며, 싱가포르의 재생에너지 시장의 중추적인 역할을 확고히 하고 있습니다. 텐게, 베독, 판당 각 저수지의 부유식 어레이만 해도 200MW 이상을 창출하고 있으며, 이것이 없다면 150-200헥타르의 귀중한 토지가 필요하다는 계산이 나옵니다. 산업단지에서는 지붕 설치형 시스템이 주류를 이루고 있으며, 1,580kWh/m2의 조도와 양면 수광모듈을 활용하여 공장 및 데이터센터에 계통연계 가격 이하의 전력 공급을 실현하고 있습니다. 평균 풍속 2-3m/s의 혼잡한 연안 해역으로 인해 풍력 발전은 여전히 제한적입니다. 또한, 평탄한 지형 때문에 국내 수력발전은 존재하지 않습니다. 폐기물 발전소는 150MW의 바이오에너지를 추가하고, 300만 톤의 도시 쓰레기를 처리하여 매립지 의존도를 낮추고 있습니다. 지열 및 해양 에너지는 연구 단계에 있으며, 낮은 열 구배와 최소한의 조수간만의 차가 장벽으로 작용하고 있습니다.
따라서 태양광을 제외한 싱가포르의 재생에너지 시장 점유율은 선택적 다각화보다는 필요에 의해 형성되고 있습니다. 라오스로부터의 수력발전 수입은 25년간 PPA(전력구매계약)에 따라 100MW를 공급하고 있으며, 향후 캄보디아 및 베트남의 저탄소 에너지 수입 계획에 따른 연결도 기대되고 있습니다. 건물 일체형 태양광 발전은 마리나 베이 샌즈 등 주요 개발 프로젝트에서 보급이 진행되고 있으며, 파사드 설치 시스템이 그린마크 인증 요건을 충족하고 있습니다. 비태양광 기술 전체 설치 용량 점유율은 2031년까지 20% 미만을 유지할 것으로 예측됩니다.
싱가포르의 재생에너지 시장 보고서는 기술별(태양광, 풍력, 수력, 바이오에너지, 지열, 해양에너지) 및 최종사용자별(유틸리티, 상업/산업, 주거용)로 분류되어 있습니다. 시장 규모와 예측은 설치 용량(GW) 단위로 제공됩니다.
기타 특전:
- 엑셀 형식 시장 예측(ME) 시트
- 애널리스트의 3개월 지원
자주 묻는 질문
목차
제1장 서론
제2장 조사 방법
제3장 주요 요약
제4장 시장 구도
제5장 시장 규모와 성장 예측
제6장 경쟁 구도
제7장 시장 기회와 향후 전망
LSH 26.03.03Singapore Renewable Energy Market size in 2026 is estimated at 1.93 gigawatt, growing from 2025 value of 1.68 gigawatt with 2031 projections showing 3.86 gigawatt, growing at 14.86% CAGR over 2026-2031.

Rising corporate demand for clean electricity, stringent net-zero rules, and region-wide power import plans are accelerating investment. Solar keeps its dominant role because rooftop, floating, and near-shore deployments are the most space-efficient options in a city-state with only 728 sq km of land. The roll-out of Southeast Asia's largest 285 MWh battery system, together with a solar forecasting model funded by SGD 6.2 million in R&D grants, shows how grid operators are tackling intermittency. Regional import targets of 6 GW by 2035 add supply diversity while anchoring Singapore's position as a cross-border clean-power hub. Intensifying sustainability mandates in the fast-growing data-center cluster further lifts long-term electricity offtake certainty for project developers.
Singapore Renewable Energy Market Trends and Insights
Net-zero 2050 & Green Plan 2030 targets intensifying renewable build-out
Singapore's legally binding net-zero target for 2050 and its updated goal of 45-50 million tCO2e by 2035 create an unambiguous demand signal. A USD 1 billion hydrogen-ready power plant with carbon-capture features reached final investment decision right after the February 2025 policy update. New generation units must now be at least 30% hydrogen-ready, forcing technology upgrades that favor renewable hybrids. The Energy Market Authority (EMA) has embedded emissions-based bidding criteria into its electricity market, tightening the cost of carbon-intensive output. Clear accountability mechanisms from the National Climate Change Secretariat have moved renewables from an optional efficiency gain to a compliance necessity. Long lead-time assets, such as floating solar or utility-scale storage, therefore secure faster permitting and cheaper green financing in the Singapore renewable energy market.
Declining solar-PV CAPEX amid high rooftop irradiance
Capital costs for Tier-1 modules fell another 7% between 2024 and 2025, intersecting with Singapore's steady 1,700 kWh/m2 annual irradiance to sharpen project economics. The government refrains from feed-in tariffs; instead, simplified credit schemes let owners sell excess power without bureaucratic delay. Private sector players delivered 63.5% of new capacity in 2024, proving that pure cost competitiveness now drives uptake. Solar forecasting linked to advanced weather analytics has trimmed balancing charges, lifting internal rates of return. With rooftop leases structured around 15- to 20-year payback horizons, commercial landlords increasingly treat photovoltaics as a core infrastructure upgrade rather than an ESG add-on in the Singapore renewable energy market.
Severe land scarcity for utility-scale assets
Only 23% of Singapore's surface is zoned for industrial or infrastructure use, constraining ground-mount projects. Developers request longer land-lease tenures to match 25-year asset lives, but state agencies often grant parcels for 15 years or less. The UNFCCC label of "alternative-energy-disadvantaged" underscores structural limits. Innovations such as vertical bifacial arrays on building facades and car-park canopy systems squeeze power into overlooked surfaces, yet aggregate contribution remains modest. Therefore, policy pivots to regional imports and floating solar maintains growth momentum in the Singapore renewable energy market.
Other drivers and restraints analyzed in the detailed report include:
- Corporate sustainability pledges pushing onsite solar PPAs
- Rapid roll-out of floating PV on inland reservoirs
- Intermittency & grid-stability challenges in a dense network
For complete list of drivers and restraints, kindly check the Table Of Contents.
Segment Analysis
Solar supplied 83.65% of 2025 capacity and is tracking a 15.38% CAGR to 2031, cementing its role as the backbone of the Singapore renewable energy market. Floating arrays on Tengeh, Bedok, and Pandan reservoirs alone unlock more than 200 MW that would otherwise require 150-200 ha of scarce land. Roof-mounted systems dominate industrial estates, leveraging 1,580 kWh/m2 irradiance and bifacial modules to deliver sub-grid pricing to factories and data centers. Wind remains marginal given 2-3 m/s average speeds and crowded coastal waters, while domestic hydropower is nonexistent due to flat topography. Waste-to-energy plants add 150 MW of bioenergy, capturing 3 M t of municipal waste and reducing landfill reliance. Geothermal and ocean energy sit in the research phase, hindered by low thermal gradients and minimal tidal ranges.
The Singapore renewable energy market share outside solar is therefore shaped by necessity rather than optional diversification. Hydropower imports from Laos supply 100 MW under a 25-year PPA; future links could arrive from Cambodia and Vietnam via the Low-Carbon Energy Imports Scheme. Building-integrated photovoltaics are gaining traction in marquee developments such as Marina Bay Sands, where facade-mounted systems meet Green Mark mandates. Collectively, non-solar technologies will retain a sub-20% share of installed capacity through 2031.
The Singapore Renewable Energy Market Report is Segmented by Technology (Solar Energy, Wind Energy, Hydropower, Bioenergy, Geothermal, and Ocean Energy) and End-User (Utilities, Commercial and Industrial, and Residential). The Market Sizes and Forecasts are Provided in Terms of Installed Capacity (GW).
List of Companies Covered in this Report:
- EDPR Sunseap
- Sembcorp Industries
- Keppel Renewable Energy
- Vena Energy
- ENGIE Southeast Asia
- TotalEnergies Distributed Generation SEA
- Cleantech Solar
- LYS Energy Group
- Terrenus Energy
- SP Group
- Solargy Pte Ltd
- SunPro Energies Pte Ltd
- REC Solar Holdings AS
- Keppel Seghers
- GreenYellow Singapore
- Blueleaf Energy
- Shell Energy Singapore
- JinkoSolar (Singapore)
- Trina Solar APAC
Additional Benefits:
- The market estimate (ME) sheet in Excel format
- 3 months of analyst support
TABLE OF CONTENTS
1 Introduction
- 1.1 Study Assumptions & Market Definition
- 1.2 Scope of the Study
2 Research Methodology
3 Executive Summary
4 Market Landscape
- 4.1 Market Overview
- 4.2 Market Drivers
- 4.2.1 Net-zero 2050 & Green Plan 2030 targets intensifying renewable build-out
- 4.2.2 Declining solar-PV CAPEX amid high rooftop irradiance
- 4.2.3 Corporate sustainability pledges pushing onsite solar PPAs
- 4.2.4 Rapid roll-out of floating PV on inland reservoirs
- 4.2.5 Agrivoltaic pilots unlocking dual-use of scarce land
- 4.2.6 Surge in REC demand from hyperscale data-centre boom
- 4.3 Market Restraints
- 4.3.1 Severe land scarcity for utility-scale assets
- 4.3.2 Intermittency & grid-stability challenges in a dense network
- 4.3.3 Competition from low-carbon power imports under LTMS-P
- 4.3.4 Limited biomass feedstock after waste-to-energy prioritisation
- 4.4 Supply-Chain Analysis
- 4.5 Regulatory Landscape (Government Policies & Regulations)
- 4.6 Technological Outlook
- 4.7 Porters Five Forces
- 4.7.1 Threat of New Entrants
- 4.7.2 Bargaining Power of Suppliers
- 4.7.3 Bargaining Power of Buyers
- 4.7.4 Threat of Substitutes
- 4.7.5 Industry Rivalry
- 4.8 PESTLE Analysis
5 Market Size & Growth Forecasts
- 5.1 By Technology
- 5.1.1 Solar Energy (PV and CSP)
- 5.1.2 Wind Energy (Onshore and Offshore)
- 5.1.3 Hydropower (Small, Large, PSH)
- 5.1.4 Bioenergy
- 5.1.5 Geothermal
- 5.1.6 Ocean Energy (Tidal and Wave)
- 5.2 By End-User
- 5.2.1 Utilities
- 5.2.2 Commercial and Industrial
- 5.2.3 Residential
6 Competitive Landscape
- 6.1 Market Concentration
- 6.2 Strategic Moves (M&A, JVs, Funding, PPAs)
- 6.3 Market Share Analysis (Market Rank/Share for key companies)
- 6.4 Company Profiles (includes Global-level Overview, Market-level Overview, Core Segments, Financials, Strategic Information, Products & Services, Recent Developments)
- 6.4.1 EDPR Sunseap
- 6.4.2 Sembcorp Industries
- 6.4.3 Keppel Renewable Energy
- 6.4.4 Vena Energy
- 6.4.5 ENGIE Southeast Asia
- 6.4.6 TotalEnergies Distributed Generation SEA
- 6.4.7 Cleantech Solar
- 6.4.8 LYS Energy Group
- 6.4.9 Terrenus Energy
- 6.4.10 SP Group
- 6.4.11 Solargy Pte Ltd
- 6.4.12 SunPro Energies Pte Ltd
- 6.4.13 REC Solar Holdings AS
- 6.4.14 Keppel Seghers
- 6.4.15 GreenYellow Singapore
- 6.4.16 Blueleaf Energy
- 6.4.17 Shell Energy Singapore
- 6.4.18 JinkoSolar (Singapore)
- 6.4.19 Trina Solar APAC
7 Market Opportunities & Future Outlook
- 7.1 White-space & Unmet-need Assessment
