
|
시장보고서
상품코드
1939055
통신 애널리틱스 : 시장 점유율 분석, 업계 동향과 통계, 성장 예측(2026-2031년)Telecom Analytics - Market Share Analysis, Industry Trends & Statistics, Growth Forecasts (2026 - 2031) |
||||||
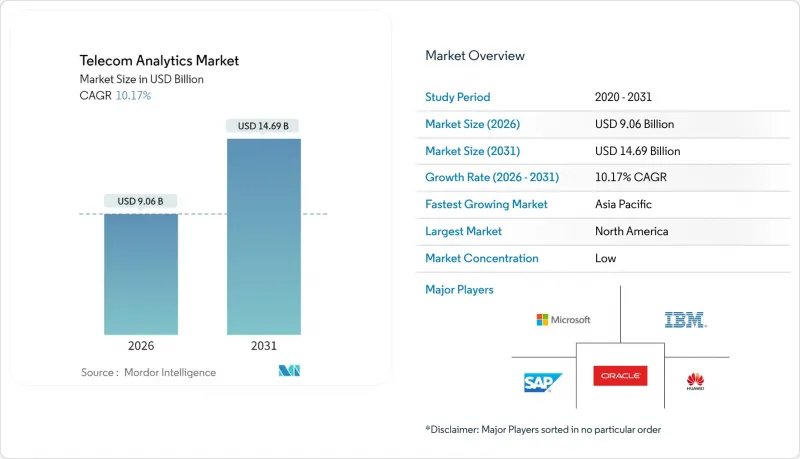
통신 애널리틱스 시장은 2025년에 82억 2,000만 달러로 평가되었으며, 2026년 90억 6,000만 달러에서 2031년까지 146억 9,000만 달러에 달할 것으로 예측됩니다.
예측 기간(2026-2031년) 동안 CAGR은 10.17%로 예상됩니다.
이러한 견고한 성장 궤적은 5G의 꾸준한 확산, 빠르게 성숙하고 있는 AI 툴킷, 그리고 증가하는 부정행위 비용에 의해 촉진되고 있으며, 이러한 요소들은 통신사업자들을 예측 및 실시간 분석으로 이끌고 있습니다. 클라우드 네이티브 아키텍처는 현재 대부분의 대규모 구축을 뒷받침하는 기반이 되고 있으며, 엣지 노드는 프라이빗 5G 및 대규모 IoT와 같은 지연에 민감한 사용 사례에서 중요한 역할을 담당하고 있습니다. 네트워크 벤더, 하이퍼스케일러, 틈새시장 전문업체들이 생성형 AI, 자동화된 모델 라이프사이클 관리, 슬라이스 지원 대시보드를 자사 제품에 통합하기 위한 경쟁이 치열해지고 있습니다. 동시에 통신사들은 자본 집약적인 소프트웨어 투자에서 측정 가능한 해지율 감소와 수익 보장을 약속하는 성과 기반 분석 서비스로 초점을 옮기고 있습니다.
세계 통신 애널리틱스 시장 동향 및 인사이트
5G의 급속한 확산으로 네트워크 분석 도입 촉진
독립형 5G의 확산으로 데이터 양과 성능 변수가 확대됨에 따라, 사업자들은 스펙트럼, 전력, 서비스 품질을 최적화하기 위해 실시간 슬라이스 분석 엔진을 도입해야 합니다. 중국은 2028년까지 5G 보급률이 88%에 달할 것으로 예상되며, 이 지역은 세계 최대의 단일 네트워크 텔레메트리 공급원으로 변모할 것입니다. 슬라이스별 대시보드는 기업 사용 사례에 대한 확정적인 지연 및 처리량을 보장함으로써 2,000억 달러 규모의 수익화 잠재력을 실현할 수 있습니다. 엣지 컴퓨팅 노드는 새로운 복잡성을 추가하고 있습니다. 텔레메트리가 여러 계층의 레이어에서 도달하기 때문에 각 레이어에서 밀리초 단위의 인사이트를 요구하기 때문입니다. 아시아태평양에서는 이러한 요구사항으로 인해 통신 애널리틱스 시장 채택이 연평균 13.26%의 CAGR로 성장하고 있으며, 국영 통신 사업자들이 인더스트리 4.0을 위한 초신뢰성 서비스를 제공하기 위해 경쟁하고 있습니다.
부정행위에 대한 취약성 증가
2024년 통신사기로 인한 손실은 398억 9,000만 달러에 달할 것으로 예상되며, 이는 전 세계 통신사 매출의 2.22%에 해당합니다. 사기 그룹은 현재 AI를 무기화하여 SIM 스왑, 계약, 로밍 악용을 자동화하고 있으며, 기존 규칙 엔진의 한계를 드러내고 있습니다. 이에 통신사들은 CDR(통화 상세 기록), 시그널링 데이터, 고객 프로파일을 거의 실시간으로 융합하는 그래프 기반 분석 기술과 자가 학습형 이상 징후 감지 시스템으로 전환을 추진하고 있습니다. 신흥 시장에서는 가입자 수의 급격한 증가가 부정사용 방지 투자를 능가하기 때문에 부정사용 방지 분석이 조달 계획의 최우선 순위가 되고 있습니다. 업계 조사에 따르면, 데이터 라벨링의 과제는 여전히 남아 있으며, 부정 방지 팀의 83%는 2025년까지 생성형 AI를 도입할 계획인 것으로 나타났습니다.
데이터 프라이버시 및 국경 간 전송 제한
데이터 보호 규정의 그물망이 좁아짐에 따라 세계 분석 기반이 분열되고 있습니다. GDPR, 인도의 디지털 개인정보 보호법, 중국의 개인정보보호법(PIPL)은 모두 현지 처리 의무를 부과하고 있으며, 사업자는 인프라 복제 및 프라이버시 바이 디자인 통제(Privacy by Design)의 내재화를 강요하고 있습니다. 다국적 CSP는 가입자 기록을 국경을 넘어 이동하기 전에 암호화, 토큰화 또는 익명화를 수행해야 하는데, 이는 지연을 초래하고 모델의 정확성을 떨어뜨립니다. 컴플라이언스 부담이 가장 심각한 지역은 아시아태평양으로, 각 국가마다 다른 법률이 적용되기 때문에 시장별로 맞춤형 보안 설계도가 필요합니다.
부문 분석
부정 관리 분석은 2024년에 398억 9,000만 달러가 넘는 업계 손실을 배경으로 16.90%의 CAGR로 가장 빠르게 성장하는 부문이 될 것으로 분석됐습니다. 이 플랫폼은 그래프 분석과 딥러닝 엔진을 결합하여 몇 초 만에 의심스러운 통화 상세 기록과 로밍 패턴을 식별합니다. 사업자는 수익 유출이 발생하기 전에 부정 트래픽을 동결할 수 있습니다. 그러나 통신 애널리틱스 시장에서 고객 분석은 2025년 기준 36.24%의 점유율을 차지하며 선두를 유지하고 있습니다. 이는 통신사들이 개인화된 고객 유지 캠페인, 해지 예측 모델, 평생 가치 평가(Lifetime Value Scoring)를 강화하고 있기 때문입니다.
네트워크 분석은 자율적인 슬라이스 오케스트레이션을 지원하고, KPI 예측 값을 폐루프 제어 장치에 제공하여 혼잡을 방지하고 5G 경험의 일관성을 향상시킵니다. 서비스 품질 및 경험 분석은 통신사들이 실시간 경험 점수를 기업용 대시보드에 공개하는 움직임과 함께 존재감을 높이고 있으며, 이는 제조업, 광업, 의료 분야에서 SLA 수익화의 가정이 되고 있습니다. 마케팅 및 영업 분석은 트렌드 모델링을 적용하여 캠페인 ROI를 향상시키고, 가격 책정 및 수익 관리 분석은 요금 번들 및 동적 할인을 최적화합니다. 애플리케이션 계층 도구는 종합적으로 크로스 도메인 가시성을 촉진하고, 제로 터치 운영에 필수적인 기반을 구축합니다.
엣지 및 하이브리드 구성은 10밀리초 미만의 인사이트 루프를 요구하는 미션 크리티컬한 수직 산업(항만, 공장, 유틸리티)으로 인해 21.92%의 CAGR을 기록했습니다. 현재 통신사들은 베이스밴드 유닛이나 온프레미스 엣지 노드에 경량 추론 엔진을 내장하고 지연 예산과 데이터 주권 규칙을 적용하고 있습니다. 2025년에도 클라우드 모델은 CPU 부하가 높은 트레이닝 작업과 장기 주기의 배치 분석을 호스팅함으로써 통신 애널리틱스 시장의 65.45%를 차지할 것으로 예상됩니다.
클라우드 버스트는 가변적인 워크로드를 처리하고, 엣지 사이트는 이상 경보와 같은 확정적인 작업을 수행하는 등 두 가지의 장점을 결합한 하이브리드 설계입니다. 온프레미스 구축은 규제가 심한 지역이나 레거시 BSS/OSS 시스템 마이그레이션이 어려운 지역에서 계속될 것입니다. 5G 어드밴스드 및 6G 로드맵이 구체화되는 가운데, 벤더들은 멀티 클러스터 모니터링 기능, 페더레이션 ID, 자동화된 정책 배포를 배포 템플릿에 통합하여 컴퓨팅 영역 간 전환을 용이하게 하고 있습니다.
지역별 분석
북미는 2025년 34.55%의 점유율로 통신 애널리틱스 시장을 주도할 것으로 예상되며, 초기 5G 수익화 및 기업용 사설망 수요에 힘입어 북미가 주도할 것으로 보입니다. 미국 통신사들은 2027년까지 37억 달러가 넘을 것으로 예상되는 민간 5G 투자를 활용하여 제조, 의료, 국방 분야에 대한 서비스형 네트워크(Network-as-a-Service) 제공을 분석적으로 조정하고 있습니다. T-Mobile의 광섬유 인수 등 통합 움직임도 고정 통신과 이동 통신의 품질 지표를 통합하기 위한 애널리틱스 투자를 촉진하고 있습니다.
아시아태평양은 13.06%의 CAGR로 가장 빠르게 성장하고 있으며, 중국의 적극적인 전개 로드맵과 인도의 급속한 디지털화가 주도하고 있습니다. 이 지역의 모바일 서비스 매출은 2023년 3,219억 달러에서 2028년 3,887억 달러로 증가할 것으로 예상되며, 이 트래픽을 수익으로 전환하기 위해서는 분석 기술이 필수적입니다. 각국 정부가 자국 개발 AI 프레임워크를 추진하는 가운데, 통신사들은 원시 데이터를 로컬로 유지하면서 모델 가중치를 전 세계적으로 공유하는 연합 학습 모델을 채택해야 하는 상황에 직면해 있습니다.
유럽에서는 GDPR이 프라이버시 강화 기술 및 하이브리드 구축에 대한 수요를 견인하며 꾸준한 성장세를 유지하고 있습니다. 통신사들은 감사 가능성과 실시간 침해 탐지 기능을 요구하고 있으며, 이에 따라 분석 벤더들은 동의 관리와 데이터 계보 추적 기능의 통합을 추진하고 있습니다.
중동, 아프리카 및 남미는 절대적인 규모에서는 뒤쳐져 있지만, 신규 5G 도입이 레거시 OSS를 우회하여 클라우드 네이티브 분석 스택으로 직접 전환하는 점에서 성장 여지를 보여주고 있습니다.
기타 특전:
- 엑셀 형식의 시장 예측(ME) 시트
- 애널리스트 지원(3개월)
자주 묻는 질문
목차
제1장 소개
제2장 조사 방법
제3장 주요 요약
제4장 시장 구도
제5장 시장 규모와 성장 예측
제6장 경쟁 구도
제7장 시장 기회와 향후 전망
KSM 26.03.09The telecom analytics market was valued at USD 8.22 billion in 2025 and estimated to grow from USD 9.06 billion in 2026 to reach USD 14.69 billion by 2031, at a CAGR of 10.17% during the forecast period (2026-2031).

This robust trajectory is propelled by relentless 5G roll-outs, fast-maturing AI toolkits, and the rising cost of fraud, each of which is nudging operators toward predictive, real-time analytics. Cloud-native architectures now underpin most large deployments, while edge nodes are assuming a pivotal role in latency-sensitive use cases such as private 5G and massive IoT. Competition is intensifying as network vendors, hyperscalers, and niche specialists race to embed generative AI, automated model lifecycle management, and slice-aware dashboards into their offers. At the same time, operators are shifting focus from capital-intensive software investments to outcome-based analytics services that guarantee measurable churn reduction and revenue assurance
Global Telecom Analytics Market Trends and Insights
Rapid 5G Deployment Spurring Network Analytics Adoption
Standalone 5G roll-outs are magnifying data volumes and performance variables, compelling operators to adopt real-time slice-aware analytics engines that optimize spectrum, power, and quality of service. China is on track for 88% 5G penetration by 2028, turning the region into the largest single source of network telemetry. Slice-specific dashboards unlock a USD 200 billion monetization pool by guaranteeing deterministic latency and throughput for enterprise use cases. Edge compute nodes add fresh complexity because telemetry now arrives from multiple hierarchy layers, each demanding millisecond-level insight. In Asia-Pacific, these requirements underpin a 13.26% CAGR in Telecom Analytics market adoption as state-owned carriers race to deliver ultra-reliable services for Industry 4.0.
Increasing Vulnerability to Fraudulent Activities
Telecom fraud losses ballooned to USD 39.89 billion in 2024, equivalent to 2.22% of global operator revenue . Fraud rings now weaponize AI to automate SIM-swap, subscription, and roaming exploits, exhausting the cAsia Pacificity of legacy rule engines. Operators therefore pivot to graph-based analytics and self-learning anomaly detectors that fuse CDRs, signaling data, and customer profiles in near real time. Emerging markets bear the brunt because rapid subscriber growth outpaces fraud-mitigation investment, pushing fraud-centric analytics to the top of procurement roadmaps. A recent industry poll shows 83% of fraud teams intend to deploy generative AI by 2025, even though poor data labeling remains a hurdle.
Data Privacy and Cross-Border Transfer Restrictions
A tightening web of data-protection rules is splintering global analytics footprints. GDPR, India's Digital Personal Data Protection Act, and China's PIPL each impose local-processing mandates that force operators to duplicate infrastructure and embed privacy-by-design controls. Multinational CSPs must encrypt, tokenize, or anonymize subscriber records before moving them across borders, adding latency and diluting model accuracy. The compliance burden is most acute in Asia Pacific, where divergent national laws require bespoke security blueprints for every market.
Other drivers and restraints analyzed in the detailed report include:
- AI-Driven Zero-Touch Operations Creating Closed-Loop Analytics Demand
- Accelerated Adoption of Cloud-Native Analytics by Telcos
- Scarcity of Telco-Specific Labeled Datasets for AI Models
For complete list of drivers and restraints, kindly check the Table Of Contents.
Segment Analysis
Fraud Management Analytics has become the fastest-expanding segment, growing at a 16.90% CAGR on the back of industry losses that exceeded USD 39.89 billion in 2024. These platforms blend graph analytics and deep-learning engines to pinpoint suspicious call-detail records and roaming patterns within seconds, enabling operators to freeze illicit traffic before revenue leakage occurs. Customer Analytics nevertheless retains leadership with 36.24% of the Telecom Analytics market in 2025 as carriers intensify personalized retention campaigns, churn-prediction models, and lifetime-value scoring.
Network Analytics underpins autonomous slice orchestration, feeding closed-loop controllers with KPI forecasts that avert congestion and improve 5G experience consistency. Service-Quality and Experience Analytics is gaining ground as operators publish real-time experience scores to enterprise dashboards, a prerequisite for monetizing SLAs in manufacturing, mining, and healthcare. Marketing and Sales Analytics applies propensity modeling to boost campaign ROI, while Pricing and Revenue-Management Analytics optimizes tariff bundling and dynamic discounting. Collectively, application-layer tools propel cross-domain visibility, a prerequisite for zero-touch operations.
Edge and hybrid configurations are registering a 21.92% CAGR due to mission-critical verticals ports, factories, and utilities demanding sub-10 millisecond insight loops. Operators now embed lightweight inference engines at base-band units and on-prem edge nodes to enforce latency budgets and data-sovereignty rules. The cloud model still controlled 65.45% of the Telecom Analytics market in 2025 by hosting CPU-hungry training jobs and long-cycle batch analytics.
Hybrid blueprints marry the two worlds: cloud bursting handles volatile workloads, while edge sites execute deterministic tasks like anomaly alarms. On-prem deployments persist in heavily regulated jurisdictions or where legacy BSS/OSS systems resist migration. As 5G Advanced and 6G roadmaps unfold, vendors are baking multi-cluster observability, federated identity, and automated policy rollout into deployment templates, making it easier to pivot between compute domains.
The Telecom Analytics Market Report is Segmented by Application (Customer, Network Analytics, and More), Deployment (Cloud and More), Component (Software, Services), End-User Enterprise Size (Small and Medium Enterprises, Large Enterprises), Telecom Operator Type (Mobile Network Operators, Fixed-Line Operators, and More), and Geography (North America, Europe, and More). The Market Forecasts are Provided in Terms of Value (USD).
Geography Analysis
North America dominated the Telecom Analytics market with 34.55% share in 2025, buoyed by early 5G monetization and enterprise-grade private-network demand. The U.S. carriers are leveraging analytics to orchestrate network-as-a-service offers for manufacturing, healthcare, and defense, capitalizing on a private-5G spend that will surpass USD 3.7 billion by 2027. Consolidation moves such as T-Mobile's fiber acquisitions are also stoking analytics investment to integrate fixed and mobile quality metrics.
Asia-Pacific is the fastest-growing region at 13.06% CAGR, led by China's aggressive deployment roadmap and India's rapid digitalization. The region's mobile-services revenue could climb from USD 321.9 billion in 2023 to USD 388.7 billion in 2028, and analytics is crucial for converting that traffic into profit. Governments are championing indigenous AI frameworks, prompting operators to adopt federated-learning models that keep raw data local while sharing model weights globally.
Europe maintains steady expansion as GDPR drives demand for privacy-enhancing technologies and hybrid deployments. Operators must demonstrate auditability and real-time breach detection, pushing analytics vendors to incorporate consent management and lineage tracking.
Middle East and Africa and South America trail in absolute size but show upside as green-field 5G launches bypass legacy OSS and leapfrog directly to cloud-native analytics stacks.
- Accenture plc
- Amdocs Inc.
- Cisco Systems, Inc.
- Dell Inc.
- Ericsson AB
- Guavus, Inc.
- Huawei Technologies Co., Ltd.
- IBM Corporation
- InfoFaces, Inc.
- Microsoft Corporation
- Nokia Corporation
- Oracle Corporation
- SAS Institute Inc.
- SAP SE
- Subex Limited
- TEOCO Corporation
- Teradata Corporation
- Wipro Limited
- ZTE Corporation
- Mu Sigma, Inc.
Additional Benefits:
- The market estimate (ME) sheet in Excel format
- 3 months of analyst support
TABLE OF CONTENTS
1 INTRODUCTION
- 1.1 Study Assumptions and Market Definition
- 1.2 Scope of the Study
2 RESEARCH METHODOLOGY
3 EXECUTIVE SUMMARY
4 MARKET LANDSCAPE
- 4.1 Market Overview
- 4.2 Market Drivers
- 4.2.1 Surge in need for churn reduction
- 4.2.2 Increasing vulnerability to fraudulent activities
- 4.2.3 Rapid 5G deployment spurring network analytics adoption
- 4.2.4 Accelerated adoption of cloud-native analytics by telcos
- 4.2.5 Emergence of network slicing analytics for private 5G networks
- 4.2.6 AI-driven zero-touch operations creating closed-loop analytics demand
- 4.3 Market Restraints
- 4.3.1 Lack of awareness among telecom operators
- 4.3.2 Data privacy and cross-border transfer restrictions
- 4.3.3 OPEX strain from spectrum auctions curbing on-prem investments
- 4.3.4 Scarcity of telco-specific labelled datasets for AI models
- 4.4 Industry Value-Chain Analysis
- 4.5 Regulatory Landscape
- 4.6 Technological Outlook
- 4.7 Porter's Five Forces Analysis
- 4.7.1 Threat of New Entrants
- 4.7.2 Bargaining Power of Buyers
- 4.7.3 Bargaining Power of Suppliers
- 4.7.4 Threat of Substitutes
- 4.7.5 Competitive Rivalry
- 4.8 Pandemic Impact Review
5 MARKET SIZE AND GROWTH FORECASTS (VALUE)
- 5.1 By Application
- 5.1.1 Customer Analytics
- 5.1.2 Network Analytics
- 5.1.3 Marketing and Sales Analytics
- 5.1.4 Pricing and Revenue-Management Analytics
- 5.1.5 Service Quality and Experience Analytics
- 5.1.6 Fraud Management Analytics
- 5.1.7 Other Application
- 5.2 By Deployment
- 5.2.1 Cloud
- 5.2.2 On-premises
- 5.2.3 Edge / Hybrid
- 5.3 By Component
- 5.3.1 Software
- 5.3.2 Services
- 5.3.2.1 Professional Services
- 5.3.2.2 Managed Services
- 5.4 By End-User Enterprise Size
- 5.4.1 Small and Medium Enterprises (SMEs)
- 5.4.2 Large Enterprises
- 5.5 By Telecom Operator Type
- 5.5.1 Mobile Network Operators (MNOs)
- 5.5.2 Fixed-line Operators
- 5.5.3 Internet Service Providers (ISPs)
- 5.5.4 Mobile Virtual Network Operators (MVNOs)
- 5.5.5 Converged Operators
- 5.6 By Geography
- 5.6.1 North America
- 5.6.1.1 United States
- 5.6.1.2 Canada
- 5.6.1.3 Mexico
- 5.6.2 South America
- 5.6.2.1 Brazil
- 5.6.2.2 Argentina
- 5.6.2.3 Colombia
- 5.6.2.4 Rest of South America
- 5.6.3 Europe
- 5.6.3.1 United Kingdom
- 5.6.3.2 Germany
- 5.6.3.3 France
- 5.6.3.4 Spain
- 5.6.3.5 Italy
- 5.6.3.6 Russia
- 5.6.3.7 Rest of Europe
- 5.6.4 Asia Pacific
- 5.6.4.1 China
- 5.6.4.2 India
- 5.6.4.3 Japan
- 5.6.4.4 South Korea
- 5.6.4.5 Australia
- 5.6.4.6 Southeast Asia
- 5.6.4.7 Rest of Asia Pacific
- 5.6.5 Middle East and Africa
- 5.6.5.1 Middle East
- 5.6.5.1.1 Saudi Arabia
- 5.6.5.1.2 United Arab Emirates
- 5.6.5.1.3 Turkey
- 5.6.5.1.4 Rest of Middle East
- 5.6.5.2 Africa
- 5.6.5.2.1 South Africa
- 5.6.5.2.2 Nigeria
- 5.6.5.2.3 Kenya
- 5.6.5.2.4 Rest of Africa
- 5.6.5.1 Middle East
- 5.6.1 North America
6 COMPETITIVE LANDSCAPE
- 6.1 Market Concentration
- 6.2 Strategic Moves
- 6.3 Market Share Analysis
- 6.4 Company Profiles {(includes Global level Overview, Market level overview, Core Segments, Financials as available, Strategic Information, Market Rank/Share for key companies, Products and Services, and Recent Developments)}
- 6.4.1 Accenture plc
- 6.4.2 Amdocs Inc.
- 6.4.3 Cisco Systems, Inc.
- 6.4.4 Dell Inc.
- 6.4.5 Ericsson AB
- 6.4.6 Guavus, Inc.
- 6.4.7 Huawei Technologies Co., Ltd.
- 6.4.8 IBM Corporation
- 6.4.9 InfoFaces, Inc.
- 6.4.10 Microsoft Corporation
- 6.4.11 Nokia Corporation
- 6.4.12 Oracle Corporation
- 6.4.13 SAS Institute Inc.
- 6.4.14 SAP SE
- 6.4.15 Subex Limited
- 6.4.16 TEOCO Corporation
- 6.4.17 Teradata Corporation
- 6.4.18 Wipro Limited
- 6.4.19 ZTE Corporation
- 6.4.20 Mu Sigma, Inc.
7 MARKET OPPORTUNITIES AND FUTURE OUTLOOK
- 7.1 White-space and Unmet-need Assessment