
|
시장보고서
상품코드
1939145
바이오 비료 : 시장 점유율 분석, 업계 동향과 통계, 성장 예측(2026-2031년)Biofertilizers - Market Share Analysis, Industry Trends & Statistics, Growth Forecasts (2026 - 2031) |
||||||
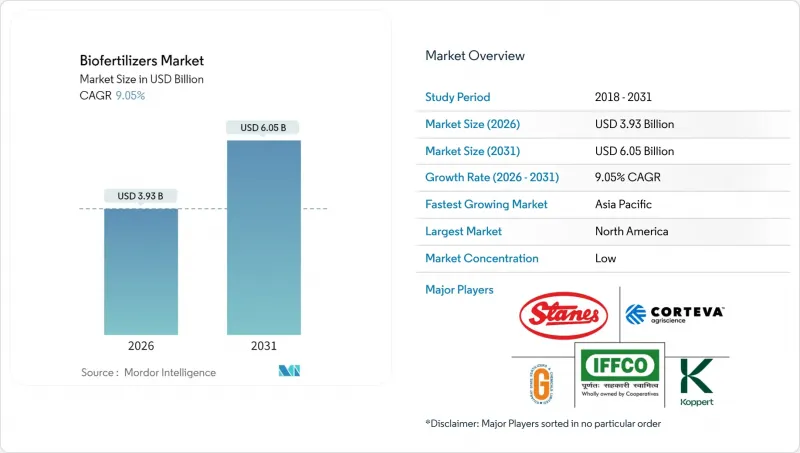
바이오 비료 시장은 2025년 36억 달러에서 2026년에는 39억 3,000만 달러로 성장하며, 2026-2031년에 CAGR 9.05%로 추이하며, 2031년까지 60억 5,000만 달러에 달할 것으로 예측됩니다.
지속가능한 농업의 강력한 추진력, 환경 규제 강화, 유기농 인증 농산물의 프리미엄 가격 책정 등이 수요를 촉진하고 있습니다. 북미는 2024년 바이오 비료 시장 점유율 36.2%로 현재 매출을 주도하고 있으며, 이는 성숙한 유기농 인증 제도와 정부의 비용 분담 프로그램을 반영하고 있습니다. 성장 측면에서는 아시아태평양이 주도적인 역할을 하고 있으며, 인도와 중국의 국가 보조금 제도와 합성 재료에서 생물학적 재료로 전환하는 광활한 지역이 성장을 주도하고 있습니다. 모든 지역에서 탄소배출권 현금화, 정밀 적용 툴, 복합 미생물 컨소시엄은 공급업체와 생산자 모두에게 이익의 원천을 확대하고 있습니다. 농자재 대기업과 지역 전문업체 간의 통합은 기술 보급을 더욱 가속화하는 동시에 경쟁의 경계를 재구축하고 있습니다.
세계 바이오 비료 시장 동향과 인사이트
유기농 식품으로의 소비자 이동이 프리미엄 시장 확대를 견인
유기농 식품 매출은 2024년 1,340억 달러에 달하고, 전년 대비 15.2% 성장할 것으로 예측됩니다. 인증 받은 농산물은 20-40%의 가격 프리미엄을 받고 있습니다. 소매업체들은 현재 생물학적 투입물에 대한 검증된 기록이 있어야만 진열대에 진열할 수 있도록 요구하고 있으며, 생산자들은 이를 준수하기 위해 바이오 비료 시장 솔루션을 도입하고 있습니다. 유럽은 1인당 유기농 소비량이 가장 높으며, 독일과 네덜란드는 안정적인 수요가 지속되고 있습니다. 기존 유기농 틈새 시장 외의 브랜드 소유주들도 약속한 지속가능성을 충족하기 위해 생물학적 투입물을 채택하고, 대상 경작 면적을 확대하고 있습니다. 이러한 수렴의 역학은 공급업체의 매출 전망을 개선하고 바이오 비료 시장의 장기적인 확장 전망을 강화합니다.
정부 보조금을 통한 도입 경제성 향상
미국 농무부(USDA)는 2024년 환경 품질 장려 프로그램(EQIP)에 따라 3억 달러를 책정하고, 대상 바이오 비료 비용의 최대 75%를 상환합니다. 인도 화학비료부도 같은 해 410억 루피(5억 달러) 규모의 촉진 계획을 시작했습니다. 유럽연합(EU)은 검증된 생물학적 투입물을 장려하는 에코 스킴을 통해 연간 81억 유로(87억 달러)를 배분하고 있습니다. 브라질은 국가 생물학적 투입물 프로그램에 따라 미생물 제조 설비에 대한 면세 혜택을 제공합니다. 이러한 우대 조치로 인해 생산자의 투자 회수 기간이 단축되어 바이오 비료 시장의 두 자릿수 성장을 가속하고 있습니다.
콜드체인 인프라의 제약이 시장 진입을 가로막고 있습니다.
바이오 비료는 2℃에서 8℃ 범위에서 보관해야 하며, 상온에서는 한 달마다 생존율이 15-30% 감소합니다. 개발도상국의 40%는 적절한 냉장시설이 부족하여 유통비용을 최대 4배까지 끌어올리고 있습니다. 물류 장벽은 소매 유통을 약화시키고, 소규모 유통업체가 살아있는 미생물 제품을 재고로 보유하는 것을 방해하고 있습니다. 동결건조 및 인캡슐레이션 기술을 통해 보존기간을 거의 2년까지 연장할 수 있지만, 생산비용이 35-50% 증가합니다. 기존 콜드체인 인프라의 부족이 효과적으로 해소될 때까지 이 문제는 바이오 비료 시장의 성장 잠재력을 계속 저해할 것입니다.
부문 분석
2025년 기준, 균근균 제품은 바이오 비료 시장 점유율의 35.74%를 차지했습니다. 어바스큘러 균근균은 옥수수, 콩, 채소밭에서 20-35% 높은 인 흡수를 실현합니다. 뿌리혹균 제제는 질소 고정을 통해 헥타르당 최대 60kg의 합성 비료 필요량을 줄일 수 있으며, 2026-2031년 연평균 10.25%의 연평균 복합 성장률(CAGR)로 향후 성장을 촉진할 것으로 예측됩니다. 미국 환경보호청(EPA)의 승인 건수 증가로 입증된 2종 혼합균에 대한 관심 증가는 부가가치 확대를 촉진하고 있습니다. 다균주 조사는 작물의 내성을 강화하고 작물 재배 면적을 확대하기 위해 CAGR 예측을 지원하고 바이오 비료 시장의 일부에 새로운 자본을 끌어들이고 있습니다.
발효 기술에 대한 지속적인 투자와 정밀한 운반체 재료의 조합으로 저장 안정성과 밭에서의 균일성을 향상시켰습니다. 농학 자문과 제품 공급을 통합하는 공급업체는 대규모 생산자와 협동조합의 지지를 얻고 있습니다. 상세한 적용 데이터는 차세대 연구개발을 이끌고 토양 프로파일에 맞는 맞춤형 접종제 패키지 개발을 촉진하고 있습니다. 이러한 발전으로 인해 평균 판매 가격이 상승하여 균근 및 관련 컨소시엄 제품에서 바이오 비료 시장 규모의 경쟁 우위를 더욱 강화했습니다.
본 바이오 비료 시장 보고서는 형태별(아조스피리람, 아조토박터, 균근, 인산용해성균, 근권균 등), 작물 유형별(환금작물, 원예작물 등), 지역별(아프리카, 아시아태평양, 유럽, 중동, 북미 등)로 분류되어 있습니다. 시장 예측은 금액(USD) 및 수량(미터톤)으로 제공됩니다.
지역별 분석
2025년 기준 북미는 바이오 비료 시장의 35.62%를 차지할 것으로 예상되며, 미국이 지역 수요를 충족시키기 위해 큰 비중을 차지할 것으로 보입니다. 연방 정부의 인센티브, 성숙한 콜드체인, 탄탄한 보급 서비스가 지속적인 물량 성장을 지원하고 있습니다. 캐나다는 카놀라, 밀을 중심으로 한 프레리 지역에서의 도입이 이어지고 있으며, 멕시코는 수출 지향적인 원예 재배를 위해 유기농 인증을 활용하고 있습니다. 높은 연구개발 강도, 강력한 유통망, 광범위한 디지털 농업 플랫폼으로 북미는 바이오 비료 시장에서 첨단 접종제 기술 개발의 거점이 되고 있습니다.
아시아태평양은 가장 빠르게 성장하는 지역으로 2031년까지 연평균 복합 성장률(CAGR) 9.74%를 나타낼 것으로 예측됩니다. 인도는 410억 루피의 보조금 제도를 통해 연간 4,500만 명의 농가에 미생물 자재를 보급하며 성장을 촉진하고 있습니다. 중국은 2025년 4억 3,850만 달러 규모를 예상하고 있으며, 지역 실증포장을 기반으로 화학비료 20% 감축을 추진 중입니다. 일본과 호주는 고정밀 시비 시스템에 투자하고, 베트남과 인도네시아는 논과 팜 농장에 바이오 비료를 도입하고 있습니다. 농촌지역 냉장시설과 국영 보급센터 확충으로 도입 장벽을 낮추고, 세계 바이오비료 시장 규모에 대한 지역 기여도를 높이고 있습니다.
유럽은 EU의 '농장에서 식탁까지' 목표와 공동농업정책의 환경지불제도에 힘입어 금액 기준으로 2위를 차지합니다. 독일이 지역 매출의 23%를 차지하며 1위, 프랑스, 이탈리아가 그 뒤를 이었습니다. 브렉시트 이후 영국은 환경 토지 관리 비용을 생물학적 자재 도입에 사용하고 있습니다. 동유럽의 현대화 프로그램은 두 자릿수 성장률로 수요를 확대하고 있습니다. 남미, 주로 브라질과 아르헨티나는 대규모 콩 순환 재배를 활용하여 질소 고정 접종제를 통합하여 바이오 비료 시장의 지역적 범위를 확장하고 있습니다.
기타 특전:
- 엑셀 형식 시장 예측(ME) 시트
- 애널리스트의 3개월간 지원
자주 묻는 질문
목차
제1장 서론
제2장 개요 및 주요 조사 결과
제3장 리포트 제공
제4장 주요 업계 동향
제5장 시장 규모와 성장 예측(금액 및 수량)
제6장 경쟁 구도
제7장 CEO에 대한 주요 전략적 질문
KSA 26.03.06The biofertilizers market is expected to grow from USD 3.60 billion in 2025 to USD 3.93 billion in 2026 and is forecast to reach USD 6.05 billion by 2031 at 9.05% CAGR over 2026-2031.

Strong momentum in sustainable farming, stricter environmental rules, and premium pricing for certified organic produce reinforce demand. North America leads current revenue with a 36.2% biofertilizers market share in 2024, reflecting mature organic certification systems and government cost-share programs. Asia-Pacific sets the pace on the growth front, propelled by national subsidy schemes in India and China and by large areas transitioning from synthetic to biological inputs. Across all regions, carbon-credit monetization, precision application tools, and bundled microbial consortia are widening profit pools for suppliers and growers alike. Consolidation among agricultural-input majors and local specialists further accelerates technology diffusion while reshaping competitive boundaries.
Global Biofertilizers Market Trends and Insights
Consumer Shift Toward Organic Food Drives Premium Market Expansion
Organic food sales reached USD 134 billion in 2024, posting 15.2% year-over-year growth, and certified produce commands 20-40% price premiums . Retailers now require verified biological input records for shelf space, prompting growers to embrace biofertilizers market solutions for compliance. Europe posts the highest per-capita organic consumption, reinforcing steady demand in Germany and the Netherlands. Brand owners outside traditional organic niches are adopting biological inputs to satisfy public sustainability pledges, thereby enlarging addressable hectares. These convergence dynamics elevate revenue visibility for suppliers and strengthen long-term expansion prospects for the biofertilizers market.
Government Subsidies Create Favorable Adoption Economics
The United States Department of Agriculture (USDA) earmarked USD 300 million in 2024 under the Environmental Quality Incentives Program to reimburse up to 75% of qualifying biofertilizer costs . India's Ministry of Chemicals and Fertilizers launched an INR 41 billion (USD 500 million) promotion scheme the same year. The European Union (EU) allocates EUR 8.1 billion (USD 8.7 billion) annually through eco-schemes that reward verified biological inputs . Brazil, under its National Program for Biological Inputs, offers tax holidays on microbial manufacturing equipment. These incentives narrow payback periods for growers and catalyze double-digit growth in the biofertilizers market.
Cold-Chain Infrastructure Limitations Constrain Market Access
Biofertilizers must remain between 2 °C and 8 °C, yet viability drops 15-30% monthly at ambient temperatures. Forty percent of developing nations lack adequate cold storage, raising distribution costs by up to four times. Logistics hurdles weaken retail availability and deter small distributors from stocking live microbial products. Freeze-dry and encapsulation methods extend shelf life to almost two years but raise production costs 35-50%. Until the existing cold-chain infrastructure gaps are effectively addressed, this challenge will continue to impede the growth potential of the biofertilizers market.
Other drivers and restraints analyzed in the detailed report include:
- Environmental Regulations Accelerate Synthetic Input Substitution
- Certified Organic Acreage Expansion Sustains Demand
- Performance Inconsistency Across Agricultural Systems
For complete list of drivers and restraints, kindly check the Table Of Contents.
Segment Analysis
Mycorrhiza products held 35.74% of the biofertilizers market share in 2025. Arbuscular mycorrhizal fungi deliver 20-35% higher phosphorus uptake across corn, soybean, and vegetable plots. Rhizobium formulations lead future expansion at 10.25% CAGR from 2026 to 2031 due to nitrogen fixation that trims synthetic needs by up to 60 kg per hectare. Growing interest in dual-organism blends, validated by the Environmental Protection Agency (EPA) in its rising approvals roster, drives incremental value. Multi-strain research strengthens crop resilience and broadens acreage, reinforcing CAGR forecasts and pulling fresh capital into this slice of the biofertilizers market.
Sustained investment in fermentation technology, coupled with precision carrier materials, is boosting shelf stability and field consistency. Suppliers that integrate agronomy advisory with product supply are earning loyalty among large growers and cooperatives. Granular application data guides next-generation R&D, encouraging custom inoculant packages that match soil profiles. These advances increase average selling prices and deepen the competitive moat around the biofertilizers market size for mycorrhiza and related consortia products.
The Biofertilizers Market Report is Segmented by Form (Azospirillum, Azotobacter, Mycorrhiza, Phosphate Solubilizing Bacteria, Rhizobium, and More), by Crop Type (Cash Crops, Horticultural Crops, and More), and by Geography (Africa, Asia-Pacific, Europe, Middle East, North America, and More). The Market Forecasts are Provided in Terms of Value (USD) and Volume (Metric Tons).
Geography Analysis
North America held a 35.62% share of the biofertilizers market in 2025, with the United States accounting for a significant portion to meet regional demand. Federal incentives, mature cold chains, and robust extension services underpin sustained volume growth. Canada follows with prairie-focused adoption in canola and wheat, while Mexico leverages organic certification for export-oriented horticulture. High research intensity, strong dealer networks, and widespread digital agronomy platforms make North America a launchpad for advanced inoculant technologies within the biofertilizers market.
Asia-Pacific stands out as the fastest-growing territory, advancing at a projected 9.74% CAGR to 2031. India anchors growth through its INR 41 billion subsidy scheme, distributing microbial inputs to 45 million farmers each year. China, representing USD 438.5 million in 2025, pursues a 20% synthetic-fertilizer cut, supported by regional demonstration plots. Japan and Australia invest in high-precision delivery systems, while Vietnam and Indonesia deploy biofertilizers across rice and palm plantations. Upgrades in rural cold storage and state-run extension clinics reduce adoption hurdles, enhancing regional contribution to the global biofertilizers market size.
Europe ranks second by value, buoyed by the European Union (EU) Farm to Fork target and Common Agricultural Policy eco-payments. Germany leads at 23% of regional revenue, followed by France and Italy. Post-Brexit, the United Kingdom channels Environmental Land Management payments into biological input adoption. Eastern European modernization programs are adding demand at double-digit rates. South America, chiefly Brazil and Argentina, leverages large-scale soybean rotations to integrate nitrogen-fixing inoculants, widening the geographic spread of the biofertilizers market.
- Gujarat State Fertilizers & Chemicals Ltd
- IPL Biologicals Limited
- Koppert Biological Systems Inc.
- Novonesis Group
- Rizobacter Argentina S.A. (Bioceres Crop Solutions)
- Symborg Inc. (Corteva Agriscience)
- Andermatt Group AG
- T. Stanes and Company Limited
- Atlantica Agricola
- Biostadt India Limited
- Kiwa Bio-Tech
- Lallemand Inc.
- Certis Biologicals (Mitsui & Co.)
- Indian Farmers Fertiliser Cooperative Limited
- Indogulf Company
- Bionema Ltd
- Binzhou Jingyang Biological Fertilizer Co. Ltd
- Sustane Natural Fertilizer Inc.
Additional Benefits:
- The market estimate (ME) sheet in Excel format
- 3 months of analyst support
TABLE OF CONTENTS
1 INTRODUCTION
- 1.1 Study Assumptions and Market Definition
- 1.2 Scope of the Study
- 1.3 Research Methodology
2 EXECUTIVE SUMMARY AND KEY FINDINGS
3 REPORT OFFERS
4 KEY INDUSTRY TRENDS
- 4.1 Area Under Organic Cultivation
- 4.2 Per Capita Spending On Organic Products
- 4.3 Regulatory Framework
- 4.3.1 Argentina
- 4.3.2 Australia
- 4.3.3 Brazil
- 4.3.4 Canada
- 4.3.5 China
- 4.3.6 Egypt
- 4.3.7 France
- 4.3.8 Germany
- 4.3.9 India
- 4.3.10 Indonesia
- 4.3.11 Iran
- 4.3.12 Italy
- 4.3.13 Japan
- 4.3.14 Mexico
- 4.3.15 Netherlands
- 4.3.16 Nigeria
- 4.3.17 Philippines
- 4.3.18 Russia
- 4.3.19 South Africa
- 4.3.20 Spain
- 4.3.21 Thailand
- 4.3.22 Turkey
- 4.3.23 United Kingdom
- 4.3.24 United States
- 4.3.25 Vietnam
- 4.4 Value Chain and Distribution Channel Analysis
- 4.5 Market Drivers
- 4.5.1 Consumer Shift Toward Organic Food Drives Premium Market Expansion
- 4.5.2 Government Subsidies Create Favorable Adoption Economics
- 4.5.3 Environmental Regulations Accelerate Synthetic Input Substitution
- 4.5.4 Certified Organic Acreage Expansion Sustains Demand
- 4.5.5 Carbon-Credit Monetization for Biofertilizer Use
- 4.5.6 Adoption of Microbial Consortia for Drought/Salinity Tolerance
- 4.6 Market Restraints
- 4.6.1 Cold-Chain Infrastructure Limitations Constrain Market Access
- 4.6.2 Performance Inconsistency Across Agricultural Systems
- 4.6.3 Rising Competition from Biostimulants and Nano-fertilizers
- 4.6.4 Patentability Hurdles for Novel Microbial Strains
5 MARKET SIZE AND GROWTH FORECASTS (VALUE AND VOLUME)
- 5.1 Form
- 5.1.1 Azospirillum
- 5.1.2 Azotobacter
- 5.1.3 Mycorrhiza
- 5.1.4 Phosphate Solubilizing Bacteria
- 5.1.5 Rhizobium
- 5.1.6 Other Biofertilizers
- 5.2 Crop Type
- 5.2.1 Cash Crops
- 5.2.2 Horticultural Crops
- 5.2.3 Row Crops
- 5.3 Geography
- 5.3.1 Africa
- 5.3.1.1 By Country
- 5.3.1.1.1 Egypt
- 5.3.1.1.2 Nigeria
- 5.3.1.1.3 South Africa
- 5.3.1.1.4 Rest of Africa
- 5.3.1.1 By Country
- 5.3.2 Asia-Pacific
- 5.3.2.1 By Country
- 5.3.2.1.1 Australia
- 5.3.2.1.2 China
- 5.3.2.1.3 India
- 5.3.2.1.4 Indonesia
- 5.3.2.1.5 Japan
- 5.3.2.1.6 Philippines
- 5.3.2.1.7 Thailand
- 5.3.2.1.8 Vietnam
- 5.3.2.1.9 Rest of Asia-Pacific
- 5.3.2.1 By Country
- 5.3.3 Europe
- 5.3.3.1 By Country
- 5.3.3.1.1 France
- 5.3.3.1.2 Germany
- 5.3.3.1.3 Italy
- 5.3.3.1.4 Netherlands
- 5.3.3.1.5 Russia
- 5.3.3.1.6 Spain
- 5.3.3.1.7 Turkey
- 5.3.3.1.8 United Kingdom
- 5.3.3.1.9 Rest of Europe
- 5.3.3.1 By Country
- 5.3.4 Middle East
- 5.3.4.1 By Country
- 5.3.4.1.1 Iran
- 5.3.4.1.2 Saudi Arabia
- 5.3.4.1.3 Rest of Middle East
- 5.3.4.1 By Country
- 5.3.5 North America
- 5.3.5.1 By Country
- 5.3.5.1.1 Canada
- 5.3.5.1.2 Mexico
- 5.3.5.1.3 United States
- 5.3.5.1.4 Rest of North America
- 5.3.5.1 By Country
- 5.3.6 South America
- 5.3.6.1 By Country
- 5.3.6.1.1 Argentina
- 5.3.6.1.2 Brazil
- 5.3.6.1.3 Rest of South America
- 5.3.6.1 By Country
- 5.3.1 Africa
6 COMPETITIVE LANDSCAPE
- 6.1 Key Strategic Moves
- 6.2 Market Share Analysis
- 6.3 Company Landscape
- 6.4 Company Profiles (Includes Global Level Overview, Market Level Overview, Core Segments, Financials as Available, Strategic Information, Market Rank/Share for Key Companies, Products and Services, and Recent Developments)
- 6.4.1 Gujarat State Fertilizers & Chemicals Ltd
- 6.4.2 IPL Biologicals Limited
- 6.4.3 Koppert Biological Systems Inc.
- 6.4.4 Novonesis Group
- 6.4.5 Rizobacter Argentina S.A. (Bioceres Crop Solutions)
- 6.4.6 Symborg Inc. (Corteva Agriscience)
- 6.4.7 Andermatt Group AG
- 6.4.8 T. Stanes and Company Limited
- 6.4.9 Atlantica Agricola
- 6.4.10 Biostadt India Limited
- 6.4.11 Kiwa Bio-Tech
- 6.4.12 Lallemand Inc.
- 6.4.13 Certis Biologicals (Mitsui & Co.)
- 6.4.14 Indian Farmers Fertiliser Cooperative Limited
- 6.4.15 Indogulf Company
- 6.4.16 Bionema Ltd
- 6.4.17 Binzhou Jingyang Biological Fertilizer Co. Ltd
- 6.4.18 Sustane Natural Fertilizer Inc.
