|
시장보고서
상품코드
2072902
님 기반 비료 시장 : 점유율 분석, 업계 동향과 통계, 성장 예측(2026-2031년)Neem-Based Fertilizer - Market Share Analysis, Industry Trends & Statistics, Growth Forecasts (2026 - 2031) |
||||||
 Mordor Intelligence
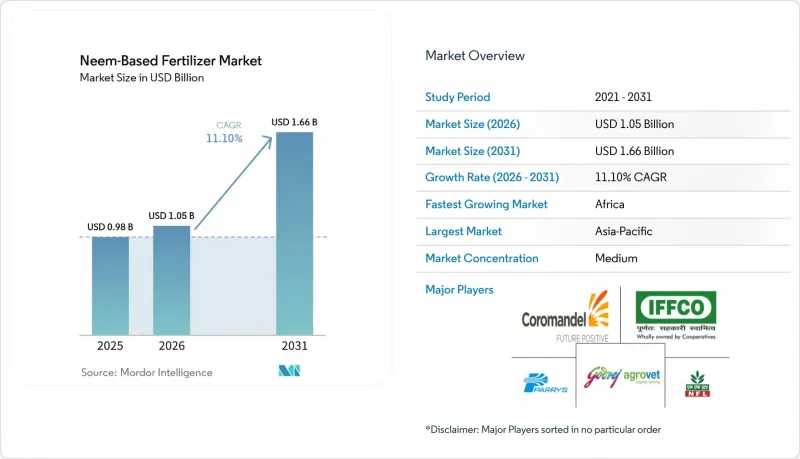
Mordor Intelligence에 의하면, 님 기반 비료 시장 규모는 2025년에 9억 8,000만 달러로 평가되었고 2026년 10억 5,000만 달러에서 2031년까지 16억 6,000만 달러로 확대되어 2026년부터 2031년까지 CAGR 11.1%를 나타낼 것으로 예측됩니다.
본 보고서는 제형(분말, 과립, 액체), 작물 유형(곡물, 유지종자·콩류, 기타), 시용 방법(토양 시용, 엽면 살포, 기타), 유통 채널(농가에 대한 직접 판매, 소매·유통업체 네트워크), 지역(북미, 남미, 유럽, 기타)별로 분류되어 있습니다. 시장 전망은 금액(달러) 기준으로 제시되어 있습니다.
전 세계 님 기반 비료 시장 동향 및 인사이트
보조 대상 질소 비료 중 니엠 코팅 요소에 대한 정부의 의무화 조치
인도 정부가 니임 코팅 요소의 보급을 중시하고 있는 점이, 비료 생산에 사용되는 니임 유래 농업 자재 수요를 견인하고 있습니다. 인도 정부 보도정보국(PIB)에 따르면, 님 코팅 요소는 토양 내 질소의 방출을 늦춤으로써 질소 이용 효율을 높입니다. 이를 통해 농가에서는 기존의 혼합 제품과 비교해 요소 사용량을 약 10% 줄이면서도 동등한 성과를 얻을 수 있게 됩니다. 보조 대상인 요소에 님 코팅을 의무화하는 정책은 현재도 계속되고 있으며, 비료 업계에서 님 기반 코팅 재료의 소비는 여전히 견조한 추세를 보이고 있습니다. 각 제조업체들이 농업 수요를 충족하기 위해 님 코팅 요소의 생산을 지속하는 가운데, 님 오일이나 아자지락틴을 포함한 님 기반 원자재에 대한 수요는 계속해서 견조할 것으로 예상되며, 이는 님 기반 비료 시장의 성장을 뒷받침할 것으로 전망됩니다.
고부가가치 원예 분야에서의 유기농 작물 보호제 수요 증가
고부가가치 과일 및 채소 생산자들은 수출 가격의 프리미엄화를 도모하기 위해 미국 농무부의 “국가 유기농 프로그램(NOP)” 및 유럽연합(EU)의 유기농 규정을 준수하는 님 기반 원료를 사용하고 있습니다. 생물 유래 비료는 영양 공급과 2차적인 해충 방제 효과를 모두 가져와, 별도로 살충제를 살포할 필요성을 줄여줍니다. UPL Limited는 2025년에 해조류 유래의 “HYCOXA”를 출시하며, 고급 생물 유래 비료의 틈새 시장에서 경쟁이 치열해지고 있음을 시사하고 있습니다. 가격 프리미엄 덕분에, 특히 포도, 토마토, 피망의 경우 1헥타르당 투입 비용의 상승분이 상쇄되고 있습니다. 보호재배의 보급이 확대됨에 따라 연중 수요의 안정성이 강화되고 있습니다.
기후의 영향을 쉽게 받는 님의 수확량으로 인한 아자지락틴 원료 공급의 불안정성
님 기반 비료 시장의 성장은 님 계열 농업 제품에 사용되는 아자지락틴의 주요 원료인 님 씨앗공급이 불안정하다는 점에 의해 제약을 받고 있습니다. 님나무의 개화와 결실은 계절별 강우량과 기후 조건의 영향을 크게 받기 때문에 원료 공급은 가뭄, 불규칙한 몬순, 그리고 이상 기후의 영향을 받기 쉽습니다. 원료의 확보 상황 변동은 원자재 조달을 방해하고, 추출 및 가공 비용을 상승시키며, 제품 품질의 일관성을 확보하는 데 어려움을 초래할 가능성이 있습니다. 이러한 공급의 불확실성은 생산의 확장성과 수익성을 저해하여, 님 기반 비료 시장 전체의 성장을 제한하고 있습니다.
부문별 분석
2025년, 님 기반 비료 시장에서 입상 제품이 46%라는 가장 큰 점유율을 차지했습니다. 이는 농가가 기존의 살포기나 파종기를 사용하여 시비할 수 있기 때문입니다. 이 형태는 습도가 높은 몬순 지역에서도 보존성이 뛰어나며, 창고 보관 중 응결 위험도 최소화할 수 있습니다. 아시아와 아프리카 경작 면적의 대부분을 차지하는 벼, 밀, 옥수수 재배 체계에서 입상 제품의 매출은 계속해서 견조한 추세를 보이고 있습니다. 코팅 기술의 혁신으로 입자의 강도가 향상되어, 취급 시 아자지락틴의 손실이 억제되고 있습니다. 확립된 유통업체 네트워크 덕분에 농촌 지역의 판매점에서는 입상 제품의 재고가 항상 확보되어 있어, 농가들 사이에서 친근감이 더욱 높아지고 있습니다.
액체 제제는 보호 재배 및 물 부족 지역에서 점적 관개가 보급됨에 따라 2031년까지 연평균 성장률(CAGR) 13.0%라는 가장 빠른 속도로 성장하고 있습니다. 액체 비료는 자동 영양분 주입 시스템과 원활하게 통합되어, 작물의 질소 흡수 곡선에 맞춘 정밀한 분할 시비를 가능하게 합니다. 토마토, 오이, 파프리카 재배자들은 수작업으로 살포하는 것에 비해 노동력이 덜 든다는 점을 높이 평가했습니다. 각 제조업체들은 농축 형태의 아자지락틴을 안정화하고 보존 기간을 연장하는 유화 기술에 투자하고 있습니다. 중동 및 남유럽의 비료 및 관개 인프라에 대한 투자 확대는 액상 제품의 잠재적 시장 규모를 더욱 확대시키고 있습니다.
2025년, 곡물 및 곡류는 님 기반 비료 시장 규모의 40%를 차지하며 여전히 가장 큰 점유율을 유지했습니다. 이는 인도의 의무화 정책이 곡물 생산의 주요 투입재인 요소를 대상으로 하고 있기 때문입니다. 논에 모내기를 하기 전 진흙을 교반하거나 밀에 추비를 줄 때 전면에 살포하는 것은 도입하기 쉽습니다. 정부의 조달 프로그램을 통해 코팅 요소가 공공 유통 거점에 공급되어 안정적인 판매가 보장되고 있습니다. 10년 이상에 걸쳐 수집된 수확량 반응 데이터는 농가들의 신뢰를 강화하고, 재구매 주기를 지속시키고 있습니다. 이 부문은 시장 점유율이 하락 추세를 보이고 있음에도 불구하고, 절대적인 판매량은 계속해서 증가할 것으로 전망됩니다.
과일 및 채소는 수출 대상 소비자 수요에 부응하기 위한 유기농 인증 생산의 확대에 힘입어, 2026년부터 2031년까지 연평균 성장률(CAGR) 11.5%를 기록하며 가장 빠르게 성장하고 있는 부문입니다. 보호 재배에는 엄격한 영양 관리가 필요하지만, 님 계열 자재는 온화한 해충 방제제 역할도 하여 화학 물질 잔류 위험을 줄여줍니다. 포도, 베리류, 잎채소의 가격 프리미엄 덕분에 생물 유래 비료에 대한 1헥타르당 지출 증가가 정당화됩니다. 님 사용량을 기록하는 추적성 프로그램은 생산자가 블록체인을 통해 검증된 공급망에 접근할 수 있도록 지원합니다. 남미의 아보카도 농장과 아시아의 망고 농장에서의 채용 확대가 수요를 더욱 가속화하고 있습니다.
지역별 분석
아시아태평양은 최대 시장이며, 2025년에는 님 기반 비료 시장 점유율의 45.3%를 차지할 것으로 전망됩니다. 이는 인도에서 요소의 전면 코팅 의무화가 주도한 것으로, 이를 통해 연간 2,500만 메트르톤 수요가 확보되고 있습니다. 중국에서는 온실 채소 및 과수원에 대한 유기농 인증이 확대됨에 따라 수요가 더욱 증가하고 있습니다. 일본과 한국은 시장 규모는 작지만, 잔류 농약을 중요시하는 슈퍼마켓 유통 채널에서 프리미엄 가격을 유지하고 있습니다. ICL 그룹이 2026년에 마하라슈트라 주에 건설할 예정인 특수 비료 공장은 수용성 님 배합 비료의 지역 공급을 뒷받침하게 될 것입니다. 인도에서 시행되고 있는 소규모 관개에 대한 지속적인 보조금 제도는 액상 제제의 보급을 촉진하고 있습니다.
아프리카의 케냐, 탄자니아, 나이지리아에서는 기부자가 지원하는 소량 시비 프로그램이 시범 단계에서 전국 규모로 확대됨에 따라, 2026년부터 2031년까지 연평균 성장률(CAGR) 12.6%라는 가장 높은 성장세가 예상됩니다. 현지에서 진행되고 있는 님 씨앗 수집 사업을 통해 원자재 공급이 확대되고, 농촌 지역의 일자리가 창출되고 있습니다. 남아프리카의 상업 농장에서는 유럽으로의 수출 허가를 확보하기 위해 감귤류와 포도 과수원에서 님 기반 자재를 사용하고 있습니다. 북아프리카의 생산자들은 관개 부족 상황에서 발생하는 염분 스트레스를 관리하기 위해 서방형 제품을 사용하고 있습니다. 모바일 머니 생태계 덕분에 라스트 마일 단계에서의 결제 불편이 해소되면서, 외딴 마을들에서도 수요가 촉진되고 있습니다.
유럽과 북미에서는 유기농 농산물의 프리미엄 가격과 합성 억제제에 대한 규제적 제한을 배경으로 꾸준한 성장이 나타나고 있습니다. 유럽연합(EU)의 비료 제품 규제는 시장 진입을 위한 통일된 절차를 마련해 주며, 인도와 이스라엘공급업체들이 직면한 행정적 장벽을 낮추고 있습니다. 덴마크, 네덜란드, 독일에서는 기존 곡물 농장에 님 도입을 장려하기 위해 국가 차원의 영양소 유출 감축 목표가 설정되어 있습니다. 미국 캘리포니아주와 플로리다주의 유기농 농지에서는 고부가가치 베리류와 잎채소 재배에 액상 님 농축액이 활용되고 있습니다. 캐나다의 온실 채소 생산 클러스터에서는 슈퍼마켓의 잔류 기준을 충족하기 위해 비료 및 관개 과정에서 님 액제 사용이 점점 더 늘어나고 있습니다.
기타 혜택:
- 엑셀 형식 시장 예측(ME) 시트
- 3개월간의 애널리스트 지원
자주 묻는 질문
목차
제1장 서론
제2장 조사 방법
제3장 주요 요약
제4장 시장 구도
제5장 시장 규모와 성장 예측
제6장 경쟁 구도
제7장 시장 기회와 향후 전망
JHS 26.07.09According to Mordor Intelligence, the neem-based fertilizer market size was valued at USD 0.98 billion in 2025 and is projected to grow from USD 1.05 billion in 2026 to USD 1.66 billion by 2031, growing at a CAGR of 11.1% from 2026 to 2031.
This report is Segmented by Formulation (Powder, Granular, and Liquid), by Crop Type (Cereals and Grains, Oilseeds and Pulses, and More), by Application Method (Soil Application, Foliar Spray, and More), by Distribution Channel (Direct -To-Farmer and Retail/Dealer Network), and by Geography (North America, South America, Europe, and More). The Market Forecasts are Provided in Terms of Value (USD).
Global Neem-Based Fertilizer Market Trends and Insights
Government Mandate on Neem-Coated Urea for Subsidized Nitrogen Fertilizers
India's emphasis on promoting neem-coated urea is driving demand for neem-derived agricultural inputs used in fertilizer production. According to the Press Information Bureau (PIB) of the Government of India, neem-coated urea enhances nitrogen-use efficiency by slowing the release of nitrogen in the soil. This allows farmers to achieve similar results while using approximately 10% less urea compared to conventional formulations. The policy mandating neem coating on subsidized urea remains active, sustaining significant consumption of neem-based coating materials within the fertilizer industry. As manufacturers continue producing neem-coated urea to meet agricultural needs, the demand for neem-derived inputs, including neem oil and azadirachtin, is expected to remain robust, supporting growth in the neem-based fertilizer market.
Growing Demand for Organic Crop Protection in High-Value Horticulture
Fruit and vegetable growers seeking premium export prices adopt neem inputs that comply with the United States Department of Agriculture National Organic Program and the European Union organic regulation. Biological fertilizers provide both nutrient delivery and secondary pest suppression, reducing the need for separate insecticide applications. UPL Limited launched the seaweed-based HYCOXA in 2025, signaling intensified competition within premium biological niches. Price premiums offset higher per-hectare input costs, especially for grapes, tomatoes, and peppers. Wider acceptance in protected agriculture strengthens year-round demand consistency.
Volatile Supply of Azadirachtin Feedstock Due to Climate-Sensitive Neem Yields
The growth of the neem-based fertilizer market is limited by the inconsistent availability of neem seeds, which are the primary source of azadirachtin used in neem-based agricultural products. The flowering and fruiting of neem trees are heavily influenced by seasonal rainfall and climatic conditions, making the feedstock supply susceptible to droughts, irregular monsoons, and extreme weather events. Variations in seed availability can disrupt raw material procurement, raise extraction and processing costs, and pose challenges in ensuring consistent product quality. These supply uncertainties hinder production scalability and profitability, restricting the overall expansion of the neem-based fertilizer market.
Other drivers and restraints analyzed in the detailed report include:
- Rising Restrictions on Synthetic Nitrification Inhibitors in Europe
- Increasing Smallholder Adoption via Micro-Dosing Programs in Africa
- Limited Agronomic Extension Support Outside South Asia
For complete list of drivers and restraints, kindly check the Table Of Contents.
Segment Analysis
Granular products commanded the largest 46% share of the neem-based fertilizer market in 2025 because farmers can apply them with existing broadcast spreaders and seed drills. The format stores well in humid monsoon zones and faces minimal caking risk during warehouse storage. Granular sales remain strong in rice, wheat, and maize systems that dominate Asian and African acreage. Coating technology innovations improve granule integrity, limiting azadirachtin loss during handling. Established dealer networks keep granular shelves stocked in rural outlets, reinforcing farmer familiarity.
Liquid formulations are advancing at the fastest 13.0% CAGR through 2031 as drip irrigation widens across protected horticulture and water-scarce regions. Liquids integrate seamlessly with automated nutrient injection, allowing precise split applications that match crop nitrogen uptake curves. Growers of tomatoes, cucumbers, and bell peppers value the lower labor requirement compared with manual broadcasting. Manufacturers invest in emulsification techniques that stabilize azadirachtin in concentrate form, extending shelf life. Rising fertigation infrastructure investment in the Middle East and Southern Europe further expands the addressable base for liquid products.
Cereals and grains retained the largest 40% of the neem-based fertilizer market size in 2025, as India's mandatory policy targets urea, a cereal input staple. Broadcast application during rice puddling and wheat top-dressing offers straightforward integration. Government procurement programs channel coated urea to public distribution outlets, ensuring consistent offtake. Yield response data collected over a decade reinforces farmer confidence, sustaining repeat purchase cycles. The segment will keep adding absolute volume even as its proportional share tilts downward.
Fruits and vegetables represent the fastest-expanding segment, with a 11.5% CAGR during 2026-2031, as organic-certified production grows for export consumers. Protected cultivation requires tight nutrient management, and neem inputs double as mild pest suppressants, reducing chemical residue risk. Price premiums on grapes, berries, and leafy greens justify higher per-hectare spending on biological fertilizers. Traceability programs that record neem usage help growers access blockchain-verified supply chains. Rising adoption in South American avocado and Asian mango orchards further accelerates demand.
Complete Report Scope:
- By Formulation
- Powder
- Granular
- Liquid
- By Crop Type
- Cereals and Grains
- Oilseeds and Pulses
- Fruits and Vegetables
- Other Crops
- By Application Method
- Soil Application
- Foliar Spray
- Fertigation
- Seed Treatment
- By Distribution Channel
- Direct-To-Farmer
- Retail/Dealer Network
- By Geography
- North America
- United States
- Canada
- Mexico
- Rest of North America
- South America
- Brazil
- Argentina
- Rest of South America
- Europe
- Germany
- France
- United Kingdom
- Italy
- Spain
- Russia
- Rest of Europe
- Asia-Pacific
- China
- India
- Japan
- Australia
- South Korea
- Rest of Asia-Pacific
- Middle East
- Saudi Arabia
- United Arab Emirates
- Rest of Middle East
- Africa
- South Africa
- Nigeria
- Rest of Africa
- North America
Geography Analysis
Asia-Pacific is the largest geography, accounting for 45.3% of the neem-based fertilizer market share in 2025, driven by India's full urea-coating mandate, which locks in annual demand for 25 million metric tons of production. China's push for organic certification in greenhouse vegetables and fruit orchards adds incremental offtake. Japan and South Korea, although smaller, command premium pricing on residue-conscious supermarket channels. ICL Group's 2026 specialty fertilizer plant in Maharashtra underpins the regional supply of water-soluble neem blends. Ongoing subsidies for micro-irrigation in India stimulate the uptake of liquid formulations.
Africa posts the fastest 12.6% CAGR forecast for 2026-2031 as donor-sponsored micro-dosing programs scale from pilot to national coverage in Kenya, Tanzania, and Nigeria. Local neem seed collection initiatives expand raw-material supply and create rural employment. Commercial estates in South Africa adopt neem inputs in citrus and grape orchards to secure European import clearances. North African growers adopt controlled-release products to manage salinity stress under deficit irrigation. Mobile-money ecosystems ease last-mile payment frictions, unlocking demand in remote villages.
Europe and North America grow steadily on the back of organic produce premiums and regulatory limits on synthetic inhibitors. The European Union Fertilizing Products Regulation provides a harmonized route to market, lowering administrative hurdles for Indian and Israeli suppliers. Denmark, the Netherlands, and Germany showcase national nutrient-loss reduction targets that nudge adoption in conventional cereal farms. United States organic acreage in California and Florida absorbs liquid neem concentrates for high-value berries and leafy greens. Canada's greenhouse vegetable cluster increasingly uses neem liquids in fertigation to meet supermarket residue specifications.
- Coromandel International Limited
- Indian Farmers Fertiliser Cooperative Limited
- National Fertilizers Limited
- E.I.D. Parry (India) Limited
- Godrej Agrovet Limited
- UPL Limited
- ICL Group Ltd
- Krishak Bharati Cooperative Limited
- NACL Industries Ltd
- NutriAg Group
- Valent Biosciences LLC
- Haifa Group
- Fortune Biotech Ltd
- Ozone Biotech
- PJ Margo Pvt Ltd
Additional Benefits:
- The market estimate (ME) sheet in Excel format
- 3 months of analyst support
TABLE OF CONTENTS
1 Introduction
- 1.1 Study Assumptions and Market Definition
- 1.2 Scope of the Study
2 Research Methodology
3 Executive Summary
4 Market Landscape
- 4.1 Market Overview
- 4.2 Market Drivers
- 4.2.1 Government mandate on neem-coated urea for subsidized nitrogen fertilizers
- 4.2.2 Growing demand for organic crop protection in high-value horticulture
- 4.2.3 Rising restrictions on synthetic nitrification inhibitors in Europe
- 4.2.4 Increasing smallholder adoption via micro-dosing programs in Africa
- 4.2.5 Commercial roll-out of controlled-release neem nanocarriers
- 4.2.6 Blockchain-enabled provenance premiums for neem-fertilized produce
- 4.3 Market Restraints
- 4.3.1 Volatile supply of azadirachtin feedstock due to climate-sensitive neem yields
- 4.3.2 Limited agronomic extension support outside South Asia
- 4.3.3 Competing cost-effective bio-fertilizer blends with seaweed extracts
- 4.3.4 Slow registration timelines for biostimulants in South American countries
- 4.4 Regulatory Landscape
- 4.5 Technological Outlook
- 4.6 Porter's Five Forces Analysis
- 4.6.1 Threat of New Entrants
- 4.6.2 Bargaining Power of Suppliers
- 4.6.3 Bargaining Power of Buyers
- 4.6.4 Threat of Substitutes
- 4.6.5 Intensity of Competitive Rivalry
5 Market Size and Growth Forecasts (Value)
- 5.1 By Formulation
- 5.1.1 Powder
- 5.1.2 Granular
- 5.1.3 Liquid
- 5.2 By Crop Type
- 5.2.1 Cereals and Grains
- 5.2.2 Oilseeds and Pulses
- 5.2.3 Fruits and Vegetables
- 5.2.4 Other Crops
- 5.3 By Application Method
- 5.3.1 Soil Application
- 5.3.2 Foliar Spray
- 5.3.3 Fertigation
- 5.3.4 Seed Treatment
- 5.4 By Distribution Channel
- 5.4.1 Direct-To-Farmer
- 5.4.2 Retail/Dealer Network
- 5.5 By Geography
- 5.5.1 North America
- 5.5.1.1 United States
- 5.5.1.2 Canada
- 5.5.1.3 Mexico
- 5.5.1.4 Rest of North America
- 5.5.2 South America
- 5.5.2.1 Brazil
- 5.5.2.2 Argentina
- 5.5.2.3 Rest of South America
- 5.5.3 Europe
- 5.5.3.1 Germany
- 5.5.3.2 France
- 5.5.3.3 United Kingdom
- 5.5.3.4 Italy
- 5.5.3.5 Spain
- 5.5.3.6 Russia
- 5.5.3.7 Rest of Europe
- 5.5.4 Asia-Pacific
- 5.5.4.1 China
- 5.5.4.2 India
- 5.5.4.3 Japan
- 5.5.4.4 Australia
- 5.5.4.5 South Korea
- 5.5.4.6 Rest of Asia-Pacific
- 5.5.5 Middle East
- 5.5.5.1 Saudi Arabia
- 5.5.5.2 United Arab Emirates
- 5.5.5.3 Rest of Middle East
- 5.5.6 Africa
- 5.5.6.1 South Africa
- 5.5.6.2 Nigeria
- 5.5.6.3 Rest of Africa
- 5.5.1 North America
6 Competitive Landscape
- 6.1 Market Concentration
- 6.2 Strategic Moves
- 6.3 Market Share Analysis
- 6.4 Company Profiles (Includes Global Level Overview, Market Level Overview, Core Segments, Financials as Available, Strategic Information, Market Rank/Share for Key Companies, Products and Services, and Recent Developments)
- 6.4.1 Coromandel International Limited
- 6.4.2 Indian Farmers Fertiliser Cooperative Limited
- 6.4.3 National Fertilizers Limited
- 6.4.4 E.I.D. Parry (India) Limited
- 6.4.5 Godrej Agrovet Limited
- 6.4.6 UPL Limited
- 6.4.7 ICL Group Ltd
- 6.4.8 Krishak Bharati Cooperative Limited
- 6.4.9 NACL Industries Ltd
- 6.4.10 NutriAg Group
- 6.4.11 Valent Biosciences LLC
- 6.4.12 Haifa Group
- 6.4.13 Fortune Biotech Ltd
- 6.4.14 Ozone Biotech
- 6.4.15 PJ Margo Pvt Ltd