
|
시장보고서
상품코드
2035044
화물 및 물류 시장 : 점유율 분석, 업계 동향 및 통계, 성장 예측(2026-2031년)Freight And Logistics - Market Share Analysis, Industry Trends & Statistics, Growth Forecasts (2026 - 2031) |
||||||
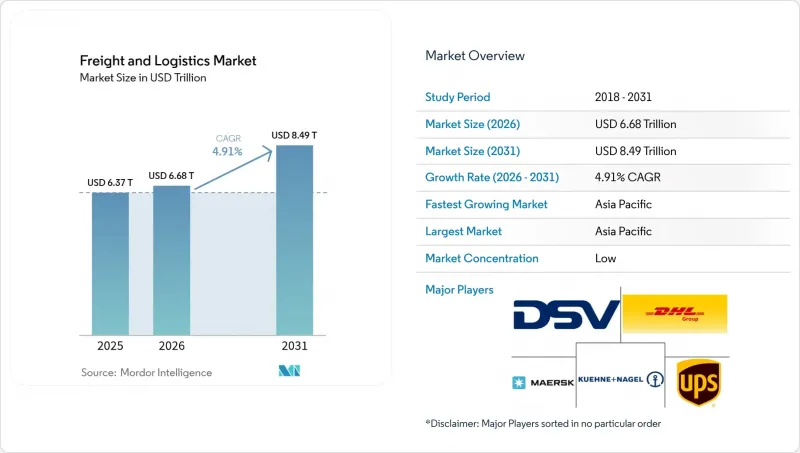
화물 및 물류 시장 규모는 2025년 6조 3,700억 달러에서 2026년에는 6조 6,800억 달러로 확대되어 2026년부터 2031년까지 CAGR 4.91%로 성장을 지속하여, 2031년까지 8조 4,900억 달러에 이를 것으로 예측됩니다.
활발한 전자상거래 활동, 인프라 현대화, 국경 간 택배, 특송, 소포(CEP) 서비스에 대한 수요 증가, 민관 협력의 가속화로 화물 및 물류 시장은 꾸준한 성장 궤도를 유지하고 있습니다. 화물 운송은 여전히 세계 무역의 근간이지만, 화주들이 통합 솔루션을 요구함에 따라 포워딩, 창고 보관, 라스트마일 풀필먼트 등 다양한 부문으로 다각화되고 있습니다. 아시아태평양의 강력한 모멘텀, Scope 3 배출량 보고를 위한 규제 추진, 자동화, 시각화, 예측 최적화를 위한 기술 투자로 인해 경쟁 전략과 비용 구조가 계속 재편되고 있습니다. DSV의 DB쉥커 인수로 대표되는 업계 재편은 운송 능력의 병목 현상과 운전자 부족을 보완하기 위해 업계가 규모, 네트워크 밀도 및 기술 활용에 초점을 맞추고 있음을 보여줍니다.
세계 화물 및 물류 시장 동향 및 인사이트
신흥 시장에서의 전자상거래 확산
아시아태평양과 라틴아메리카의 스마트폰 사용 확대와 디지털 결제의 확산은 신속한 주문 이행에 대한 수요를 증폭시키고 있으며, 물류 사업자들은 인구가 밀집된 도시 지역 근처에 마이크로 풀필먼트 시설을 건설할 수밖에 없는 상황에 처해 있습니다. 이러한 구조적 변화는 국제 CEP(소량 배송) 취급량을 증가시키고 있습니다. CEP는 높은 수익률을 가져다주는 동시에 강력한 통관 능력, 통일된 제품 분류, 데이터 기반 배송 가시성을 필요로 합니다. 각 배송업체들은 높아진 소비자의 배송 기대치에 부응하기 위해 자동 분류, AI를 활용한 경로 계획, 옴니채널 재고 관리에 대한 투자를 진행하고 있습니다. 지역별로 분절된 규제 프레임워크가 복잡해지는 가운데, 국경 간 전자상거래의 컴플라이언스를 효율화하기 위해 세관 당국 간 협력 체제가 구축되고 있습니다. 이러한 노력이 성숙해짐에 따라 국경을 넘는 소포의 흐름으로 인해 중소규모의 유통업체가 세계 무역 네트워크에 더욱 통합되어 전체 화물 및 물류 시장이 확대되고 있습니다.
온디맨드 당일 배송에 대한 기대
성숙한 소비자 시장에서 쇼핑객의 3분의 1 이상이 주요 구매 품목에 대해 당일 배송을 선호함에 따라 소매업체는 주문 처리 청사진을 재구성해야 합니다. 오프라인 매장은 점점 더 하이퍼로컬 배송 거점으로서의 역할을 수행하여 라스트 마일 거리를 단축하고 소포 당 비용을 절감하고 있습니다. 자동 창고 시스템, 협동 로봇, 예측형 인력 스케줄링으로 도시 마이크로 창고의 처리 능력이 향상되고 있습니다. 라스트마일 전문 업체는 크라우드 소싱 배송원, 동적 경로 설정 소프트웨어, 실시간 주문 데이터를 차량 관리 도구에 반영하는 API(애플리케이션 프로그래밍 인터페이스)의 통합을 통해 2시간 이내 배송 시간을 보장합니다. 높은 서비스 기대치는 기존 택배 사업자들에게는 수익률에 대한 압박을 가중시키는 반면, 북미, 유럽 및 선진 아시아태평양의 밀집된 도시를 타겟으로 하는 기술 기반 신규 시장 진출기업들에게는 사업 확장의 길을 열어주고 있습니다.
운전자 부족과 노동력 고령화
미국 및 서유럽의 전문 트럭 운전사의 평균 연령은 50세를 넘어섰고, 라이프스타일에 대한 우려와 교육 지연으로 인해 인력 공급이 따라잡지 못하고 있습니다. 인건비 상승은 계약 단가를 상승시키고, 라스트마일 배송 비용을 부풀려 성수기에 급증하는 수요에 대응할 수 있는 능력을 제한하고 있습니다. 이를 완화하기 위해 운송업체들은 최적화된 배차를 위한 텔레매틱스를 도입하고, 피로를 줄여주는 운전 보조 기술을 도입하고, 통제된 경로에서 자율주행차량의 대열 운행을 시범적으로 시행하고 있습니다. 창고업도 비슷한 인력 부족에 직면하고 있으며, 이로 인해 '상품에서 사람으로' 로봇 기술과 자동 팔레타이징에 대한 투자가 촉진되고 있습니다. 지속적인 인력 부족은 화물 및 물류 시장의 잠재적 생산성 향상에 가장 큰 걸림돌로 작용하고 있습니다.
부문 분석
2025년 기준, 도매 및 소매업은 화물 및 물류 시장 규모의 33.10%를 차지했으며, 이는 끊임없는 재입고 주기, 옴니채널 풀필먼트, 프로모션 시즌 수요 변동에 의해 주도되고 있습니다. 재고 분산 전략은 지역 물류센터와 매장 보충 허브 간의 신속한 미들마일 운송을 필요로 합니다. 전자상거래의 급격한 증가는 소포의 밀도를 높이고, 전통적인 허브 앤 스포크 네트워크에 문제를 야기하는 한편, 분류 자동화 및 운송업체 다변화에 대한 투자를 촉진하고 있습니다.
제조업은 지역화로 인해 대륙 내 원자재 및 부품의 흐름이 증가함에 따라 가장 높은 CAGR 5.17%(2026-2031년)로 확대될 것으로 예측됩니다. OEM(주문자 상표 부착 제조업체)은 여러 공장에 걸친 생산을 동기화하기 위해 적시 주문, 정확한 라인 사이드 배송 및 실시간 가시성을 요구하고 있습니다. 중량물, 프로젝트 화물, 온도 관리 화물 부문은 고부가가치 기계, 전자제품, 의약품에 대한 수요에 힘입어 화물 및 물류 시장의 총잠재수익(TAR)을 확대되고 있습니다. 공급업체 관리 재고(VMI), 공급업체 파크(Supplier Park) 등 전문화된 물류 모델이 확산되면서 제조업체와 제3자 물류 제공업체(3PL) 간의 긴밀한 협업을 촉진하고 있습니다.
화물 운송은 2025년 화물 및 물류 시장 규모의 61.45%를 차지했으며, 전 세계 상거래를 물리적으로 뒷받침하는 방대한 도로, 철도, 해상, 항공 네트워크가 뒷받침하고 있습니다. 성숙한 기반을 바탕으로 거시적 무역 성장이 효율화의 혜택을 상쇄하면서 2026년부터 2031년까지 연평균 복합 성장률(CAGR) 4.19%의 완만한 성장이 예상됩니다. 포워딩은 CAGR 5.18%(2026-2031년)를 예상하고 있으며, 디지털 예약 플랫폼, 화물 시각화 대시보드, 통관 업무 전문성을 활용하여 멀티모달 운송 경로를 조정하고 있습니다. 중소규모의 수출업체들은 컴플라이언스 대응과 운송업체 선정을 포워더에게 위탁하는 경향이 강해지고 있으며, 이는 화물 및 물류 시장에서의 점유율 확대를 견인하고 있습니다.
각 공급자는 관세 분류 엔진, 동기화된 서류 워크플로우, 도착 예측 알고리즘을 통합하여 국경에서 통관 시간을 단축하고 있습니다. 세계 공급망이 여러 원산지로 분산됨에 따라 엔드투엔드 조정과 예외 관리가 주요 차별화 요소로 부상하고 있으며, 포워더는 순수 비용보다 민첩성을 중시하는 화주로부터 계약을 체결할 수 있게 되었습니다. 그 결과, 자산집약형 운송사업이 여전히 절대적인 수익 규모를 지배하고 있음에도 불구하고, 화물 및 물류 시장에서 포워딩의 점유율은 꾸준히 상승하고 있습니다.
지역별 분석
아시아태평양은 2025년 화물 및 물류 시장 규모의 41.20%를 차지했으며, 무역 경로가 중국에서 동남아시아, 인도, 오세아니아로 다양화됨에 따라 2026년부터 2031년까지 6.15%의 업계 최고 CAGR을 나타낼 것으로 예측됩니다. 상하이, 싱가포르, 콜롬보의 대규모 항만 확장, 중국-라오스 간 고속철도 화물 노선 및 디지털 단일 창구 세관 프로그램을 통해 운송 시간을 단축하고 규정 준수 비용을 절감할 수 있습니다. 베트남, 인도네시아, 필리핀으로 제조 거점이 이동함에 따라 아시아 지역 내 트럭 운송, 피더선 수요 및 국경을 넘는 철도 운송이 증가하고 있습니다.
유럽은 대용량의 철도 화물 회랑, 근해 해운 네트워크 및 쉥겐 지역 내 조화로운 통관 제도를 활용하여 강력한 복합운송 체제를 유지하고 있습니다. 지속가능성 리더십은 수소 트럭의 조기 도입, 라스트 마일 운송의 전기화, 운송 모드 전환에 대한 인센티브로 이어져 운송 경로의 경제성을 재구축하고 있습니다. 러시아와의 지정학적 마찰로 인해 동부 육상 노선이 복잡해졌지만, 발트해와 지중해의 관문 항구에 대한 투자는 대체 공급 경로를 촉진하고 화물 및 물류 시장에서 경쟁력을 유지하고 있습니다.
북미는 멕시코와 캐나다에 대한 니어쇼어링의 혜택을 받고 있으며, 국경을 넘는 트레일러 운송량 증가와 양국 간 통관제도 조정을 촉진하고 있습니다. 미국의 '인프라 투자 및 고용법'은 고속도로 개보수, 내륙 항만 개발 및 항만 준설에 박차를 가하고 있습니다. Class I 철도회사들은 전자상거래의 급증에 대응하기 위해 복합운송 터미널을 확장하고 있으며, 멕시코만 연안의 항만 정비는 확장된 파나마 운하를 통해 아시아에서 출발하는 외항 항로를 유치하고 있습니다. 이러한 노력으로 이 지역의 화물 및 물류 시장은 연간 5% 내외의 성장률을 유지하고 있습니다.
기타 특전:
- 엑셀 형식 시장 예측(ME) 시트
- 3개월간 애널리스트 지원
자주 묻는 질문
목차
제1장 서론
제2장 조사 방법
제3장 주요 요약
제4장 시장 구도
제5장 시장 규모와 성장 예측
제6장 경쟁 구도
제7장 시장 기회와 향후 전망
JHS 26.05.20The Freight And Logistics Market size is expected to grow from USD 6.37 trillion in 2025 to USD 6.68 trillion in 2026 and is forecast to reach USD 8.49 trillion by 2031 at 4.91% CAGR over 2026-2031.

Robust e-commerce activity, infrastructure modernization, rising demand for cross-border courier, express, and parcel (CEP) services, and accelerating public-private partnerships keep the freight and logistics market on a steady growth path. Freight transport remains the backbone of global trade, yet segment diversification toward forwarding, warehousing, and last-mile fulfillment is increasing as shippers seek integrated solutions. Strong regional momentum in Asia-Pacific, regulatory pushes for Scope-3 emissions reporting, and technology investments in automation, visibility, and predictive optimization continue to reshape competitive strategies and cost structures. Consolidation, exemplified by DSV's purchase of DB Schenker, underscores the sector's focus on scale, network density, and technology leverage to offset capacity bottlenecks and driver shortages.
Global Freight And Logistics Market Trends and Insights
E-Commerce Penetration in Emerging Markets
Rising smartphone use and digital payment adoption in Asia-Pacific and Latin America amplify demand for rapid order fulfillment, forcing logistics providers to build micro-fulfillment facilities near high-density urban clusters. This structural shift boosts international CEP volumes, which command premium margins and require robust customs-clearing capabilities, harmonized product classification, and data-driven shipment visibility. Providers invest in automated sortation, artificial-intelligence-guided route planning, and omnichannel inventory orchestration to meet elevated consumer delivery promises. Regionally fragmented regulatory frameworks add complexity, prompting collaborative initiatives among customs authorities to streamline cross-border e-commerce compliance. As these efforts mature, cross-border parcel flows further integrate small and medium-sized sellers into global trade networks, expanding the overall freight and logistics market.
On-Demand Same-Day Delivery Expectations
In mature consumer markets, more than one-third of shoppers now prefer same-day delivery on key purchases, prompting retailers to reset fulfillment blueprints. Brick-and-mortar stores increasingly double as hyperlocal distribution nodes, shrinking last-mile distances and reducing per-parcel costs. Automated storage and retrieval systems, collaborative robots, and predictive labor scheduling enhance throughput in urban micro-warehouses. Last-mile specialists leverage crowdsourced couriers, dynamic routing software, and application programming interface (API) integrations that feed real-time order data into fleet management tools, ensuring delivery windows under two hours. High service expectations intensify margin pressure for traditional parcel operators yet create expansion avenues for tech-enabled entrants targeting dense cities across North America, Europe, and advanced Asia-Pacific markets.
Driver Shortage and Ageing Workforce
The median professional truck driver age in the United States and Western Europe exceeds 50 years, while pipeline talent lags due to lifestyle concerns and training backlogs. Rising wage bills elevate contract rates, inflate last-mile delivery costs, and limit surge capacity during peak seasons. To mitigate, carriers adopt telematics for optimized dispatching, deploy driver-assist technologies that cut fatigue, and pilot autonomous vehicle platoons on controlled corridors. Warehousing faces similar labor headwinds, encouraging investments in goods-to-person robotics and automated palletizing. Persistent personnel scarcity remains the single most pronounced brake on potential output gains within the freight and logistics market.
Other drivers and restraints analyzed in the detailed report include:
- Infrastructure Upgrades and PPP Logistics Corridors
- Reshoring and Near-Shoring of Manufacturing
- Port Congestion and Inland Bottlenecks
For complete list of drivers and restraints, kindly check the Table Of Contents.
Segment Analysis
Wholesale and retail trade accounted for 33.10% of the freight and logistics market size in 2025, driven by constant replenishment cycles, omnichannel fulfillment, and promotional seasonality. Inventory decentralization strategies require agile middle-mile transfers among regional distribution centers and store replenishment hubs. E-commerce surges magnify parcel density, challenging legacy hub-and-spoke topologies and stimulating investments in sortation automation and carrier diversification.
Manufacturing expands at the fastest 5.17% CAGR (2026-2031) as regionalization bolsters intra-continental raw material and component flows. Original equipment manufacturers mandate just-in-time sequencing, precise line-side deliveries, and real-time visibility to synchronize production across multi-plant footprints. Heavy-lift, project cargo, and temperature-controlled segments benefit from high-value machinery, electronics, and pharmaceutical demand, widening total addressable revenue within the freight and logistics market. Specialized logistics models, including vendor-managed inventory and supplier parks, gain traction, driving deeper integration between manufacturers and third-party logistics providers.
Freight transport generated 61.45% of the freight and logistics market size in 2025, underpinned by vast road, rail, sea, and air networks that physically move global commerce. Its mature footprint yields moderate expansion, projected at 4.19% CAGR between 2026-2031, as macro trade growth offsets efficiency gains. Forwarding, representing a 5.18% CAGR (2026-2031), leverages digital booking platforms, shipment visibility dashboards, and customs-brokerage expertise to orchestrate multimodal routing. Small and medium-sized exporters increasingly outsource compliance and carrier selection to forwarders, driving wallet-share capture within the freight and logistics market.
Providers integrate tariff classification engines, synchronized document workflows, and predictive arrival algorithms to shrink clearance times at borders. As global supply chains fragment across multiple origins, end-to-end orchestration and exception management become core differentiators, enabling forwarders to win contracts from shippers prioritizing agility over pure cost. Consequently, forwarding's share of the freight and logistics market steadily climbs, even as asset-heavy transport operations continue to dominate absolute revenue pools.
The Freight and Logistics Market Report is Segmented by End User Industry (Agriculture, Fishing, and Forestry, Construction, Wholesale and Retail Trade, and More), by Logistics Function (Courier, Express, and Parcel, Freight Forwarding, Freight Transport, Warehousing and Storage, and Other Services), and Geography (North America, Asia-Pacific, South America, and More). The Market Forecasts are Provided in Terms of Value (USD).
Geography Analysis
Asia-Pacific produced 41.20% of the freight and logistics market size in 2025 and posts the leading 6.15% CAGR between 2026-2031 as trade corridors diversify beyond China to Southeast Asia, India, and Oceania. Massive port expansions at Shanghai, Singapore, and Colombo, high-speed rail cargo lines on the China-Laos route, and digital single-window customs programs shrink transit times and lower compliance costs. Manufacturing shifts toward Vietnam, Indonesia, and the Philippines increase intra-Asian trucking, feeder vessel demand, and cross-border rail traffic.
Europe maintains a strong multimodal proposition, leveraging high-capacity rail freight corridors, short-sea shipping networks, and synchronized customs regimes inside the Schengen area. Sustainability leadership translates into early deployment of hydrogen trucks, electrified last-mile fleets, and modal shift incentives that reshape lane economics. Although geopolitical frictions with Russia complicate eastern overland routes, investments in Baltic and Mediterranean gateway ports foster alternative supply paths, preserving competitiveness within the freight and logistics market.
North America benefits from near-shoring to Mexico and Canada, driving cross-border tractor-trailer volumes and bilateral customs harmonization. The United States' Infrastructure Investment and Jobs Act accelerates highway rehabilitation, inland port development, and port dredging. Class I railroads expand intermodal terminals to capture e-commerce surge, while Gulf Coast port upgrades attract Asian blue-water services via the expanded Panama Canal. Collectively, these initiatives sustain mid-single-digit growth for the region's freight and logistics market.
- A.P. Moller-Maersk
- Allcargo Logistics
- Americold
- Aramex
- C.H. Robinson
- CJ Logistics Corporation
- CMA CGM Group (Including CEVA Logistics)
- CTS Logistics Group
- Culina Group
- DACHSER
- DHL Group
- DP World
- DSV A/S (Including DB Schenker)
- Expeditors International of Washington, Inc.
- FedEx
- GEODIS
- GXO Logistics
- Hellmann Worldwide Logistics
- Hub Group
- International Distributions Services
- J.B. Hunt Transport Services, Inc.
- Japan Post Holdings Co., Ltd.
- JD.com, Inc. (Including JD Logistics, Inc.)
- Kintetsu Group Holdings Co., Ltd. (Including Kintetsu World Express, Inc.)
- Kuehne+Nagel
- La Poste Group (Including DPD Group)
- Landstar System Inc.
- LOGWIN
- LX International Corp. (Including LX Pantos Co., Ltd.)
- Mainfreight
- NFI Industries
- NYK (Nippon Yusen Kaisha) Line
- Orient Overseas Container Line (OOCL Logistics)
- Penske Corporation (Including Penske Logistics)
- Poste Italiane
- Rhenus Logistics
- Ryder System, Inc.
- Savino Del Bene SpA
- SF Express (KEX-SF)
- Sinotrans, Ltd.
- The MSC Group (Mediterranean Shipping Company)
- Total Quality Logistics, LLC
- Uber Technologies Inc.
- United Parcel Service of America, Inc. (UPS)
- XPO, Inc.
- Yamato Holdings Co., Ltd.
Additional Benefits:
- The market estimate (ME) sheet in Excel format
- 3 months of analyst support
TABLE OF CONTENTS
1 Introduction
- 1.1 Study Assumptions and Market Definition
- 1.2 Scope of the Study
2 Research Methodology
3 Executive Summary
4 Market Landscape
- 4.1 Market Overview
- 4.2 Demographics
- 4.3 GDP Distribution by Economic Activity
- 4.4 GDP Growth by Economic Activity
- 4.5 Inflation
- 4.6 Economic Performance and Profile
- 4.6.1 Trends in E-Commerce Industry
- 4.6.2 Trends in Manufacturing Industry
- 4.7 Transport and Storage Sector GDP
- 4.8 Export Trends
- 4.9 Import Trends
- 4.10 Fuel Price
- 4.11 Trucking Operational Costs
- 4.12 Trucking Fleet Size by Type
- 4.13 Major Truck Suppliers
- 4.14 Logistics Performance
- 4.15 Modal Share
- 4.16 Maritime Fleet Load Carrying Capacity
- 4.17 Liner Shipping Connectivity
- 4.18 Port Calls and Performance
- 4.19 Freight Pricing Trends
- 4.20 Freight Tonnage Trends
- 4.21 Infrastructure
- 4.22 Regulatory Framework (Road and Rail)
- 4.22.1 Argentina
- 4.22.2 Australia
- 4.22.3 Brazil
- 4.22.4 Canada
- 4.22.5 Chile
- 4.22.6 China
- 4.22.7 Colombia
- 4.22.8 Egypt
- 4.22.9 France
- 4.22.10 Germany
- 4.22.11 India
- 4.22.12 Indonesia
- 4.22.13 Italy
- 4.22.14 Japan
- 4.22.15 Malaysia
- 4.22.16 Mexico
- 4.22.17 Netherlands
- 4.22.18 Nigeria
- 4.22.19 Nordics
- 4.22.20 Peru
- 4.22.21 Poland
- 4.22.22 Qatar
- 4.22.23 Romania
- 4.22.24 Russia
- 4.22.25 Saudi Arabia
- 4.22.26 South Africa
- 4.22.27 Spain
- 4.22.28 Thailand
- 4.22.29 Turkey
- 4.22.30 UAE
- 4.22.31 United Kingdom
- 4.22.32 United States
- 4.22.33 Uruguay
- 4.22.34 Vietnam
- 4.23 Regulatory Framework (Sea and Air)
- 4.23.1 Argentina
- 4.23.2 Australia
- 4.23.3 Brazil
- 4.23.4 Canada
- 4.23.5 Chile
- 4.23.6 China
- 4.23.7 Colombia
- 4.23.8 Egypt
- 4.23.9 France
- 4.23.10 Germany
- 4.23.11 India
- 4.23.12 Indonesia
- 4.23.13 Italy
- 4.23.14 Japan
- 4.23.15 Malaysia
- 4.23.16 Mexico
- 4.23.17 Netherlands
- 4.23.18 Nigeria
- 4.23.19 Nordics
- 4.23.20 Peru
- 4.23.21 Poland
- 4.23.22 Qatar
- 4.23.23 Romania
- 4.23.24 Russia
- 4.23.25 Saudi Arabia
- 4.23.26 South Africa
- 4.23.27 Spain
- 4.23.28 Thailand
- 4.23.29 Turkey
- 4.23.30 UAE
- 4.23.31 United Kingdom
- 4.23.32 United States
- 4.23.33 Uruguay
- 4.23.34 Vietnam
- 4.24 Value Chain and Distribution Channel Analysis
- 4.25 Market Drivers
- 4.25.1 E-Commerce Penetration in Emerging Markets
- 4.25.2 On-Demand Same-Day Delivery Expectations
- 4.25.3 Infrastructure Upgrades and PPP Logistics Corridors
- 4.25.4 Reshoring and Near-Shoring of Manufacturing
- 4.25.5 Mandatory Scope-3 Emissions Disclosure
- 4.25.6 Defense-Sector Stockpiling
- 4.26 Market Restraints
- 4.26.1 Driver Shortage and Ageing Workforce
- 4.26.2 Port Congestion and Inland Bottlenecks
- 4.26.3 Geopolitical Sanctions on Key Trade Lanes
- 4.26.4 High Cybersecurity Insurance Premiums
- 4.27 Technology Innovations in the Market
- 4.28 Porter's Five Forces Analysis
- 4.28.1 Threat of New Entrants
- 4.28.2 Bargaining Power of Buyers
- 4.28.3 Bargaining Power of Suppliers
- 4.28.4 Threat of Substitutes
- 4.28.5 Competitive Rivalry
5 Market Size and Growth Forecasts (Value, USD)
- 5.1 End User Industry
- 5.1.1 Agriculture, Fishing, and Forestry
- 5.1.2 Construction
- 5.1.3 Manufacturing
- 5.1.4 Oil and Gas, Mining and Quarrying
- 5.1.5 Wholesale and Retail Trade
- 5.1.6 Others
- 5.2 Logistics Function
- 5.2.1 Courier, Express, and Parcel (CEP)
- 5.2.1.1 By Destination Type
- 5.2.1.1.1 Domestic
- 5.2.1.1.2 International
- 5.2.1.1 By Destination Type
- 5.2.2 Freight Forwarding
- 5.2.2.1 By Mode of Transport
- 5.2.2.1.1 Air
- 5.2.2.1.2 Sea and Inland Waterways
- 5.2.2.1.3 Others
- 5.2.2.1 By Mode of Transport
- 5.2.3 Freight Transport
- 5.2.3.1 By Mode of Transport
- 5.2.3.1.1 Air
- 5.2.3.1.2 Pipelines
- 5.2.3.1.3 Rail
- 5.2.3.1.4 Road
- 5.2.3.1.5 Sea and Inland Waterways
- 5.2.3.1 By Mode of Transport
- 5.2.4 Warehousing and Storage
- 5.2.4.1 By Temperature Control
- 5.2.4.1.1 Non-Temperature Controlled
- 5.2.4.1.2 Temperature Controlled
- 5.2.4.1 By Temperature Control
- 5.2.5 Other Services
- 5.2.1 Courier, Express, and Parcel (CEP)
- 5.3 Region
- 5.3.1 Asia-Pacific
- 5.3.1.1 By Country
- 5.3.1.1.1 Australia
- 5.3.1.1.2 China
- 5.3.1.1.3 India
- 5.3.1.1.4 Indonesia
- 5.3.1.1.5 Japan
- 5.3.1.1.6 Malaysia
- 5.3.1.1.7 Thailand
- 5.3.1.1.8 Vietnam
- 5.3.1.1.9 Rest of Asia-Pacific
- 5.3.1.1 By Country
- 5.3.2 Europe
- 5.3.2.1 By Country
- 5.3.2.1.1 Denmark
- 5.3.2.1.2 Finland
- 5.3.2.1.3 France
- 5.3.2.1.4 Germany
- 5.3.2.1.5 Iceland
- 5.3.2.1.6 Italy
- 5.3.2.1.7 Netherlands
- 5.3.2.1.8 Norway
- 5.3.2.1.9 Poland
- 5.3.2.1.10 Romania
- 5.3.2.1.11 Russia
- 5.3.2.1.12 Spain
- 5.3.2.1.13 Sweden
- 5.3.2.1.14 Turkey
- 5.3.2.1.15 United Kingdom
- 5.3.2.1.16 Rest of Europe
- 5.3.2.1 By Country
- 5.3.3 Middle East and Africa
- 5.3.3.1 By Country
- 5.3.3.1.1 Egypt
- 5.3.3.1.2 Nigeria
- 5.3.3.1.3 Qatar
- 5.3.3.1.4 Saudi Arabia
- 5.3.3.1.5 South Africa
- 5.3.3.1.6 United Arab Emirates
- 5.3.3.1.7 Rest of Middle East and Africa
- 5.3.3.1 By Country
- 5.3.4 North America
- 5.3.4.1 By Country
- 5.3.4.1.1 Canada
- 5.3.4.1.2 Mexico
- 5.3.4.1.3 United States
- 5.3.4.1.4 Rest of North America
- 5.3.4.1 By Country
- 5.3.5 South America
- 5.3.5.1 By Country
- 5.3.5.1.1 Argentina
- 5.3.5.1.2 Brazil
- 5.3.5.1.3 Chile
- 5.3.5.1.4 Colombia
- 5.3.5.1.5 Peru
- 5.3.5.1.6 Uruguay
- 5.3.5.1.7 Rest of South America
- 5.3.5.1 By Country
- 5.3.6 Rest of the World
- 5.3.1 Asia-Pacific
6 Competitive Landscape
- 6.1 Market Concentration
- 6.2 Key Strategic Moves
- 6.3 Market Share Analysis
- 6.4 Company Profiles (Includes Global Level Overview, Market Level Overview, Core Segments, Financials as Available, Strategic Information, Market Rank/Share for Key Companies, Products and Services, and Recent Developments)
- 6.4.1 A.P. Moller-Maersk
- 6.4.2 Allcargo Logistics
- 6.4.3 Americold
- 6.4.4 Aramex
- 6.4.5 C.H. Robinson
- 6.4.6 CJ Logistics Corporation
- 6.4.7 CMA CGM Group (Including CEVA Logistics)
- 6.4.8 CTS Logistics Group
- 6.4.9 Culina Group
- 6.4.10 DACHSER
- 6.4.11 DHL Group
- 6.4.12 DP World
- 6.4.13 DSV A/S (Including DB Schenker)
- 6.4.14 Expeditors International of Washington, Inc.
- 6.4.15 FedEx
- 6.4.16 GEODIS
- 6.4.17 GXO Logistics
- 6.4.18 Hellmann Worldwide Logistics
- 6.4.19 Hub Group
- 6.4.20 International Distributions Services
- 6.4.21 J.B. Hunt Transport Services, Inc.
- 6.4.22 Japan Post Holdings Co., Ltd.
- 6.4.23 JD.com, Inc. (Including JD Logistics, Inc.)
- 6.4.24 Kintetsu Group Holdings Co., Ltd. (Including Kintetsu World Express, Inc.)
- 6.4.25 Kuehne+Nagel
- 6.4.26 La Poste Group (Including DPD Group)
- 6.4.27 Landstar System Inc.
- 6.4.28 LOGWIN
- 6.4.29 LX International Corp. (Including LX Pantos Co., Ltd.)
- 6.4.30 Mainfreight
- 6.4.31 NFI Industries
- 6.4.32 NYK (Nippon Yusen Kaisha) Line
- 6.4.33 Orient Overseas Container Line (OOCL Logistics)
- 6.4.34 Penske Corporation (Including Penske Logistics)
- 6.4.35 Poste Italiane
- 6.4.36 Rhenus Logistics
- 6.4.37 Ryder System, Inc.
- 6.4.38 Savino Del Bene SpA
- 6.4.39 SF Express (KEX-SF)
- 6.4.40 Sinotrans, Ltd.
- 6.4.41 The MSC Group (Mediterranean Shipping Company)
- 6.4.42 Total Quality Logistics, LLC
- 6.4.43 Uber Technologies Inc.
- 6.4.44 United Parcel Service of America, Inc. (UPS)
- 6.4.45 XPO, Inc.
- 6.4.46 Yamato Holdings Co., Ltd.
7 Market Opportunities and Future Outlook
- 7.1 White-space and Unmet-Need Assessment
