|
시장보고서
상품코드
2035074
재생에너지 시장 : 점유율 분석, 업계 동향 및 통계, 성장 예측(2026-2031년)Renewable Energy - Market Share Analysis, Industry Trends & Statistics, Growth Forecasts (2026 - 2031) |
||||||
 Mordor Intelligence
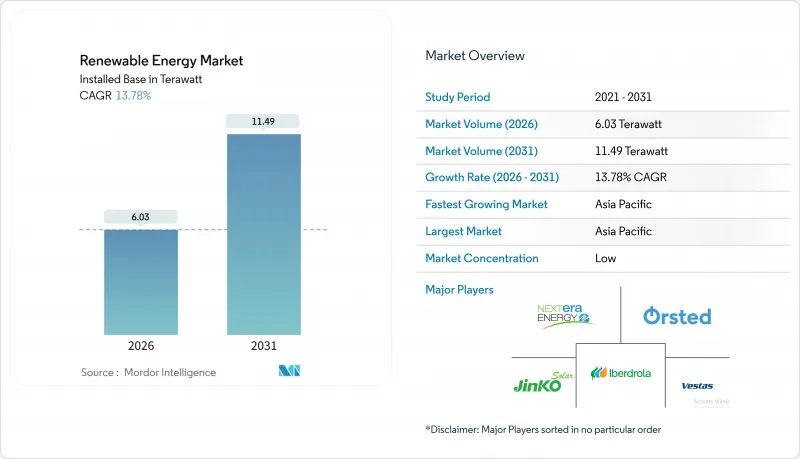
재생에너지 시장 규모는 설치용량 기반으로 예측 기간(2026-2031년)에서 CAGR 13.78%로 확대되어 2026년 6.03 테라왓트에서 2031년에는 11.49 테라왓트에 이른다고 전망되고 있습니다.
이러한 확장은 프로젝트를 앞당기는 수 기가 와트 규모의 기업 간 전력 구매 계약과 기존 전력망에 의존하지 않는 수요를 창출하는 그린 수소 사업을 통해 뒷받침되고 있습니다. 모듈 비용의 하락, 인허가 절차의 신속화, 전해조 중심의 전력 수요와 함께 포화 상태인 시장에서도 추가 발전 용량의 경제적 매력이 증가하고 있습니다. 독립발전사업자(IPP)가 저비용 자본과 턴키 EPC(설계, 조달, 건설) 서비스를 결합하면서 경쟁 환경이 변화하고 있으며, 수직계열화된 전력회사의 지위는 꾸준히 하락하고 있습니다. 한편, 태양광, 풍력, 축전 하이브리드 시스템은 발전량 제한에 대한 헤지 수단으로 부상하고 있으며, 조정 가능한 재생 가능 전력을 제공함으로써 장기적인 축전 기술 도입을 가속화하고 있습니다. 이러한 상황에서 재생에너지 시장에서는 기존 개발업체들의 수익률 압박이 가중되는 반면, 다운스트림 사업을 통합하는 OEM(Original Equipment Manufacturer)에게는 기회가 확대될 것입니다.
세계 재생에너지 시장 동향과 인사이트
북미와 유럽의 기업 전력구매계약(CPPA)은 유틸리티 규모의 건설을 가속화합니다.
기업용 PPA는 15-20년간의 대차대조표 헷지로서 성숙해져 왔으며, 상인 리스크를 투자적격 등급의 신용으로 대체함으로써 개발사업자가 기존 전력회사 입찰 방식보다 더 빠르게 재무적 클로징을 달성할 수 있게 해줍니다. 2024년 Meta가 RWE와 체결한 1.5GW의 포트폴리오는 데이터센터 전력 구매자가 여러 국가에 걸친 파이프라인을 보장하고, 태양광 발전의 건설 주기를 24개월 미만으로, 육상 풍력 발전은 약 30개월로 단축한 좋은 예입니다. 개발자들은 투기적 자산보다 계약된 프로젝트를 우선시하기 때문에 현재 재생에너지 시장의 속도는 규제 당국이 아닌 대규모 구매자에 의해 결정되고 있습니다. 과학에 기반한 목표를 설정하는 기업이 늘어남에 따라 2030년까지 연간 40GW 이상의 신규 설비용량 수요가 예상되며, 재생에너지 시장의 장기적인 성장 궤도를 강화할 것으로 예측됩니다. 그 결과, 미래 전망이 명확해짐에 따라 가중평균자본비용이 낮아지고, 재생에너지 보급률이 높은 전력망에 대한 도입 한도가 상향 조정될 수 있습니다.
북유럽과 아일랜드의 하이퍼스케일 데이터센터 수요, 태양광 및 풍력 발전 조달에 활기를 불어넣다.
AI 워크로드가 클라우드 캠퍼스의 전력 수요 증가를 주도하고 있으며, 이로 인해 사업자들은 수력 및 풍력 발전이 잉여인 지역에서 재생에너지 발전을 확보해야 하는 상황에 직면해 있습니다. 구글이 노르웨이에서 500MW 규모의 풍력 발전 계약을 체결한 것은 기업들이 북유럽 국가의 청정 에너지 믹스를 어떻게 활용하고 있는지를 보여주는 반면, 더블린 주변의 전력망 혼잡으로 인해 투자는 스웨덴과 핀란드로 이동하고 있습니다. 이에 반해 재생에너지 시장은 송전 제약이 있는 거점에 대한 의존도를 낮추는 온사이트 태양광 발전 및 축전 시스템 개발을 추진하고 있습니다. 이러한 움직임은 분산형 자산에 자본이 유입되어 그리드형 인버터와 마이크로그리드 아키텍처를 촉진하고 있습니다. 단기적인 수요 탄력성은 여전히 높으며, 발전설비와 축전지를 세트로 제공할 수 있는 개발업체는 하이퍼스케일러로부터 우선 공급자로서의 지위를 획득하고 있습니다.
ERCOT(미국) 및 내몽골(중국)의 송전망 혼잡 및 출력 억제 리스크
ERCOT에서는 2024년 서부 텍사스 발전량이 휴스턴으로 송전할 수 있는 용량을 초과하여 3.2 TWh의 재생에너지 발전이 억제되었습니다. 현재 계통연계 대기기간이 5년을 넘어섰고, Enel의 300MW급 'Azure Sky' 풍력발전소 등 프로젝트는 2026년까지 연기됐습니다. 중국에서는 내몽골의 출력 억제율이 여전히 4% 안팎으로 유지되고 있으며, 동부지역 구매자에게 전력을 판매할 때 15-20%의 가격 할인이 필요함. 이러한 요인으로 인해 내부 수익률이 낮아져 약 10GW에 달하는 풍력 및 태양광 발전의 신규 도입이 일시적으로 미뤄지고 있습니다. 새로운 HVDC 송전선로가 궁극적으로 제약을 완화할 것으로 예상되지만, 재생에너지 시장의 CAGR에 대한 단기적인 부정적 영향은 피할 수 없습니다.
부문 분석
해양 에너지는 2026년부터 2031년까지 연평균 복합 성장률(CAGR) 36.95%를 기록하며 재생에너지 시장에서 가장 빠르게 성장하는 분야가 될 것입니다. Orbital Marine Power가 Orkney Islands에 설치한 2MW급 O2 조력 터빈은 가동 첫 해에 74%의 설비 이용률을 달성했습니다. 이는 해상풍력의 표준치를 크게 상회하는 수치로, 조력의 예측가능성을 여실히 보여주고 있습니다. Minesto의 'Dragon 12' 연은 저속 해류를 유용한 전력으로 변환하여 수류가 빠른 해협 외의 자원 기반을 확장하고 있습니다. 태양광 발전은 2025년 재생에너지 시장 점유율의 44.61%를 차지할 것으로 예상되며, 2024년 결정질 실리콘 패널 가격이 와트당 0.12달러로 하락하면서 폴리실리콘 가격이 Kg당 8달러 이하로 떨어짐에 따라 태양광 발전이 주도적인 위치를 유지할 것으로 예측됩니다. 유지될 것으로 예측됩니다. TOPCon과 이종접합 셀의 효율이 25%를 넘어서면서 전체 시스템 비용이 더욱 압축되어 온대 지역에서도 경쟁력 있는 가격 수준을 유지하고 있습니다.
풍력발전은 EU의 인허가 절차의 효율화와 중국의 송전망 확충에 힘입어 2025년 발전 용량의 약 35%를 차지할 것으로 예측됩니다. 그러나 해상풍력발전의 경우, 고정식 플랫폼이 1MW당 300만-400만 달러인 반면, 부유식 기초의 경우 1MW당 400만-500만 달러로 건설비용이 급증하고 있다는 문제에 직면해 있습니다. 수력 발전은 적지가 감소하는 가운데 완만한 확장에 머물고 있지만, 중국의 2.4GW 규모의 백학담 양수 발전소는 변동성이 큰 재생에너지 네트워크에서 8시간의 전력 저장의 가치를 입증하고 있습니다. 바이오에너지와 지열은 원자재 가격 변동과 고엔탈피 저류층 부족으로 인해 여전히 8% 미만의 틈새 시장에 머물러 있지만, 아이슬란드의 90MW 규모의 테이스트레이킬 확장 프로젝트는 지열의 기저부하 전원으로서 지열의 매력을 보여주고 있습니다. 전반적으로, 기술 다각화는 재생에너지 시장을 단일 부문의 위험으로부터 보호하면서 투자자들에게 다양한 진입 기회를 제공합니다.
"재생에너지 시장 보고서는 기술별(태양광, 풍력, 수력, 바이오에너지, 지열, 해양에너지), 최종 사용자별(유틸리티, 상업/산업, 주거용), 지역별(북미, 유럽, 아시아태평양, 남미, 중동/아프리카)로 분류되어 있습니다. 시장 규모와 예측은 설치 용량(GW)으로 표시됩니다.
지역별 분석
아시아태평양은 2025년 57.23%의 점유율로 1위를 차지할 것으로 예상되며, 중국의 2024년 설치량 216GW와 인도의 2030년 목표인 500GW를 견인하며 CAGR 16.19%로 확대될 것으로 전망됩니다. 중국 국유 개발업체들은 또한 모듈, 터빈, EPC 서비스를 패키지로 묶은 우대 금융을 통해 동남아시아, 라틴아메리카, 아프리카에 자본과 설비를 수출하고 있습니다. 인도의 해상풍력발전 입찰 및 생산 연동형 인센티브는 제조의 현지화를 지향하며 중국으로부터의 수입 의존도를 낮추기 위한 것입니다.
북미에서는 '인플레이션 억제법(Inflation Reduction Act)에 따라 건설이 가속화되고 있습니다. 이 법은 세액공제를 2032년까지 연장하는 것으로, 이미 1,500억 달러 규모의 국내 제조업에 대한 투자를 촉진하고 있습니다. 미국은 2024년 태양광 발전 32GW, 풍력 발전 8GW를 도입했지만, ERCOT(텍사스주 전력신뢰성위원회)의 출력 억제 조치는 송전망 정비가 늦어지고 있다는 것을 보여줍니다. 캐나다는 수력발전과 해상풍력발전을 활용하여 2030년까지 전력의 90%를 재생에너지로 충당하는 것을 목표로 하고 있습니다. 한편, 멕시코는 일사량이 풍부함에도 불구하고 규제 변경으로 인해 민간 투자가 위축되고 있습니다. 유럽은 'REPowerEU'를 활용하여 인허가 절차의 신속화를 꾀하고 있으며, 스페인과 그리스가 가장 큰 수혜를 받고 있습니다. 한편, 독일은 여전히 24개월이 넘는 전력망 연결 지연에 시달리고 있습니다.
중동 및 아프리카는 수소 수출국으로 부상하고 있으며, 사우디아라비아의 NEOM(4GW 규모의 전해조), 이집트의 10GW 규모의 수에즈만 풍력 발전 계획이 그 증거입니다. 남미의 성장은 브라질의 4GW 규모의 풍력 발전 입찰과 칠레의 25달러/MWh 태양광 발전 회랑을 중심으로 이루어지고 있습니다. 아르헨티나에서는 리튬 광산에 태양광 발전 시설을 병설하여 가공 공정의 탈탄소화를 꾀하고 있습니다. 이러한 지역별 동향이 맞물려 재생에너지 시장 규모를 확대하고, 공급망 다변화를 촉진하고 있습니다.
기타 특전:
- 엑셀 형식 시장 예측(ME) 시트
- 3개월간 애널리스트 지원
자주 묻는 질문
목차
제1장 서론
제2장 조사 방법
제3장 주요 요약
제4장 시장 구도
제5장 시장 규모와 성장 예측
제6장 경쟁 구도
제7장 시장 기회와 향후 전망
JHS 26.05.20The Renewable Energy Market size in terms of installed base is expected to grow from 6.03 Terawatt in 2026 to 11.49 Terawatt by 2031, at a CAGR of 13.78% during the forecast period (2026-2031).
This expansion is anchored by multi-gigawatt corporate power-purchase agreements that pull projects forward, alongside green-hydrogen ventures that create demand unlinked to traditional grids. Module cost compression, faster permitting, and electrolyzer-driven offtake are converging to make incremental capacity economically attractive even in saturated markets. Competitive dynamics are shifting as independent power producers combine low cost of capital with turnkey EPC offerings, steadily eroding the position of vertically integrated utilities. Meanwhile, hybrid solar-wind-storage systems are emerging as a hedge against curtailment, offering dispatchable renewable electricity that accelerates long-duration storage adoption. In this context, the renewable energy market will see rising margin pressure on legacy developers but expanded opportunity for OEMs that integrate downstream.
Global Renewable Energy Market Trends and Insights
Corporate Power-Purchase Agreements Accelerating Utility-Scale Builds in North America & Europe
Corporate PPAs have matured into 15-20-year balance-sheet hedges that replace merchant risk with investment-grade credit, allowing developers to reach financial close more quickly than under traditional utility tenders. Meta's 1.5 GW portfolio with RWE in 2024 exemplifies how data-center offtakers underwrite multi-country pipelines, compressing solar build cycles to under 24 months and onshore wind to roughly 30 months. Developers prioritize contracted projects over speculative assets, so the renewable energy market is now paced by large buyers rather than regulators. As more corporates set science-based targets, aggregate demand is expected to exceed 40 GW of new capacity annually through 2030, reinforcing the long-term trajectory of the renewable energy market. The resulting visibility lowers the weighted average cost of capital and lifts the deployment ceiling in high-penetration grids.
Hyperscale Data-Centre Demand Boosting Solar-Wind Procurement in the Nordics & Ireland
AI workloads are driving electricity growth at cloud campuses, pushing operators to lock in renewable generation in regions with surplus hydro and wind. Google's 500 MW Norwegian wind deal illustrates how firms exploit the Nordics' clean-power mix, whereas grid congestion around Dublin has shifted investment toward Sweden and Finland. The renewable energy market responds by developing on-site solar and storage that reduce dependence on transmission-constrained nodes. This dynamic channels capital into distributed assets, encouraging grid-forming inverters and microgrid architectures. Near-term demand elasticity remains high, and developers that can bundle generation with batteries gain preferred-supplier status with hyperscalers.
Grid Congestion & Curtailment Risks in ERCOT (US) and Inner Mongolia (CN)
ERCOT curtailed 3.2 TWh of renewable electricity in 2024 as West Texas output overwhelmed transmission to Houston. Interconnection queues now exceed five years, delaying projects such as Enel's 300 MW Azure Sky wind farm until 2026. In China, Inner Mongolia's curtailment still hovers near 4%, prompting price discounts of 15-20% to place power with eastern buyers. These factors trim internal rates of return and temporarily defer roughly 10 GW of high-resource wind and solar additions. While new HVDC lines will eventually alleviate constraints, short-term drag on the renewable energy market CAGR is inevitable.
Other drivers and restraints analyzed in the detailed report include:
- Green-Hydrogen Gigawatt Pipelines Driving Capacity Additions in MENA & Australia
- EU REPowerEU Fast-Track Permitting Cutting Onshore-Wind Lead-Times in Southern Europe
- End-of-Life Blade Waste Regulations Raising Costs in Germany & France
For complete list of drivers and restraints, kindly check the Table Of Contents.
Segment Analysis
Ocean Energy's 36.95% CAGR from 2026 to 2031 makes it the fastest-growing slice of the renewable energy market. Orbital Marine Power's 2 MW O2 tidal turbine in Orkney achieved a 74% capacity factor in its debut year, well above offshore wind norms, illustrating tidal predictability. Minesto's Dragon 12 kites convert low-velocity currents into useful electricity, expanding the resource base beyond high-flow straits. Solar Energy, at 44.61% renewable energy market share in 2025, maintains leadership thanks to crystalline-silicon panel prices that fell to USD 0.12 per watt in 2024 as polysilicon costs dropped below USD 8 per kilogram. Efficiency gains above 25% for TOPCon and heterojunction cells further compress balance-of-system expenses, sustaining competitive parity even in temperate zones.
Wind Energy contributes about 35% of 2025 capacity, benefiting from streamlined EU permitting and upgraded grid links in China. Offshore wind, however, faces escalating CAPEX for floating foundations that run USD 4-5 million per MW, compared with USD 3-4 million for fixed platforms. Hydropower expands modestly as site availability wanes, though China's 2.4 GW Baihetan pumped-storage plant demonstrates the value of eight-hour storage in a variable-renewable grid. Bioenergy and Geothermal remain niche at under 8%, constrained by feedstock price volatility and limited high-enthalpy reservoirs, yet Iceland's 90 MW Theistareykir expansion shows geothermal's baseload appeal. Collectively, technology diversification shields the renewable energy market from single-segment risk while offering investors multiple entry points.
The Renewable Energy Market Report is Segmented by Technology (Solar Energy, Wind Energy, Hydropower, Bioenergy, Geothermal, and Ocean Energy), End-User (Utilities, Commercial and Industrial, and Residential), and Geography (North America, Europe, Asia-Pacific, South America, and Middle East and Africa). The Market Sizes and Forecasts are Provided in Terms of Installed Capacity (GW).
Geography Analysis
Asia-Pacific dominated with 57.23% of capacity in 2025 and is forecast to advance at a 16.19% CAGR, led by China's 216 GW of 2024 installations and India's 500 GW 2030 target. Chinese state-owned developers are also exporting capital and equipment into Southeast Asia, Latin America, and Africa through concessional loans that bundle modules, turbines, and EPC services. India's offshore-wind tenders and production-linked incentives aim to localize manufacturing, curbing Chinese import reliance.
North America's build-out accelerates under the Inflation Reduction Act, which extends tax credits to 2032 and has already catalyzed USD 150 billion in domestic manufacturing commitments. The United States deployed 32 GW of solar and 8 GW of wind in 2024, although ERCOT's curtailments reveal transmission lag. Canada targets 90% renewable electricity by 2030 using hydropower and offshore wind, whereas Mexico's regulatory changes have chilled private investment despite strong irradiance. Europe leverages REPowerEU to compress permitting, with Spain and Greece benefiting most; Germany still battles interconnection delays exceeding 24 months.
The Middle East and Africa emerge as hydrogen exporters, evidenced by Saudi Arabia's NEOM (4 GW electrolyzer) and Egypt's 10 GW Gulf of Suez wind plan. South America's growth revolves around Brazil's 4 GW wind auction and Chile's USD 25/MWh solar corridor. Argentina co-locates solar with lithium mines to decarbonize processing. These regional dynamics collectively broaden the renewable energy market footprint and diversify supply chains.
- EPC Developers/Operators/Owners
- Equipment Suppliers
Additional Benefits:
- The market estimate (ME) sheet in Excel format
- 3 months of analyst support
TABLE OF CONTENTS
1 Introduction
- 1.1 Study Assumptions & Market Definition
- 1.2 Scope of the Study
2 Research Methodology
3 Executive Summary
4 Market Landscape
- 4.1 Market Overview
- 4.2 Renewable Energy Mix, 2024
- 4.3 Market Drivers
- 4.3.1 Corporate Power-Purchase Agreements Accelerating Utility-scale Builds in North America & Europe
- 4.3.2 Hyperscale Data-Centre Demand Boosting Solar-Wind Procurement in the Nordics & Ireland
- 4.3.3 Green-Hydrogen Gigawatt Pipelines Driving Capacity Additions in MENA & Australia
- 4.3.4 EU 'REPowerEU' Fast-Track Permitting Cutting Onshore-Wind Lead-Times (<12 Months) in Southern Europe
- 4.4 Market Restraints
- 4.4.1 Grid Congestion & Curtailment Risks in ERCOT (US) and Inner Mongolia (CN)
- 4.4.2 End-of-Life Blade Waste Regulations Raising Costs in Germany & France
- 4.4.3 Lack of Long-Duration Storage Slowing High VRE Penetration in SE-Asia
- 4.4.4 Local-Content Mandates Inflating Offshore-Wind CAPEX in India & Brazil
- 4.5 Supply-Chain Analysis
- 4.6 Regulatory Outlook
- 4.7 Technological Outlook
- 4.8 Porter's Five Forces
- 4.8.1 Bargaining Power of Suppliers
- 4.8.2 Bargaining Power of Consumers
- 4.8.3 Threat of New Entrants
- 4.8.4 Threat of Substitute Products & Services
- 4.8.5 Intensity of Competitive Rivalry
5 Market Size & Growth Forecasts
- 5.1 By Technology
- 5.1.1 Solar Energy (PV and CSP)
- 5.1.2 Wind Energy (Onshore and Offshore)
- 5.1.3 Hydropower (Small, Large, PSH)
- 5.1.4 Bioenergy
- 5.1.5 Geothermal
- 5.1.6 Ocean Energy (Tidal and Wave)
- 5.2 By End-User
- 5.2.1 Utilities
- 5.2.2 Commercial and Industrial
- 5.2.3 Residential
- 5.3 By Geography
- 5.3.1 North America
- 5.3.1.1 United States
- 5.3.1.2 Canada
- 5.3.1.3 Mexico
- 5.3.2 Europe
- 5.3.2.1 United Kingdom
- 5.3.2.2 Germany
- 5.3.2.3 France
- 5.3.2.4 Spain
- 5.3.2.5 Nordic Countries
- 5.3.2.6 Russia
- 5.3.2.7 Rest of Europe
- 5.3.3 Asia-Pacific
- 5.3.3.1 China
- 5.3.3.2 India
- 5.3.3.3 Japan
- 5.3.3.4 South Korea
- 5.3.3.5 Malaysia
- 5.3.3.6 Thailand
- 5.3.3.7 Indonesia
- 5.3.3.8 Vietnam
- 5.3.3.9 Australia
- 5.3.3.10 Rest of Asia-Pacific
- 5.3.4 South America
- 5.3.4.1 Brazil
- 5.3.4.2 Argentina
- 5.3.4.3 Colombia
- 5.3.4.4 Rest of South America
- 5.3.5 Middle East and Africa
- 5.3.5.1 Saudi Arabia
- 5.3.5.2 United Arab Emirates
- 5.3.5.3 South Africa
- 5.3.5.4 Egypt
- 5.3.5.5 Rest of Middle East and Africa
- 5.3.1 North America
6 Competitive Landscape
- 6.1 Market Concentration
- 6.2 Strategic Moves (M&A, JVs, Funding, PPAs)
- 6.3 Market Share Analysis (Market Rank/Share for key companies)
- 6.4 Company Profiles (includes Global-level Overview, Market-level Overview, Core Segments, Financials, Strategic Information, Products & Services, Recent Developments)
- 6.4.1 EPC Developers/Operators/Owners
- 6.4.1.1 NextEra Energy, Inc.
- 6.4.1.2 Orsted A/S
- 6.4.1.3 Iberdrola, S.A.
- 6.4.1.4 EDF Renewables (EDF S.A.)
- 6.4.1.5 Duke Energy Corporation
- 6.4.1.6 Berkshire Hathaway Energy
- 6.4.1.7 Acciona Energia S.A.
- 6.4.1.8 Engie S.A.
- 6.4.1.9 China Three Gorges Corporation
- 6.4.1.10 Enel Green Power S.p.A.
- 6.4.1.11 Statkraft A.S.
- 6.4.1.12 Pattern Energy Group
- 6.4.1.13 Invenergy LLC
- 6.4.1.14 RWE Renewables GmbH
- 6.4.1.15 ACWA Power
- 6.4.1.16 EDP Renovaveis S.A.
- 6.4.1.17 Brookfield Renewable Partners L.P.
- 6.4.1.18 ReNew Energy Global PLC
- 6.4.1.19 Scatec ASA
- 6.4.2 Equipment Suppliers
- 6.4.2.1 First Solar, Inc.
- 6.4.2.2 Vestas Wind Systems A/S
- 6.4.2.3 Siemens Gamesa Renewable Energy S.A.
- 6.4.2.4 GE Vernova (General Electric)
- 6.4.2.5 JinkoSolar Holding Co. Ltd.
- 6.4.2.6 Canadian Solar Inc.
- 6.4.2.7 Longi Green Energy Technology Co., Ltd.
- 6.4.2.8 Goldwind Science & Technology Co., Ltd.
- 6.4.2.9 Trina Solar Co., Ltd.
- 6.4.2.10 Enphase Energy, Inc.
- 6.4.2.11 Sungrow Power Supply Co., Ltd.
- 6.4.2.12 Mitsubishi Power, Ltd.
- 6.4.2.13 Nordex SE
- 6.4.2.14 MHI Vestas Offshore Wind A/S
- 6.4.2.15 Shanghai Electric Group Co., Ltd.
- 6.4.2.16 Hitachi Energy Ltd.
- 6.4.2.17 ABB Ltd.
- 6.4.2.18 Climeon AB
- 6.4.2.19 Pelamis Wave Power Ltd. (in Administration)
- 6.4.2.20 Ocean Power Technologies, Inc.
- 6.4.1 EPC Developers/Operators/Owners
7 Market Opportunities & Future Outlook
- 7.1 White-space & Unmet-Need Assessment