

|
시장보고서
상품코드
2044028
통신 네트워크 지속가능성 : 시장 점유율 분석, 업계 동향 및 통계, 성장 예측(2026-2031년)Telecom Network Sustainability - Market Share Analysis, Industry Trends & Statistics, Growth Forecasts (2026 - 2031) |
||||||
 Mordor Intelligence
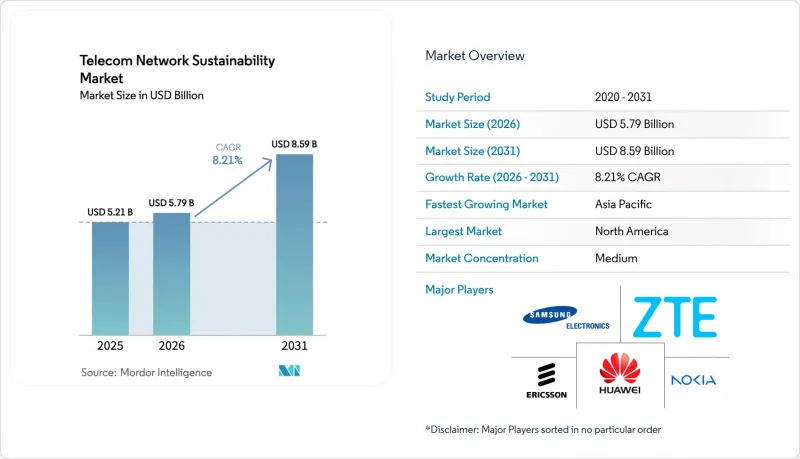
통신 네트워크 지속가능성 시장 규모는 2025년 52억 1,000만 달러로 평가되었습니다. 2026년 57억 9,000만 달러로 확대되어 2026년부터 2031년에 걸쳐 CAGR 8.21%를 나타내, 2031년에는 85억 9,000만 달러에 이를 것으로 예측됩니다.
5G 밀집화에 따른 전기요금 상승, 탄소중립 의무 강화, ESG 연동형 금융의 가용성 등이 맞물리면서 지속가능성은 이사회 차원의 우선순위로 떠오르고 있습니다. 통신 사업자들은 Scope 1과 2의 배출량을 줄이고 우대 금리를 확보하기 위해 AI 기반 무선 액세스 네트워크(RAN) 절전 모드 소프트웨어, 모듈식 개방형 RAN 하드웨어, 현장 재생에너지 마이크로그리드에 자본을 투자하고 있습니다. 하고 있습니다. 하이퍼스케일 클라우드 제공업체들은 코로케이션 파트너에게 24시간 365일 무탄소 에너지 도입 일정을 준수할 것을 요구하고 있으며, 타워 업체들은 프리미엄 리스를 통해 여러 테넌트에 걸친 그린 인프라를 통해 수익을 창출하고 있습니다. 그린 인프라를 통해 수익을 창출하고 있습니다.
세계의 통신 네트워크 지속가능성 관련 시장 동향 및 인사이트
네트 제로 약속과 ESG 규제
투자자들은 더 이상 탄소배출량 보고를 단순한 부록으로 취급하는 통신사업자를 더 이상 평가하지 않습니다. 유럽연합(EU)의 '기업 지속가능성 보고 지침'이 발효되자, 보다폰과 텔레포니카 조달팀은 평가 기준에 라이프사이클 배출량을 포함시키기 시작했고, 검증되지 않은 데이터를 가지고 있는 공급업체는 갑자기 최종 후보 목록에서 제외되었습니다. 중국 공업정보화부는 2030년까지 동등한 배출 상한선을 설정했고, 이에 따라 차이나모바일은 1년 동안 120만 개의 기지국에 AI 에너지 관리 소프트웨어를 도입했습니다. 이 전환에 따라 통신 네트워크 지속가능성 시장에 참여하는 모든 시장 참여자들은 2025년에 발행된 5,000억 달러 규모의 ESG 채권 시장에 접근하기 위해 감사 가능한 탄소배출량 수치를 공개해야 합니다.
5G 밀집화로 인한 에너지 비용 급상승
광역 4G 사이트에서 고밀도 5G 클러스터로 전환함에 따라, 특히 전력회사가 사전 고지 없이 요금을 인상하는 시장에서월전기요금이 2배, 경우에 따라서는 3배로 뛰었습니다. 에릭슨의 조사에 따르면, 일반적인 5G 매크로 사이트의 전력 소비량은 4-5kW인 반면, 4G 하드웨어는 2-3kW로, 전력 요금이 급등하면 많은 지방 시장이 적자 경영에 빠지는 상황이 발생합니다. 이에 대해 타워 사업자는 하이브리드형 태양광 발전 및 축전지 키트를 도입하여 대응했습니다. 아메리칸 타워가 아프리카와 라틴아메리카에서 시행한 3,000개 사이트 규모의 프로그램은 디젤 연료 소비를 60% 절감하여 연간 약 5만 톤의 CO2 배출을 줄였습니다. 이러한 규모의 비용 절감 효과로 인해 중소 통신사들도 오프 그리드 전원 공유로 전환하기 시작했으며, 통신 네트워크 지속가능성 시장의 범위가 확대되고 있습니다.
기존 인프라 개보수에는 막대한 설비투자 필요
지속가능성을 위해 기존 네트워크를 업그레이드하려면 많은 자본이 필요하며, 이는 단기적인 ROI 목표와 상충되는 경우가 많습니다. 5만 개의 기지국을 관리하는 1등급 통신사업자의 경우, 이는 7억 5,000만 달러에서 12억 5,000만 달러에 해당하며, 수익이 부진한 시장에서 연간 설비투자의 15-25%를 차지합니다. 유럽에서는 Orange, Deutsche Telekom 등 통신사업자들이 AI를 통한 에너지 최적화가 불가능한 구식 3G 기지국에 여전히 의존하고 있어 2단계 업그레이드 주기를 강요당하고 있습니다. 도시지역을 우선시하기 때문에 지방과의 에너지 효율 격차가 확대되고 있습니다. 타워회사의 임대 모델은 업그레이드 비용을 융자하고 임대료 인상을 통해 비용을 회수하는 것으로, 설비투자 부담을 해소하는 것이 아니라 단순히 전환하는 것일 뿐입니다.
부문 분석
2025년에는 솔루션이 시장 점유율의 68.45%를 차지했으며, 그 원동력은 에너지 효율이 높은 무선 기기, AI 기반 네트워크 플랫폼, 재생에너지를 활용한 마이크로그리드에 대한 투자로 나타났습니다. 서비스 부문은 2031년까지 연평균 8.98%씩 성장하고 있습니다. 통신사들은 2025년 예산의 거의 70%를 하드웨어에 투자했지만, 효율적인 무선 장비를 구입하는 것이 쉬운 부분이라는 것을 금방 알아차렸습니다. 수천 개공급업체, 컨테이너, 폐기물 처리 흐름에 걸친 Scope 3 배출량을 계산하는 것이 어렵기 때문에 통신사들은 현재 액센츄어, 캡제미니, 에릭슨의 컨설팅 부서를 고용하여 데이터를 분석했습니다. 따라서 통신 네트워크 지속가능성 시장의 서비스 수익은 규제 당국이 매년 공시 규정을 업데이트하고 자문 계약을 유지함에 따라 어떤 패키지 제품보다 빠른 속도로 연간 약 9%씩 증가하고 있습니다. 에너지 모니터링 대시보드는 그 매력을 여실히 보여줍니다. 노키아의 NetGuard 플랫폼은 야간에 안전하게 가동이 중단될 수 있는 초과 용량 기지국을 식별하여 도입 후 18개월 만에 원금을 회수할 수 있었습니다.
마찬가지로 중요한 것은 이 서비스를 통해 통신사업자가 지속가능성 관련 지출을 설비투자(Capex)에서 운영비(OpEx)로 전환할 수 있다는 점입니다. 많은 통신사들은 자체 탄소 회계 도구를 구입하는 대신 네트워크 규모에 따라 변동하는 월별 요금을 지불하는 것을 선호합니다. 이를 통해 현금 흐름이 평준화되고, 비용이 이용 현황과 연동되기 때문입니다. 이러한 변화는 7자리 숫자의 소프트웨어 라이선스 비용을 정당화할 수 없는 중소 MVNO(Mobile Virtual Network Operator)를 끌어들이고 있습니다. 감사받은 Scope 3 데이터 공개를 의무화하는 국가가 늘어남에 따라, 통신 네트워크 지속가능성 시장의 서비스 분야는 벤더와 컨설턴트 모두에게 예측 가능하고 높은 수익률을 가져다주는 구독 모델로 정착될 것입니다.
2025년 기준, 액세스 네트워크는 조사 대상 시장의 37.89%를 차지했으며, 이는 5G 밀도 향상 캠페인에서 전개된 방대한 수의 무선 유닛에 의해 주도될 것으로 보입니다. 그러나 데이터센터 및 엣지 시설은 2031년까지 연평균 9.12%의 성장률을 나타낼 것으로 예측되며, 이는 네트워크 계층 중 가장 높은 성장률입니다. 5G 업그레이드를 위해서는 매번 새로운 무선 장비가 필요하기 때문에 RAN은 여전히 가장 큰 시장 규모를 차지하고 있지만, 엣지 및 데이터센터 노드가 가장 주목해야 할 부분입니다. 구글 클라우드는 2025년 5개 지역에서 24시간 365일 무탄소 에너지를 실현하고, 마이크로소프트는 2030년까지 같은 목표를 달성하기 위해 100억 달러를 확보했습니다. 하이퍼스케일러 기업이 코로케이션 시설 운영에 친환경 전력 사용을 강력히 요구할 경우, 멀티 액세스 엣지 컴퓨팅(MAEC)을 호스팅하는 지역 통신 사업자는 이를 따르지 않으면 계약을 잃을 수 있습니다. 이러한 압력은 에지 시설의 9% 성장률을 견인하고 있으며, 이는 통신 네트워크 지속가능성 시장에서 코어 및 전송 업그레이드의 성장률을 쉽게 능가하고 있습니다.
단순한 전력 조달에 그치지 않고, 엣지 노드는 열의 재사용과 수요반응을 통한 수익 창출이라는 새로운 수단을 개척하고 있습니다. 현재 북유럽 통신사들은 마이크로 데이터센터에서 발생하는 폐열을 지역 난방망에 공급하여 투자 회수 기간을 단축할 수 있는 크레딧을 받고 있습니다. 미국에서는 버라이즌이 기지국에 배터리를 설치하여 백업용뿐만 아니라 지역 전력 시장에서 주파수 조정 용량 입찰에 참여함으로써 지속가능성 설비의 수익화를 더욱 추진하고 있습니다. 이러한 노력으로 엣지 계층은 단순한 비용 중심에서 다각적인 수익원으로 승화되어 향후 설비투자에 대한 견인력을 강화하고 있습니다.
지역별 분석
북미에서는 대규모 풍력 발전소와의 전력 구매 계약이 여전히 가장 저렴한 탄소 감축 수단이기 때문에 사이트 당 지출이 가장 많습니다. Verizon과 AT&T는 이러한 계약을 통해 전력 시장의 변동성 위험을 피하고, 2035년까지 넷제로를 달성하기 위한 신뢰할 수 있는 로드맵을 월스트리트에 제시하고 있습니다. 특히 텍사스 주와 중서부 지역의 주정부 차원의 인센티브는 대규모 풍력 및 태양광 발전 프로젝트의 매력을 더욱 높이고 있으며, 통신 네트워크 지속가능성 시장에서 이 지역의 26.78% 점유율을 견인하고 있습니다.
그러나 아시아태평양은 2031년까지 연평균 10.19%의 성장률을 나타낼 것으로 예측되며, 정부의 규제와 압도적인 규모의 5G 구축에 힘입어 지역별로 가장 높은 성장률을 나타낼 것으로 예측됩니다. 인도 통신부는 2027년까지 재생에너지 지원 5G 기지국 설치를 의무화했고, 이에 따라 릴라이언스 지오와 버티 에어텔은 기지국 옥상에 태양광 필름과 배터리 팩을 설치했습니다. 차이나모바일은 중국 정부의 2030년 탄소 피크아웃 지침에 따라 2025년 120만 대의 무선통신기기에 AI 슬립 컨트롤러를 도입하여 한 번의 예산 주기로 네트워크 총 전력의 두 자릿수 비율을 절감했습니다. 아시아태평양의 네트워크가 계속 확장되고 있기 때문에 신규 사이트에는 처음부터 친환경 장비를 도입하고 있으며, 그 결과 설비투자(CAPEX)는 리노베이션 비용이 아닌 성장 예산에 반영되고 있습니다. 이는 이 지역의 통신 네트워크 지속가능성 시장에 구조적인 호재로 작용하고 있습니다.
유럽에서는 네트워크가 성숙하고 노후화된 장비를 교체하는 데 많은 비용이 들지만, 유럽 그린딜에 따라 통신 사업자들은 여전히 대응을 해야 하는 상황입니다. 오렌지부터 보다폰까지 각 사업자들은 ESG 연동형 대출을 활용하고 있으며, 에너지 관련 KPI가 개선되면 금리가 인하되는 구조로 되어 있습니다. 이를 통해 개보수라는 '채찍'과 금리우대라는 '당근'의 균형을 맞추고 있습니다. 북유럽과 베네룩스와 같은 소규모 시장에서는 엣지 서버에서 배출되는 폐열을 지역 난방 파이프에 공급하는 열 재사용 제도를 시범적으로 도입하고 있습니다. 이는 에너지 사업자가 장기 계약을 승인하면 확산될 수 있는 혁신적인 시도입니다. 남미, 중동 및 아프리카를 합치면 지출의 15% 내외의 점유율을 차지하고 있지만, 이들 지역의 성장 곡선은 오프 그리드 통신 타워에서 디젤 발전을 대체하는 타워 기업의 태양광 발전 프로젝트에 달려 있습니다. 전력 서비스를 장기 임대에 통합한 자금 조달 모델은 높은 주정부 차입 비용을 극복하고 이들 지역에서의 도입을 가속화하는 데 도움이 될 것입니다.
기타 혜택 :
- 엑셀 형식 시장 예측(ME) 시트
- 3개월간 애널리스트 지원
자주 묻는 질문
목차
제1장 서론
제2장 조사 방법
제3장 주요 요약
제4장 시장 구도
제5장 시장 규모와 성장 예측
제6장 경쟁 구도
제7장 시장 기회와 향후 전망
KTH 26.05.29The Telecom Network Sustainability Market size is expected to grow from USD 5.21 billion in 2025 to USD 5.79 billion in 2026 and is forecast to reach USD 8.59 billion by 2031 at 8.21% CAGR over 2026-2031.
Escalating electricity bills from 5G densification, binding carbon-neutrality mandates, and the availability of ESG-linked financing are together raising sustainability to a board-level priority. Operators are directing capital toward AI-driven radio access network (RAN) sleep-mode software, modular Open RAN hardware, and on-site renewable microgrids to curb Scope 1 and 2 emissions and secure preferential lending rates. Market momentum is reinforced by hyperscale cloud providers that insist colocation partners match their 24/7 carbon-free energy timelines, while tower companies monetize green infrastructure across multiple tenants through premium leases.
Global Telecom Network Sustainability Market Trends and Insights
Net-Zero Commitments and ESG Regulation
Investors no longer reward telecom operators that treat carbon reporting as a footnote. When the European Union's Corporate Sustainability Reporting Directive took effect, procurement teams at Vodafone and Telefonica began scoring bids partly on life-cycle emissions, and vendors that lacked verified data suddenly fell off short lists. China's Ministry of Industry and Information Technology set a matching 2030 ceiling, prompting China Mobile to wire 1.2 million base stations with AI energy software in a single year. This pivot forces every participant in the telecom network sustainability market to publish auditable carbon numbers to access the USD 500 billion ESG-bond pool priced in 2025.
Escalating Energy Costs From 5G Densification
Moving from wide-area 4G sites to dense 5G clusters doubled, and sometimes tripled, monthly electricity bills, especially in markets where utilities raise tariffs with little notice. Ericsson recorded 4-5 kW draws for a typical 5G macro site, compared with 2-3 kW for 4G hardware, pushing many rural markets into negative-margin territory when grid prices spike. Tower operators answered by rolling out hybrid solar-battery kits; American Tower's 3,000-site program in Africa and Latin America cut diesel burn by 60% and saved roughly 50,000 t of CO2 each year. Cost relief of that scale is nudging smaller carriers toward shared off-grid power, expanding the addressable slice of the telecom network sustainability market.
High Capex to Retrofit Legacy Infrastructure
Upgrading brownfield networks for sustainability requires significant capital, often at odds with short-term ROI goals. For a tier-1 operator managing 50,000 sites, this equates to USD 750 million-1.25 billion, or 15-25% of annual capex in stagnant revenue markets. In Europe, operators like Orange and Deutsche Telekom still rely on outdated 3G base stations incapable of AI-driven energy optimization, forcing a two-tiered upgrade cycle. Urban sites are prioritized, widening the energy-efficiency gap with rural areas. Leasing models from tower companies, which finance upgrades and recover costs via higher rents, shift rather than eliminate the capex burden.
Other drivers and restraints analyzed in the detailed report include:
- AI-Driven RAN Sleep-Mode Optimization
- Vendor Eco-Design and Life-Cycle Standards
- Absence of Unified Sustainability KPIs
For complete list of drivers and restraints, kindly check the Table Of Contents.
Segment Analysis
Solutions comprised 68.45% of market share in 2025, driven by investments in energy-efficient radios, AI-powered network platforms, and renewable microgrids. Services, growing at 8.98% through 2031. Operators poured almost 70% of their 2025 budgets into hardware but quickly discovered that buying an efficient radio is the easy part. Calculating Scope 3 footprints across thousands of suppliers, containers, and disposal streams is tougher, so carriers now hire consulting arms at Accenture, Capgemini, and Ericsson to crunch that data. Services revenue inside the telecom network sustainability market therefore rises nearly 9% a year, faster than any boxed product, because regulators refresh disclosure rules annually, keeping advisory contracts alive. Energy-monitoring dashboards illustrate the appeal: Nokia's NetGuard platform paid for itself in 18 months after highlighting over-provisioned cell sites that could safely cycle down at night.
Just as important, services let operators move sustainability spending from capex to opex. Instead of buying their own carbon-accounting tools, many carriers prefer paying a monthly fee that scales with network size, smoothing cash flow and aligning costs with usage. This shift attracts smaller mobile virtual network operators that could never justify a seven-figure software license. As more countries mandate audited Scope 3 data, the service slice of the telecom network sustainability market should harden into a subscription model that delivers predictable, high-margin revenue to vendors and consultants alike.
The access network held 37.89% of the studied market in 2025, driven by the sheer volume of radio units deployed in 5G densification campaigns. Yet data center and edge facilities are growing at 9.12% through 2031, the fastest rate among network layers. RAN still commands the biggest dollar share because every 5G upgrade needs new radios, yet edge and data-center nodes are the real head-turners. Google Cloud matched 24/7 carbon-free energy for five regions in 2025, and Microsoft reserved USD 10 billion to hit the same goal by 2030. Those promises ripple outward when hyperscalers insist that a colocation hall run on green power, and the local telecom operator hosting multi-access edge compute must follow suit or lose the contract. That pressure fuels a 9% growth rate for edge facilities, easily outpacing core and transport upgrades inside the telecom network sustainability market.
Beyond raw power sourcing, edge nodes open new levers for heat reuse and demand-response revenue. Operators in Northern Europe now pipe waste heat from micro-data centers into district-heating grids, earning credits that shorten the payback period. In the United States, Verizon installs batteries at cell sites not only for backup but also to bid for frequency-regulation capacity in regional power markets, further monetizing sustainability installations. These tweaks elevate the edge layer from a cost center to a diversified earnings engine, strengthening its pull on future capex.
The Telecom Network Sustainability Market Report is Segmented by Component (Solutions and Services), Network Layer (Access Network, Transport/Backhaul, Core Network, and More), Deployment Model (On-Premise and Cloud/SaaS), Network Technology (5G, 4G/LTE, and More), Operator Type (Mobile Network Operators (MNOs), Fixed-Line and ISPs, and More), and Geography. The Market Forecasts are Provided in Terms of Value (USD).
Geography Analysis
North America continues to spend the most per site because power purchase agreements with large wind farms remain the cheapest path to carbon cuts. Verizon and AT&T use those contracts to shield themselves from utility volatility and to show Wall Street credible net-zero roadmaps by 2035. State-level incentives, especially in Texas and the Mid-Atlantic, make large wind or solar blocks even more attractive, reinforcing the region's 26.78% share of the telecom network sustainability market.
However, Asia-Pacific is expanding at 10.19% through 2031, the fastest regional growth rate, propelled by government mandates and the sheer scale of 5G deployments. India's Department of Telecommunications mandated renewable-ready 5G base stations by 2027, prompting Reliance Jio and Bharti Airtel to line cell-site rooftops with solar film and battery packs. China Mobile, under Beijing's 2030 carbon-peaking directive, wired 1.2 million radios with AI sleep controllers in 2025, saving a double-digit slice of total network power in a single budget cycle. Because APAC networks are still expanding, new sites ship with green kit baked in, so capex falls into growth budgets rather than retrofit buckets, a structural tailwind for the regional telecom network sustainability market.
In the European region, networks are mature, and swapping old gear is expensive, yet the European Green Deal still pressures carriers to move. Operators from Orange to Vodafone tap ESG-linked loans that shave interest rates if energy KPIs improve, creating financial carrots to balance the retrofit stick. Smaller markets, Nordics, Benelux, experiment with heat-reuse schemes, feeding waste warmth from edge servers into municipal district-heating pipes, an innovation that may spread once energy utilities verify long-term contracts. South America and the Middle East and Africa together account for a mid-teens share of spending, but their growth curves hinge on tower-company solar projects that replace diesel in off-grid towers. Financing models that bundle power services into long leases help overcome high sovereign borrowing costs and accelerate adoption in these regions.
- Telefonaktiebolaget LM Ericsson
- Nokia Corporation
- Huawei Technologies Co., Ltd.
- ZTE Corporation
- Cisco Systems, Inc.
- Samsung Electronics Co., Ltd.
- NEC Corporation
- Fujitsu Limited
- Dell Technologies Inc.
- International Business Machines Corporation (IBM)
- Juniper Networks, Inc.
- Mavenir Systems, Inc.
- Parallel Wireless, Inc.
- Capgemini Engineering (Capgemini SE)
- Accenture plc
- Orange S.A.
- Vodafone Group Plc
- American Tower Corporation
- Crown Castle Inc.
- Digital Realty Trust, Inc.
Additional Benefits:
- The market estimate (ME) sheet in Excel format
- 3 months of analyst support
TABLE OF CONTENTS
1 INTRODUCTION
- 1.1 Study Assumptions and Market Definition
- 1.2 Scope of the Study
2 RESEARCH METHODOLOGY
3 EXECUTIVE SUMMARY
4 MARKET LANDSCAPE
- 4.1 Market Overview
- 4.2 Market Drivers
- 4.2.1 Net-Zero Commitments and ESG Regulation
- 4.2.2 Escalating Energy Costs From 5G Densification
- 4.2.3 Availability of Green Financing and ESG-Linked Bonds
- 4.2.4 Vendor Eco-Design and Lifecycle-Assessment Standards
- 4.2.5 AI-Driven RAN Sleep-Mode Optimization
- 4.2.6 Metal Recovery Revenue From Decommissioned Gear
- 4.3 Market Restraints
- 4.3.1 High Capex to Retrofit Legacy Infrastructure
- 4.3.2 Absence of Unified Sustainability KPIs
- 4.3.3 Site Delays for Renewable Micro-Grids
- 4.3.4 Scarcity of Low-Carbon Steel and Recycled Plastics
- 4.4 Industry Value Chain Analysis
- 4.5 Regulatory Landscape
- 4.6 Technological Outlook
- 4.7 Porter's Five Forces Analysis
- 4.7.1 Threat of New Entrants
- 4.7.2 Bargaining Power of Suppliers
- 4.7.3 Bargaining Power of Buyers
- 4.7.4 Threat of Substitutes
- 4.7.5 Competitive Rivalry
- 4.8 Sustainability Focus Area Analysis
- 4.8.1 Energy Efficiency and Carbon Reduction
- 4.8.2 Circular Economy and E-waste Management
- 4.8.3 Renewable Energy Integration
- 4.8.4 Water Stewardship
5 MARKET SIZE AND GROWTH FORECASTS (VALUE)
- 5.1 By Component
- 5.1.1 Solutions
- 5.1.2 Services
- 5.2 By Network Layer
- 5.2.1 Access Network
- 5.2.2 Transport/Backhaul
- 5.2.3 Core Network
- 5.2.4 Data Center and Edge Facilities
- 5.3 By Deployment Model
- 5.3.1 On-premise
- 5.3.2 Cloud/SaaS
- 5.4 By Network Technology
- 5.4.1 5G
- 5.4.2 4G/LTE
- 5.4.3 Fiber (FTTx)
- 5.4.4 Edge Computing/MEC
- 5.4.5 Open RAN
- 5.4.6 Satellite (LEO)
- 5.5 By Operator Type
- 5.5.1 Mobile Network Operators (MNOs)
- 5.5.2 Fixed-line and ISPs
- 5.5.3 Hyperscale Cloud and Content Providers
- 5.5.4 Neutral Hosts and TowerCos
- 5.5.5 Private-Network Enterprises
- 5.6 By Geography
- 5.6.1 North America
- 5.6.1.1 United States
- 5.6.1.2 Canada
- 5.6.1.3 Mexico
- 5.6.2 South America
- 5.6.2.1 Brazil
- 5.6.2.2 Argentina
- 5.6.2.3 Rest of South America
- 5.6.3 Europe
- 5.6.3.1 Germany
- 5.6.3.2 United Kingdom
- 5.6.3.3 France
- 5.6.3.4 Italy
- 5.6.3.5 Spain
- 5.6.3.6 Rest of Europe
- 5.6.4 Asia-Pacific
- 5.6.4.1 China
- 5.6.4.2 Japan
- 5.6.4.3 India
- 5.6.4.4 South Korea
- 5.6.4.5 Rest of Asia-Pacific
- 5.6.5 Middle East and Africa
- 5.6.5.1 Middle East
- 5.6.5.1.1 GCC Countries
- 5.6.5.1.2 Turkey
- 5.6.5.1.3 Rest of Middle East
- 5.6.5.2 Africa
- 5.6.5.2.1 South Africa
- 5.6.5.2.2 Nigeria
- 5.6.5.2.3 Rest of Africa
- 5.6.5.1 Middle East
- 5.6.1 North America
6 COMPETITIVE LANDSCAPE
- 6.1 Market Concentration
- 6.2 Strategic Moves
- 6.3 Market Share Analysis
- 6.4 Company Profiles (includes Global level Overview, Market level overview, Core Segments, Financials as available, Strategic Information, Market Rank/Share for key companies, Products and Services, and Recent Developments)
- 6.4.1 Telefonaktiebolaget LM Ericsson
- 6.4.2 Nokia Corporation
- 6.4.3 Huawei Technologies Co., Ltd.
- 6.4.4 ZTE Corporation
- 6.4.5 Cisco Systems, Inc.
- 6.4.6 Samsung Electronics Co., Ltd.
- 6.4.7 NEC Corporation
- 6.4.8 Fujitsu Limited
- 6.4.9 Dell Technologies Inc.
- 6.4.10 International Business Machines Corporation (IBM)
- 6.4.11 Juniper Networks, Inc.
- 6.4.12 Mavenir Systems, Inc.
- 6.4.13 Parallel Wireless, Inc.
- 6.4.14 Capgemini Engineering (Capgemini SE)
- 6.4.15 Accenture plc
- 6.4.16 Orange S.A.
- 6.4.17 Vodafone Group Plc
- 6.4.18 American Tower Corporation
- 6.4.19 Crown Castle Inc.
- 6.4.20 Digital Realty Trust, Inc.
7 MARKET OPPORTUNITIES AND FUTURE OUTLOOK
- 7.1 White-Space and Unmet-Need Assessment
- 7.2 Analyst Recommendations and Suggestions


