|
시장보고서
상품코드
2073372
지속가능성 소프트웨어 : 시장 점유율 분석, 업계 동향 및 통계, 성장 예측(2026-2031년)Sustainability Software - Market Share Analysis, Industry Trends & Statistics, Growth Forecasts (2026 - 2031) |
||||||
 Mordor Intelligence
Mordor Intelligence에 의하면, 지속가능성 소프트웨어 시장 규모는 2025년에 44억 1,000만 달러로 평가되었습니다. 2026년 52억 1,000만 달러에서 2031년까지 119억 4,000만 달러에 이를 것으로 예상되며, 예측 기간(2026-2031년) CAGR은 18.07%를 나타낼 전망입니다.
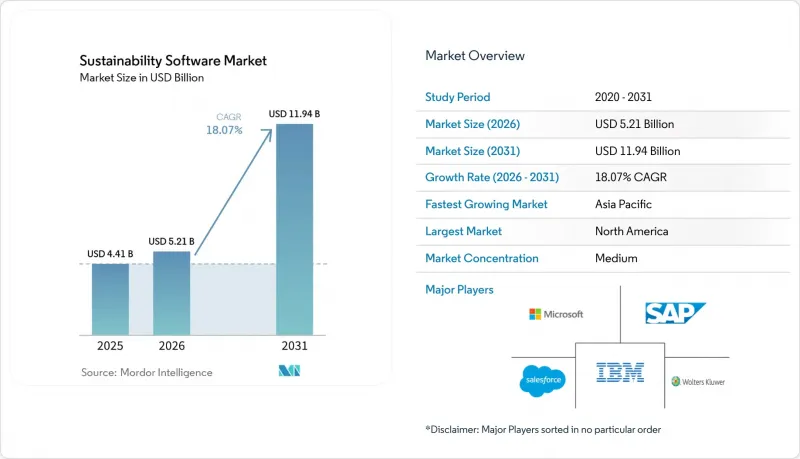
본 보고서는 도입 형태(클라우드, On-Premise, 하이브리드), 소프트웨어 카테고리(탄소 관리 소프트웨어, 지속가능성 보고·관리(ESG) 등), 최종 사용자의 기업 규모(대기업 등), 최종 사용자의 산업 분야(정부·공공 부문, 은행, 금융서비스 및 보험(BFSI), IT 및 통신 등), 지역별로 분류되어 있습니다. 시장 전망은 금액(달러) 기준으로 제시되어 있습니다.
세계의 지속가능성 소프트웨어 시장 동향 및 인사이트
전 세계적으로 강화되고 있는 ESG 공시 규제
법적 구속력을 지닌 규정에 따라, 지속가능성 소프트웨어 시장은 단순한 선택적 분석 도구에서 필수 인프라로 그 위상이 높아지고 있습니다. 미국 증권거래위원회(SEC) 및 EU의 규정에 따라 부정확한 탄소 데이터나 데이터 누락에 대해 엄중한 제재가 부과됨에 따라, 단계적인 제출 기한을 앞두고 기업 전반에 걸친 도입이 가속화되고 있습니다. 제출 단계가 순차적으로 시행됨에 따라, 2028년까지 플랫폼에 대한 지속적인 수요가 예상됩니다.
기업의 탄소 중립 공약이 탄소 회계 수요를 견인하고 있습니다.
야심 찬 목표를 달성하기 위해서는 탄소 관리 소프트웨어를 활용하여 스코프 1-3 배출량을 세밀하게 추적하는 것이 필수적입니다. 34GW가 넘는 재생에너지 계약을 바탕으로, 2030년까지 탄소 네거티브를 달성하겠다는 마이크로소프트의 공약은 소프트웨어가 프로젝트 감독과 배출량 감축 검증에 어떻게 기여할 수 있는지를 보여줍니다. 투자자들이 ESG 성과와 자금 조달을 연계하는 가운데, 경영진의 설명 책임을 다하기 위해서는 견고한 데이터 시스템이 필수적입니다.
숙련된 지속가능성 데이터 분석가의 부족
제조업체의 71%가 사업부 확장을 계획하고 있음에도 불구하고, 탄소 회계 전문가 채용에 어려움을 겪고 있으며, ESG 인력에 대한 수요가 공급을 웃돌고 있습니다. 컨설턴트에 대한 의존은 프로젝트 비용을 상승시키고, 특히 중견 기업의 경우 사내 역량 구축을 지연시키고 있습니다.
부문별 분석
지속가능성 소프트웨어 시장에서는 2025년에 클라우드 도입이 시장 점유율의 59.78%를 차지하며 압도적인 입지를 확립했으나, 하이브리드 구성은 2031년까지 연평균 성장률(CAGR) 19.02%를 나타낼 것으로 전망됩니다. 하이브리드 모델은 클라우드 분석과 On-Premise 에지 처리를 융합하여, 기업이 데이터 소재지에 관한 법규를 준수하면서도 AI를 적극 활용한 예측 능력을 유지할 수 있도록 합니다. 에너지 생산업체와 제조업체들은 슈나이더 일렉트릭의 하이브리드 스위트와 같은 플랫폼을 통합하고, 공장 현장의 센서와 클라우드 대시보드를 연동함으로써 즉각적인 효율 향상을 실현하고 있습니다. 따라서 하이브리드 도입은 규정 준수 및 운영상의 요건을 모두 충족시키며, 지속가능성 소프트웨어 시장의 확대를 이끄는 다음 성장 동력으로 자리매김하고 있습니다.
또한, 하이브리드 아키텍처는 규제 변화에 따라 기업이 처리 부하를 환경 간에 이전할 수 있기 때문에 미래를 내다본 투자라고 할 수 있습니다. 기밀성이 높은 운영 데이터가 관리 구역 외부로 유출되지 않으며, 집계된 인사이트는 기업 차원의 보고서 작성을 위해 안전한 클라우드에 보관되므로 사이버 보안 체계도 강화됩니다. 이러한 유연성 덕분에 전력 사업이나 제약 업계 등 규제가 엄격한 분야에서 보급이 가속화될 것으로 예상되며, 정책 환경의 변화에 대한 지속가능성 소프트웨어 시장의 회복탄력성이 더욱 높아질 것으로 전망됩니다.
2025년에는 지속가능성 보고 및 관리(ESG)가 매출의 39.45%를 차지했으나, 공급망의 지속가능성 관련 용도는 스코프 3과 관련된 시급한 과제를 반영하여 2031년까지 연평균 성장률(CAGR) 19.25%로 성장할 전망입니다. Blue Yonder의 Pledge 인수를 통해 구현된 화물 운송 배출량 자동 계산 모듈은 물류 관리자에게 실시간 CO2e 대시보드와 규정 준수 요건에 즉시 대응할 수 있는 형식을 제공합니다. 이러한 기능을 통해 플랫폼의 가치는 기업 보고서 작성에 그치지 않고, 일상적인 조달 및 운송의 최적화까지 확대되어 지속가능성 소프트웨어 시장의 잠재 고객 기반을 넓히게 될 것입니다.
또한, 성장 요인 중 하나로 다국적 공급업체가 다수의 고객에게 표준화된 데이터를 제공해야 할 필요성이 있습니다. AI 봇이 수천 개공급업체로부터 수치를 요청·검증·정규화함으로써, 중복되는 수작업에 따른 연락을 줄여줍니다. 도입이 하류로 확대됨에 따라, 공급망 도구는 증분 수익에 대한 기여도 측면에서 핵심 ESG 모듈을 능가할 것으로 예상되며, 이는 지속가능성 소프트웨어 시장의 구조적 변화를 여실히 보여주고 있습니다.
지역별 분석
2025년 북미는 지속가능성 소프트웨어 시장의 41.62%를 차지했습니다. 이는 SEC(미국 증권거래위원회)의 공시 규정에 더해, 연방 정부의 조달 지침이 강화됨에 따라 도입이 급속히 촉진되었기 때문입니다. 기업들은 자산 계상 및 의무화된 탄소 데이터를 바탕으로 한 재무제표의 일관성 확보를 서둘렀으며, 한편으로는 풍부한 벤처 자금이 수직형 AI 모델을 구축하는 스타트업을 지원했습니다. 성숙한 컨설팅 생태계 또한 도입을 한층 더 용이하게 만들었습니다.
아시아태평양은 2031년까지 연평균 성장률(CAGR) 18.31%를 나타낼 것으로 예측되며, 이는 지역별로는 가장 높은 성장 속도입니다. 중국에서는 2026년까지 300개 이상의 상장 기업에 대해 지속가능성 보고서 공표를 의무화하고 있으며, 싱가포르 증권거래소도 대부분의 발행사에 대해 기후 변화 보고를 요구하고 있습니다. 급속한 산업화가 진행되는 가운데, 소프트웨어가 설비 개조를 권장함으로써 즉각적인 효율성이 실현되고 있으며, 선전부터 첸나이까지에 이르는 전 제조 거점 지역에서 투자 수익률(ROI) 향상을 뒷받침하는 근거가 더욱 확고해지고 있습니다.
유럽에서는 5만 1,000개 이상의 기업을 대상으로 하는 ‘기업 지속가능성 보고 지침(CSRD)’ 덕분에 규제 주도형 도입이 계속해서 견조한 추세를 보이고 있습니다. “유럽 지속가능성 보고 기준(ESRS)”따라서 세밀한 이중 물질성 평가가 요구되고 있으며, 이는 자동화된 데이터 태깅 및 감사 추적에 대한 수요를 이끌고 있습니다. 하이브리드 소프트웨어와 산업용 제어 시스템을 통합하는 독일의 다국적 기업은 전 세계의 모범 사례에 영향을 미치는 지역적 전문성을 구현하고 있습니다.
기타 혜택 :
- 엑셀 형식 시장 예측(ME) 시트
- 3개월간의 애널리스트 지원
자주 묻는 질문
목차
제1장 서론
제2장 조사 방법
제3장 주요 요약
제4장 시장 구도
제5장 시장 규모 및 성장 예측
제6장 경쟁 구도
제7장 시장 기회 및 향후 동향
KTH 26.07.07According to Mordor Intelligence, the sustainability software market size was valued at USD 4.41 billion in 2025 and estimated to grow from USD 5.21 billion in 2026 to reach USD 11.94 billion by 2031, at a CAGR of 18.07% during the forecast period (2026-2031).
This report is Segmented by Deployment Mode (Cloud, On-Premise, and Hybrid), Software Category (Carbon Management Software, Sustainability Reporting and Management (ESG), and More), End-User Enterprise Size (Large Enterprises, and More), End-User Industry (Government and Public Sector, BFSI, IT and Telecom, and More), and Geography. The Market Forecasts are Provided in Terms of Value (USD).
Global Sustainability Software Market Trends and Insights
ESG-Disclosure Regulations Tightening Worldwide
Binding rules elevate the sustainability software market from optional analytics to mandatory infrastructure. SEC and EU mandates now attach material penalties to inaccurate or missing carbon data, driving enterprise-wide roll-outs ahead of phased submission deadlines. Continuous platform demand is expected through 2028 as successive filing tiers take effect
Corporate Net-Zero Commitments Boost Carbon Accounting Demand
Ambitious targets require granular tracking of Scope 1-3 emissions through carbon management software. Microsoft's pledge to reach carbon negativity by 2030, backed by more than 34 GW of contracted renewable power, illustrates how software enables project oversight and removal verification . As investors link ESG outcomes to capital access, robust data systems become essential for executive accountability.
Shortage of Skilled Sustainability Data Analysts
Demand for ESG talent exceeds supply as 71% of manufacturers plan departmental expansion yet struggle to recruit carbon-accounting specialists. Reliance on consultants raises project costs and slows internal capability building, particularly among mid-market firms.
Other drivers and restraints analyzed in the detailed report include:
- Cost Savings From Energy and Resource Optimisation Analytics
- AI-Driven Scope-3 Data Capture and Automation
- High Upfront Cost of Enterprise-Grade Platforms
For complete list of drivers and restraints, kindly check the Table Of Contents.
Segment Analysis
The sustainability software market saw cloud deployment hold a dominant 59.78% sustainability software market share in 2025, while hybrid configurations are forecast to post a 19.02% CAGR through 2031. Hybrid models blend cloud analytics with on-premise edge processing, letting firms comply with data-residency laws yet maintain AI-heavy forecasting capabilities. Energy producers and manufacturers integrate platforms like Schneider Electric's hybrid suite to synchronise plant-floor sensors with cloud dashboards, capturing immediate efficiency gains . Hybrid adoption therefore satisfies both compliance and operational imperatives, positioning it as the next driver of sustainability software market expansion.
Hybrid architectures also future-proof investments because enterprises can shift processing loads between environments as regulations evolve. Cyber-security postures improve when sensitive operational data never leaves controlled premises, yet aggregated insights still reside in secure clouds for enterprise-level reporting. This flexibility is forecast to accelerate penetration in highly regulated sectors such as power utilities and pharmaceuticals, reinforcing the sustainability software market's resilience to changing policy landscapes.
Sustainability reporting and management (ESG) captured 39.45% of revenue in 2025, but supply-chain sustainability applications are on track for a 19.25% CAGR to 2031, reflecting urgent Scope 3 challenges. Automated freight-emission modules, enabled by Blue Yonder's Pledge acquisition, give logistics managers real-time CO2e dashboards and instant compliance formatting. Such capabilities extend platform value beyond corporate reporting into day-to-day procurement and transport optimisation, widening the sustainability software market addressable base.
Growth also stems from multinational suppliers needing to present standardised data to many customers. AI bots request, validate and normalise figures across thousands of vendors, reducing duplicative manual outreach. As adoption spreads downstream, supply-chain tools are poised to surpass core ESG modules in incremental revenue contribution, underscoring a structural shift in the sustainability software market.
Complete Report Scope:
- By Deployment Mode
- Cloud
- On-Premises
- Hybrid
- By Software Category
- Carbon Management Software
- Sustainability Reporting and Management (ESG)
- Energy and Resource Optimisation
- Compliance and Risk Management
- Supply-Chain Sustainability
- Environment, Health and Safety (EHS)
- By End-user Enterprise Size
- Large Enterprises
- Small and Medium Enterprises (SMEs)
- By End-User Industry
- Government and Public Sector
- BFSI
- IT and Telecom
- Manufacturing and Industrial
- Healthcare and Life Sciences
- Energy and Utilities
- Consumer Goods and Retail
- Other Industries
- By Geography
- North America
- United States
- Canada
- Mexico
- South America
- Brazil
- Argentina
- Rest of South America
- Europe
- Germany
- United Kingdom
- France
- Italy
- Spain
- Russia
- Rest of Europe
- Asia-Pacific
- China
- Japan
- India
- South Korea
- Australia and New Zealand
- Rest of Asia-Pacific
- Middle East and Africa
- Middle East
- Saudi Arabia
- United Arab Emirates
- Turkey
- Rest of Middle East
- Africa
- South Africa
- Nigeria
- Egypt
- Rest of Africa
- Middle East
- North America
Geography Analysis
North America held 41.62% sustainability software market share in 2025 as the SEC disclosure rule, plus strengthened federal procurement guidelines, compelled fast adoption. Enterprises rushed to instrument assets and align financial statements with mandated carbon data, while abundant venture funding supported start-ups building vertical AI models. Mature consulting ecosystems further eased implementation.
Asia-Pacific is projected to register an 18.31% CAGR to 2031, the highest regional pace. China will require over 300 publicly listed firms to publish sustainability reports by 2026, and Singapore's exchanges demand climate reporting for most issuers . Rapid industrialisation produces immediate efficiency gains when software recommends equipment retrofits, bolstering ROI arguments across manufacturing corridors from Shenzhen to Chennai.
Europe continues strong regulatory-driven uptake through the Corporate Sustainability Reporting Directive covering more than 51,000 entities. European Sustainability Reporting Standards call for granular double-materiality assessments, driving demand for automated data tagging and audit trails. German multinationals integrating hybrid software with industrial controls showcase regional expertise that influences global best practice.
- Microsoft Corporation
- SAP SE
- IBM Corporation
- Salesforce, Inc.
- Wolters Kluwer N.V.
- Nasdaq, Inc.
- Diligent Corporation
- Benchmark Digital Partners LLC (Benchmark ESG)
- Schneider Electric SE
- Greenly SAS
- Workiva Inc.
- Persefoni Inc.
- EcoVadis SAS
- Sphera Solutions, Inc.
- Enablon (Schneider Electric subsidiary)
- VelocityEHS
- Cority Software Inc.
- Plan A Earth GmbH
- Carbmee GmbH
- Siemens AG
Additional Benefits:
- The market estimate (ME) sheet in Excel format
- 3 months of analyst support
TABLE OF CONTENTS
1 INTRODUCTION
- 1.1 Market Definition and Study Assumptions
- 1.2 Scope of the Study
2 RESEARCH METHODOLOGY
3 EXECUTIVE SUMMARY
4 MARKET LANDSCAPE
- 4.1 Market Overview
- 4.2 Market Drivers
- 4.2.1 ESG-disclosure regulations tightening worldwide
- 4.2.2 Corporate net-zero commitments boost carbon accounting demand
- 4.2.3 Cost-savings from energy and resource optimisation analytics
- 4.2.4 Investor and stakeholder pressure for transparent ESG data
- 4.2.5 AI-driven Scope-3 data capture and automation
- 4.2.6 Convergence of ESG and financial reporting platforms
- 4.3 Market Restraints
- 4.3.1 Shortage of skilled sustainability data analysts
- 4.3.2 High upfront cost of enterprise-grade platforms
- 4.3.3 Data-sovereignty hurdles for cross-border cloud deployment
- 4.3.4 ESG backlash in certain US states dampening adoption
- 4.4 Value / Supply-Chain Analysis
- 4.5 Evaluation of Critical Regulatory Framework
- 4.6 Impact Assessment of Key Stakeholders
- 4.7 Technological Outlook
- 4.8 Porter's Five Forces Analysis
- 4.8.1 Bargaining Power of Suppliers
- 4.8.2 Bargaining Power of Consumers
- 4.8.3 Threat of New Entrants
- 4.8.4 Threat of Substitutes
- 4.8.5 Intensity of Competitive Rivalry
- 4.9 Impact of Macro-economic Factors
5 MARKET SIZE AND GROWTH FORECASTS (VALUE)
- 5.1 By Deployment Mode
- 5.1.1 Cloud
- 5.1.2 On-Premises
- 5.1.3 Hybrid
- 5.2 By Software Category
- 5.2.1 Carbon Management Software
- 5.2.2 Sustainability Reporting and Management (ESG)
- 5.2.3 Energy and Resource Optimisation
- 5.2.4 Compliance and Risk Management
- 5.2.5 Supply-Chain Sustainability
- 5.2.6 Environment, Health and Safety (EHS)
- 5.3 By End-user Enterprise Size
- 5.3.1 Large Enterprises
- 5.3.2 Small and Medium Enterprises (SMEs)
- 5.4 By End-User Industry
- 5.4.1 Government and Public Sector
- 5.4.2 BFSI
- 5.4.3 IT and Telecom
- 5.4.4 Manufacturing and Industrial
- 5.4.5 Healthcare and Life Sciences
- 5.4.6 Energy and Utilities
- 5.4.7 Consumer Goods and Retail
- 5.4.8 Other Industries
- 5.5 By Geography
- 5.5.1 North America
- 5.5.1.1 United States
- 5.5.1.2 Canada
- 5.5.1.3 Mexico
- 5.5.2 South America
- 5.5.2.1 Brazil
- 5.5.2.2 Argentina
- 5.5.2.3 Rest of South America
- 5.5.3 Europe
- 5.5.3.1 Germany
- 5.5.3.2 United Kingdom
- 5.5.3.3 France
- 5.5.3.4 Italy
- 5.5.3.5 Spain
- 5.5.3.6 Russia
- 5.5.3.7 Rest of Europe
- 5.5.4 Asia-Pacific
- 5.5.4.1 China
- 5.5.4.2 Japan
- 5.5.4.3 India
- 5.5.4.4 South Korea
- 5.5.4.5 Australia and New Zealand
- 5.5.4.6 Rest of Asia-Pacific
- 5.5.5 Middle East and Africa
- 5.5.5.1 Middle East
- 5.5.5.1.1 Saudi Arabia
- 5.5.5.1.2 United Arab Emirates
- 5.5.5.1.3 Turkey
- 5.5.5.1.4 Rest of Middle East
- 5.5.5.2 Africa
- 5.5.5.2.1 South Africa
- 5.5.5.2.2 Nigeria
- 5.5.5.2.3 Egypt
- 5.5.5.2.4 Rest of Africa
- 5.5.5.1 Middle East
- 5.5.1 North America
6 COMPETITIVE LANDSCAPE
- 6.1 Market Concentration
- 6.2 Strategic Moves
- 6.3 Market Share Analysis
- 6.4 Company Profiles (includes Global level Overview, Market level overview, Core Segments, Financials as available, Strategic Information, Market Rank/Share for key companies, Products and Services, and Recent Developments)
- 6.4.1 Microsoft Corporation
- 6.4.2 SAP SE
- 6.4.3 IBM Corporation
- 6.4.4 Salesforce, Inc.
- 6.4.5 Wolters Kluwer N.V.
- 6.4.6 Nasdaq, Inc.
- 6.4.7 Diligent Corporation
- 6.4.8 Benchmark Digital Partners LLC (Benchmark ESG)
- 6.4.9 Schneider Electric SE
- 6.4.10 Greenly SAS
- 6.4.11 Workiva Inc.
- 6.4.12 Persefoni Inc.
- 6.4.13 EcoVadis SAS
- 6.4.14 Sphera Solutions, Inc.
- 6.4.15 Enablon (Schneider Electric subsidiary)
- 6.4.16 VelocityEHS
- 6.4.17 Cority Software Inc.
- 6.4.18 Plan A Earth GmbH
- 6.4.19 Carbmee GmbH
- 6.4.20 Siemens AG
7 MARKET OPPORTUNITIES AND FUTURE TRENDS
- 7.1 White-space and Unmet-need Assessment