
|
시장보고서
상품코드
2061747
IT 디바이스 : 시장 점유율 분석, 업계 동향 및 통계, 성장 예측(2026-2031년)IT Device - Market Share Analysis, Industry Trends & Statistics, Growth Forecasts (2026 - 2031) |
||||||
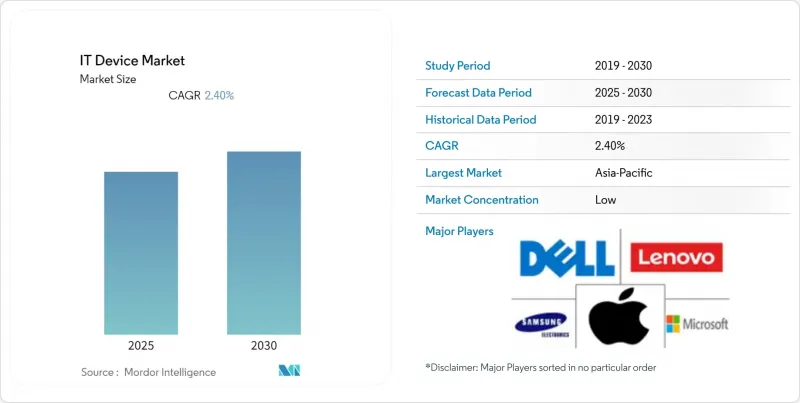
Mordor Intelligence에 의하면, IT 디바이스 시장 규모는 2025년 2조 1,400억 달러로 평가되었습니다. 2026년 2조 3,450억 달러로 확대되어 2031년까지 3조 4,900억 달러에 이를 것으로 예측되며, 2026년부터 2031년에 걸쳐 CAGR은 8.33%를 나타낼 전망입니다.

본 보고서는 기기 유형(스마트폰, 노트북, 데스크톱 PC, 태블릿, 웨어러블, 프린터 및 주변기기, 외부 저장 장치), 최종 사용자 산업(일반 소비자, 기타), 연결 기술(유선, Wi-Fi, 기타), 유통 채널(온라인 소매, 오프라인 소매, 직접 판매, 부가가치 재판매업체), 지역별로 분류되어 있습니다. 시장 전망은 금액(달러) 기준으로 제시되어 있습니다.
세계의 IT 디바이스 시장 동향과 인사이트
엣지 AI 칩 통합을 통한 기기 내 처리 구현
신경망 처리 장치(NPU)는 데이터센터에서 일반 스마트폰, 노트북, 태블릿으로 확대 적용되고 있으며, 클라우드 지연 없이 생성형 AI를 위한 실시간 추론을 실현하고 있습니다. 퀄컴의 Snapdragon X2 Elite는 50 TOPS를 달성한 반면, Arm의 Ethos-U85 microNPU는 상시 가동형 웨어러블 기기를 대상으로 하고 있습니다. 유럽연합(EU)과 중국의 데이터 주권법에서는 기밀 데이터를 로컬 기기에 저장하도록 의무화하고 있으며, 이에 따라 기업들은 양자화된 대규모 언어 모델을 직접 실행할 수 있는 하드웨어를 찾고 있습니다. 안드로이드 기기에 탑재된 구글의 Coral Edge TPU는 물체 감지 지연 시간을 4밀리초로 단축하여, 클라우드 기반 방식에 비해 10배나 개선된 성능을 실현했습니다. 기존 프로세서는 최신 추론 워크로드를 효율적으로 지원하지 못하기 때문에 현재 기기 교체 주기에서는 AI 가속기의 성능을 중시하는 추세입니다.
5G 확산 가속화가 기기 교체 주기를 촉진
GSMA의 조사에 따르면, 2025년 말까지 전 세계 5G 독립형 코어의 보급률은 17.6%에 달했으며, 비독립형 방식에 비해 다운로드 속도의 중앙값이 40% 향상되었습니다. Ookla는 한국 및 미국 일부 지역에서 20밀리초 미만의 지연 시간이 일관되게 유지되고 있음을 확인했으며, 이를 통해 클라우드 게임 및 증강현실(AR)과 같은 활용 사례가 가능해졌습니다. Allianz의 조사에 따르면, 소비자들이 5G만을 목적으로 단말기를 업그레이드하는 것은 아닌 것으로 밝혀졌지만, 기업에서는 실시간 재고 관리 및 자율주행차 수요에 대응하기 위해 내환경성 태블릿과 스캐너의 교체가 진행되고 있습니다. 공장 및 항만에서의 사설 5G 도입은 모바일 컴퓨터의 표준 사양을 한 단계 높여, IT 디바이스 시장에 추가적인 수요를 창출하고 있습니다.
첨단 칩에 대한 접근을 제한하는 지정학적 수출 규제
미국 산업안보국(BIS)은 2024년 10월, 300 TOPS 또는 1,200 TOPS/mm²를 초과하는 무허가 수출에 상한선을 설정함으로써, 칩 제조업체들이 중국 수출용으로는 성능을 제한한 변형 제품을 생산하도록 강요했습니다. 현재 동남아시아의 유통업체들은 최종 용도 확인을 의무화하고 있으며, 이로 인해 납기가 지연되고 규정 준수 관련 부담이 증가하고 있습니다. 화웨이는 2025년에 부품 비용이 18% 급증했다고 밝혔으나, 이 회사의 프리미엄 스마트폰은 세계 선도 기업들에 비해 공정 기술에서 2세대 뒤처져 있습니다. 중국의 각 OEM 기업들은 국내 생산 계획을 가속화하고 있지만, 최첨단 기술 수준에 도달하기까지는 여전히 3년에서 5년이 소요될 것으로 예상되며, 이로 인해 프리미엄 기기의 혁신이 저해되고 전 세계 IT 디바이스 시장의 성장 여력이 둔화되고 있습니다.
부문별 분석
웨어러블 기기는 연평균 성장률(CAGR) 9.73%로 가장 높은 성장률을 기록한 반면, 스마트폰 시장은 2025년 IT 디바이스 시장 총액의 41.32%를 차지했습니다. 메타는 전 세계 XR 헤드셋 출하량의 50.8%를 차지하며, 소비자들의 친숙함이 기업용 시범 도입으로 확대되고 있음을 보여주고 있습니다. Withings BeamO Pro와 같은 통신 기능을 갖춘 건강 모니터는 의학적 유용성과 소비자의 편의성을 결합하여 적용 가능한 이용 사례를 확대되고 있습니다. 1,500달러를 넘는 가격대의 폴더블 스마트폰은 초고급 틈새 시장을 형성하고 있지만, 그 출하 대수는 주류 모델에 비해 여전히 적은 임베디드니다. 한편, 프린터는 디지털화로 인한 대체 위협에 직면해 있으며, 새로운 성장 분야는 산업용 라벨과 3D 프로토타이핑으로 한정되어 있습니다. 시게이트와 웨스턴디지털이 기존의 기계식 드라이브를 단계적으로 단종하고 대용량 니어라인 제품에 주력하는 가운데, 외장형 스토리지는 솔리드 스테이트 솔루션으로 전환되고 있습니다.
태블릿과 노트북은 상반된 추세를 보이고 있습니다. 클라우드를 통한 생산성 향상으로 인해 기술직 이외의 직무에서 고성능 데스크톱 PC의 필요성은 최소화되고 있지만, 하이브리드 근무 방식의 확산으로 인해 화상 회의에 대응하기 위한 초경량 노트북으로의 교체 수요가 증가하고 있습니다. 퀄컴의 스냅드래곤 X2 엘리트(Snapdragon X2 Elite)는 팬이 없는 설계의 기업용 노트북을 구현하여 x86 아키텍처의 기득권에 도전하는 동시에, 하루 배터리 사용 시간을 20시간 이상으로 연장했습니다. 데스크톱 PC 시장은 게이밍이나 워크스테이션과 같은 틈새 시장으로 축소되고 있으며, 이 시장에서는 휴대성보다 전용 그래픽 카드와 개방형 아키텍처가 더 중요시되고 있습니다. 한편, 웨어러블 기기는 피트니스, 업무용, 산업용 등 다양한 유형으로 세분화되면서 IT 디바이스 시장 내 각 카테고리의 전문화를 더욱 강화하고 있습니다.
2025년 매출액에서 소비자 지출이 차지하는 비중은 52.64%였으나, 의료 분야는 2031년까지 연평균 성장률(CAGR) 9.53%를 기록하며 모든 업종을 앞질렀습니다. 병원들이 지속적인 모니터링 시스템을 도입함에 따라, 클라우드 연결형 의료기기의 IT 디바이스 시장 점유율은 확대되고 있으며, 2029년까지 1,206억 달러에 달할 것으로 전망됩니다. Philips는 Respiree사와 제휴하여 FDA 승인을 받은 심폐 센서를 웨어러블 기기에 탑재했습니다. 한편, 시스코의 Wi-Fi 7 백본은 환자 데이터를 실시간으로 집계합니다. 정부 조달에서는 사이버 보안 인증을 받은 하드웨어가 중시되고 있으며, 교육 예산은 팬데믹 당시의 정점 수준에서 크롬북의 꾸준한 교체로 전환되고 있습니다. 산업 및 제조 분야의 사용자들은 자율주행차의 조정 및 품질 관리를 위해 프라이빗 5G와 통합된 내환경성 태블릿을 도입하고 있습니다.
기업의 구매 담당자들은 하이브리드 근무 환경에서 다중 기기 환경을 유지하고 있으며, 생체 인증을 통한 보안 및 엔드포인트 관리를 요구하고 있습니다. ‘의료기기로서의 소프트웨어(Software-as-a-medical-device)’는 승인 절차를 신속하게 하고, 임상의와 개발자 간의 피드백 루프를 강화하고 있습니다. 선진 지역의 소비자 시장이 포화 상태에 이르면서 판매량 증가세는 신흥 시장으로 이동하고 있지만, 프리미엄 기기에 대한 수요는 견조한 추세를 보이며 가치 성장을 유지하고 있습니다. 전반적으로, 헬스케어 및 엔터프라이즈 부문이 맞물려 IT 디바이스 시장의 이익률 확대를 주도하고 있습니다.
지역별 분석
북미는 프리미엄 기기에 대한 수요와 하이브리드 근무를 위한 하드웨어 업그레이드에 힘입어 2025년 매출의 34.98%를 차지했습니다. Workwize의 조사에 따르면, 직원 1인당 엔드포인트 수는 평균 2.3대이며, 이 지표는 기기의 수명이 점차 길어지고 있음에도 불구하고 교체 수요를 부추기고 있습니다. 엔드포인트 보안에 대한 투자가 평균 판매 가격을 끌어올리고 있으며, 국경을 초월한 전자상거래로 인해 미국 제품이 경쟁력 있는 가격으로 캐나다와 멕시코로 유입되고 있습니다. 규제 당국의 감독은 하드웨어 수입 관세보다 데이터 개인정보 보호에 중점을 두고 있으며, 이는 역내 무역의 원활한 진행을 뒷받침하고 있습니다.
2031년까지 연평균 9.38%의 성장이 예상되는 아시아태평양은 제조 거점의 이전과 급증하는 중산층 수요라는 두 가지 요인으로부터 혜택을 받고 있습니다. 인도의 생산 연계형 인센티브 제도에 따라 450억 달러 규모의 전자기기 수출이 승인됨에 따라, 폭스콘과 삼성 등이 생산 능력 확대에 나서고 있습니다. 베트남의 1,740억 달러에 달하는 전자기기 수출은 중국에 대한 의존도를 줄이려는 다각화 노력을 보여주고 있지만, 대외 수요에 대한 의존도가 높기 때문에 세계 무역 정책의 변동에 영향을 받기 쉬운 상황에 놓여 있습니다. 해당 지역의 PC 출하 대수는 메모리 부족 현상이 완화되면 회복될 것으로 예상되며, 이는 현지 IT 디바이스 시장을 지탱하는 하드웨어 유통에 탄력을 줄 것으로 보입니다.
유럽에서는 경제의 불확실성 속에서도 꾸준한 성장이 예상되며, 장비 교체를 촉진하는 강력한 규제 요인이 존재합니다. 2025년 6월에 발효된 유럽연합(EU)의 에코디자인 규정에서는 7년간의 부품 공급 의무와 수리 가능성 점수 표기가 의무화되어 있어, 2022년 이전의 많은 모델이 규정을 준수하지 못하게 됩니다. 모듈식 설계를 도입한 제조업체는 선점 우위를 확보할 수 있는 반면, 소매업체는 규정 준수 기한을 맞추기 위해 다양한 재고를 관리해야 합니다. 남미에서는 스마트폰 보급이 확대되고 있는 브라질과, 정부의 디지털화 정책에 따라 교육용 태블릿이 도입되고 있는 아르헨티나에서 성장이 집중되고 있습니다. 중동 및 아프리카는 소규모 기반에서 점차 확대되고 있으며, 걸프협력회의(GCC) 회원국에서는 5G 네트워크 구축에 따라 기업의 하드웨어 사양이 향상되고 있는 반면, 아프리카 시장에서는 구매력에 걸맞은 저가형 스마트폰이 선호되고 있습니다.
기타 혜택 :
- 엑셀 형식 시장 예측(ME) 시트
- 3개월간의 애널리스트 지원
자주 묻는 질문
목차
제1장 서론
제2장 조사 방법
제3장 주요 요약
제4장 시장 구도
제5장 시장 규모 및 성장 예측
제6장 경쟁 구도
제7장 시장 기회 및 향후 전망
KTH 26.06.22According to Mordor Intelligence, the iT device market size is expected to increase from USD 2.14 trillion in 2025 to USD 2.345 trillion in 2026 and reach USD 3.49 trillion by 2031, growing at a CAGR of 8.33% over 2026-2031.
This report is Segmented by Device Type (Smartphones, Laptops, Desktops, Tablets, Wearables, Printers and Peripherals, and External Storage Devices), End-User Industry (Consumer, and More), Connectivity Technology (Wired, Wi-Fi, and More), Distribution Channel (Online Retail, Offline Retail, Direct Sales, and Value-Added Resellers), and Geography. The Market Forecasts are Provided in Terms of Value (USD).
Global IT Device Market Trends and Insights
Edge-AI Chip Integration Enabling On-Device Processing
Neural processing units are migrating from data centers into mainstream smartphones, laptops, and tablets, bringing real-time inference for generative artificial intelligence without cloud latency. Qualcomm's Snapdragon X2 Elite hits 50 TOPS, while Arm's Ethos-U85 microNPU targets always-on wearables. Data-sovereignty laws in the European Union and China require sensitive data to be stored on local devices, pushing enterprises to demand hardware that can run quantized large-language models directly. Google's Coral Edge TPU, added to Android handsets, achieved 4-millisecond object-detection latency, a tenfold improvement over cloud paths. Device replacement cycles now pivot on AI accelerator capabilities because legacy processors cannot efficiently support modern inference workloads.
Accelerating 5G Roll-Outs Boosting Device Refresh Cycles
GSMA recorded 17.6% global penetration of 5G standalone cores by late 2025, delivering median download speeds 40% higher than those of non-standalone builds. Ookla confirmed consistent sub-20-millisecond latency in South Korea and parts of the United States, unlocking cloud gaming and augmented-reality use cases. Although Allianz found consumers did not upgrade solely for 5G, enterprises are replacing ruggedized tablets and scanners to meet real-time inventory and autonomous vehicle demands. Private 5G in factories and ports raises the baseline specifications for mobile computers, injecting incremental volumes into the IT device market.
Geopolitical Export Controls Limiting Advanced Chip Access
The United States Bureau of Industry and Security capped unlicensed shipments above 300 TOPS or 1,200 TOPS/mm2 in October 2024, forcing chipmakers to build detuned variants for China. Distributors in Southeast Asia now require end-use verification, delaying deliveries and adding compliance overhead. Huawei disclosed a 18% surge in component costs in 2025, while its premium phones lag two process nodes behind global leaders. Chinese OEMs are accelerating domestic fabrication plans, yet leading-edge parity remains three to five years away, restraining premium device innovation and tempering the IT device market's global upside.
Other drivers and restraints analyzed in the detailed report include:
- Hybrid Work Models Sustaining Multi-Device Demand
- Emergence of XR-Ready Wearables for Enterprise Training
- Intensifying Second-Hand Device Ecosystem Cannibalizing New Sales
For complete list of drivers and restraints, kindly check the Table Of Contents.
Segment Analysis
Wearables posted the highest growth at a 9.73% CAGR, while smartphones retained 41.32% of the 2025 value in the IT device market. Meta commanded 50.8% of global XR headset shipments, proving consumer familiarity now extends into enterprise pilots. Cellular-enabled health monitors such as Withings BeamO Pro merge medical utility with consumer convenience, widening addressable use cases. Foldable phones priced above USD 1,500 create a super-premium niche, but their volumes remain small relative to mainstream models. Meanwhile, printers confront digital substitution, with new growth limited to industrial labels and 3D prototyping. External storage migrates to solid-state solutions as Seagate and Western Digital phase out legacy mechanical drives in favor of high-capacity nearline offerings.
Tablets and laptops experience divergent dynamics. Cloud productivity minimizes the need for high-spec desktops in non-technical roles, yet hybrid work catalyzes ultralight laptop upgrades to support video collaboration. Qualcomm's Snapdragon X2 Elite enables fanless enterprise laptops, challenging x86 incumbency and extending daily battery life beyond 20 hours. Desktops withdraw into gaming and workstation niches where discrete graphics and open architecture outweigh mobility. Wearables, however, diversify into fitness, professional, and industrial variants, reinforcing specialization across device categories inside the IT device market.
Consumer spending accounted for 52.64% of revenue in 2025, but healthcare outpaced all verticals with a 9.53% CAGR through 2031. The IT device market share for cloud-connected medical equipment is accelerating as hospitals deploy continuous monitoring systems, projected to reach USD 120.6 billion by 2029. Philips partnered with Respiree to embed FDA-cleared cardio-respiratory sensors into wearables, while Cisco's Wi-Fi 7 backbone aggregates patient data in real time. Government procurement focuses on cybersecurity-validated hardware, and education budgets shift from pandemic peaks to steady Chromebook replacements. Industrial and manufacturing users install ruggedized tablets integrated with private 5G for autonomous vehicle coordination and quality control.
Enterprise buyers maintain multi-device setups in hybrid work environments, demanding biometric security and endpoint management. Software-as-a-medical-device fast-tracks approvals, tightening feedback loops between clinicians and developers. Consumer saturation in developed regions pushes volume gains toward emerging markets, yet premium device demand remains resilient, preserving value growth. Overall, the healthcare and enterprise segments collectively drive margin expansion in the IT device market.
Geography Analysis
North America accounted for 34.98% of 2025 revenue, underpinned by premium device demand and hybrid-work hardware upgrades. Workwize documented employees averaging 2.3 endpoints, a metric that pushes replacement volumes even as lifespans edge upward. Endpoint security investments bolster average selling prices, and cross-border e-commerce funnels United States offerings into Canada and Mexico at competitive rates. Regulatory scrutiny remains focused on data privacy rather than hardware import duties, sustaining smooth intra-regional trade.
Asia-Pacific, forecast to grow at 9.38% through 2031, benefits from both manufacturing migration and burgeoning middle-class demand. India's production-linked incentive scheme approved USD 45 billion in electronics exports, drawing Foxconn and Samsung to expand capacity. Vietnam's USD 174 billion in electronics exports illustrate diversification away from China, though reliance on external demand exposes it to swings in global trade policy. The region's personal computer shipments are expected to rebound once memory constraints ease, reinforcing hardware flows that feed the local IT device market.
Europe experiences measured gains amid economic uncertainty, with robust regulatory triggers for device replacement. The European Union's ecodesign rules, effective June 2025, mandate seven-year spare-parts availability and visible repairability scores, rendering many pre-2022 models non-compliant. Manufacturers that respond with modular designs gain an early-mover edge, while retailers manage mixed inventories to meet compliance deadlines. South America concentrates growth in Brazil, where smartphone adoption is expanding, and Argentina, where government digital initiatives are procuring education tablets. Middle East and Africa advance from smaller bases, with Gulf Cooperation Council countries deploying 5G networks that elevate enterprise hardware specifications, while African markets favor budget smartphones aligned with purchasing power.
- Apple Inc.
- Samsung Electronics Co., Ltd.
- Dell Technologies Inc.
- HP Inc.
- Lenovo Group Limited
- ASUSTeK Computer Inc.
- Acer Inc.
- Huawei Technologies Co., Ltd.
- Xiaomi Corporation
- Microsoft Corporation
- LG Electronics Inc.
- Sony Group Corporation
- Fujitsu Limited
- Panasonic Holdings Corporation
- Toshiba Electronic Devices and Storage Corporation
- Zebra Technologies Corporation
- Seagate Technology Holdings plc
- Western Digital Corporation
- Canon Inc.
- Brother Industries, Ltd.
Additional Benefits:
- The market estimate (ME) sheet in Excel format
- 3 months of analyst support
TABLE OF CONTENTS
1 INTRODUCTION
- 1.1 Study Assumptions and Market Definition
- 1.2 Scope of the Study
2 RESEARCH METHODOLOGY
3 EXECUTIVE SUMMARY
4 MARKET LANDSCAPE
- 4.1 Market Overview
- 4.2 Market Drivers
- 4.2.1 Accelerating 5G Roll-outs Boosting Device Refresh Cycles
- 4.2.2 Edge-AI Chip Integration Enabling On-Device Processing
- 4.2.3 Hybrid Work Models Sustaining Multi-Device Demand
- 4.2.4 Emergence of XR-Ready Wearables for Enterprise Training
- 4.2.5 Growing E-waste Regulations Spurring Modular Designs
- 4.2.6 Semiconductor Supply Diversification Mitigating Price Volatility
- 4.3 Market Restraints
- 4.3.1 Geopolitical Export Controls Limiting Advanced Chip Access
- 4.3.2 Consumer Device Saturation in Developed Economies
- 4.3.3 Rising Cyber-security Certification Costs for OEMs
- 4.3.4 Intensifying Second-hand Device Ecosystem Cannibalizing New Sales
- 4.4 Impact of Macroeconomic Factors on the Market
- 4.5 Industry Value Chain Analysis
- 4.6 Regulatory Landscape
- 4.7 Technological Outlook
- 4.8 Porter's Five Forces Analysis
- 4.8.1 Bargaining Power of Suppliers
- 4.8.2 Bargaining Power of Buyers
- 4.8.3 Threat of New Entrants
- 4.8.4 Threat of Substitutes
- 4.8.5 Intensity of Competitive Rivalry
5 MARKET SIZE AND GROWTH FORECASTS (VALUE)
- 5.1 By Device Type
- 5.1.1 Smartphones
- 5.1.2 Laptops
- 5.1.3 Desktops
- 5.1.4 Tablets
- 5.1.5 Wearables
- 5.1.6 Printers and Peripherals
- 5.1.7 External Storage Devices
- 5.2 By End-User Industry
- 5.2.1 Consumer
- 5.2.2 Enterprise
- 5.2.3 Government
- 5.2.4 Education
- 5.2.5 Healthcare
- 5.2.6 Industrial and Manufacturing
- 5.3 By Connectivity Technology
- 5.3.1 Wired
- 5.3.2 Wi-Fi
- 5.3.3 Cellular (4G/5G)
- 5.3.4 Bluetooth
- 5.3.5 Near-Field Communication
- 5.4 By Distribution Channel
- 5.4.1 Online Retail
- 5.4.2 Offline Retail
- 5.4.3 Direct Sales
- 5.4.4 Value-Added Resellers
- 5.5 By Geography
- 5.5.1 North America
- 5.5.1.1 United States
- 5.5.1.2 Canada
- 5.5.1.3 Mexico
- 5.5.2 South America
- 5.5.2.1 Brazil
- 5.5.2.2 Argentina
- 5.5.2.3 Rest of South America
- 5.5.3 Europe
- 5.5.3.1 United Kingdom
- 5.5.3.2 Germany
- 5.5.3.3 France
- 5.5.3.4 Italy
- 5.5.3.5 Spain
- 5.5.3.6 Rest of Europe
- 5.5.4 Asia-Pacific
- 5.5.4.1 China
- 5.5.4.2 Japan
- 5.5.4.3 India
- 5.5.4.4 South Korea
- 5.5.4.5 Rest of Asia-Pacific
- 5.5.5 Middle East and Africa
- 5.5.5.1 Middle East
- 5.5.5.1.1 United Arab Emirates
- 5.5.5.1.2 Saudi Arabia
- 5.5.5.1.3 Rest of Middle East
- 5.5.5.2 Africa
- 5.5.5.2.1 South Africa
- 5.5.5.2.2 Egypt
- 5.5.5.2.3 Rest of Africa
- 5.5.5.1 Middle East
- 5.5.1 North America
6 COMPETITIVE LANDSCAPE
- 6.1 Market Concentration
- 6.2 Strategic Moves
- 6.3 Market Share Analysis
- 6.4 Company Profiles (includes Global Level Overview, Market Level Overview, Core Segments, Financials as available, Strategic Information, Market Rank/Share, Products and Services, Recent Developments)
- 6.4.1 Apple Inc.
- 6.4.2 Samsung Electronics Co., Ltd.
- 6.4.3 Dell Technologies Inc.
- 6.4.4 HP Inc.
- 6.4.5 Lenovo Group Limited
- 6.4.6 ASUSTeK Computer Inc.
- 6.4.7 Acer Inc.
- 6.4.8 Huawei Technologies Co., Ltd.
- 6.4.9 Xiaomi Corporation
- 6.4.10 Microsoft Corporation
- 6.4.11 LG Electronics Inc.
- 6.4.12 Sony Group Corporation
- 6.4.13 Fujitsu Limited
- 6.4.14 Panasonic Holdings Corporation
- 6.4.15 Toshiba Electronic Devices and Storage Corporation
- 6.4.16 Zebra Technologies Corporation
- 6.4.17 Seagate Technology Holdings plc
- 6.4.18 Western Digital Corporation
- 6.4.19 Canon Inc.
- 6.4.20 Brother Industries, Ltd.
7 MARKET OPPORTUNITIES AND FUTURE OUTLOOK
- 7.1 White-Space and Unmet-Need Assessment
