
|
시장보고서
상품코드
2061754
내륙 수로 화물 운송 시장 : 시장 점유율 분석, 업계 동향 및 통계, 성장 예측(2026-2031년)Inland Water Freight Transport - Market Share Analysis, Industry Trends & Statistics, Growth Forecasts (2026 - 2031) |
||||||
 Mordor Intelligence
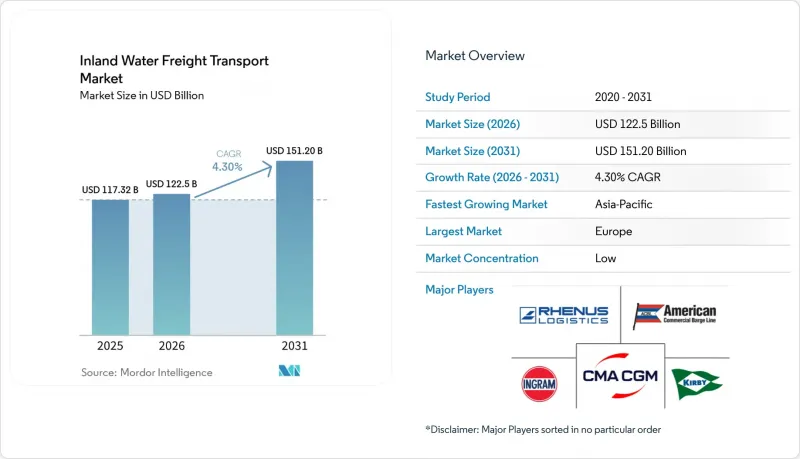
Mordor Intelligence에 의하면, 내륙 수로 화물 운송 시장 규모는 2025년 1,173억 2,000만 달러로 평가되었고, 2026년에는 1,225억 달러로 추정되고, 2031년까지 1,512억 달러에 이를 것으로 예상되며, 2026-2031년 CAGR 4.3%로 성장할 전망입니다.
본 보고서는 운송 형태별(액체 벌크, 건식 벌크, 컨테이너 화물, 롤온 및 롤오프 화물), 최종 사용자 산업별(농업 및 식품, 야금 및 광업, 석유 및 화학, 건설, 에너지 등), 그리고 지역별(북미, 남미, 유럽, 아시아태평양 등)로 분류되어 있습니다. 시장 전망은 금액(달러) 기준으로 제시되어 있습니다.
세계의 내륙 수로 화물 운송 시장 동향 및 인사이트
재생 가능 연료 및 바이오 원료의 무역 흐름 확대
저탄소 물류를 장려하는 재생 가능 연료 기준(RFS)의 의무화에 따라, 미국 멕시코만 연안 회랑을 통한 식물성 기름, 동물성 지방, 농업 잔여물의 바지선 운송량은 2024-2025년 127% 증가했습니다. 마라톤 페트롤리엄사는 미주리강을 항해하는 바지선을 이용해, 1억 8,400만 갤런의 생산 능력을 갖춘 노스다코타주의 재생 가능 디젤 복합 시설로 원료를 수송하고 있으며, 수십 년에 걸친 수송 물량을 확보하고 있습니다. 유럽에서도 비슷한 추세가 나타나고 있으며, IMO의 2030년 탄소 집약도 목표에 힘입어 라인·마인·도나우 강 유역에서 유채유와 사용 후 식용유의 운송량이 증가하고 있습니다. 조류 유래 오일이나 리그노셀룰로오스계 바이오매스에 대한 기회도 확대되고 있지만, 이러한 차세대 소재를 위한 저장 및 취급 인프라는 시범 거점 이외의 지역에서는 여전히 부족한 실정입니다. 탱크 세척 절차와 온도 조절이 가능한 화물실을 표준화한 사업자들은 선구자로서 가격 결정력을 확보하고 있습니다.
전기차 공급망용 중요 광물 물류의 급증
중국의 양쯔강에서는 2025년에 배터리용 리튬, 코발트, 니켈, 흑연이 230만 톤 운송되었으며, 2023년의 89만 톤에서 증가했습니다. 이는 심해 항로 근처에 기가팩토리가 집중되어 있음을 반영하고 있습니다. 인도네시아의 니켈 광석 수출 금지 조치로 인해 국내 제련이 의무화됨에 따라, 강을 항행하는 바지선이 술라웨시 섬의 광산에서 연안의 공장으로 광석을 수송하고 있습니다. 이와 유사한 정책 전환이 칠레와 아르헨티나에서도 바지선 수요를 촉진하고 있습니다. 자동차 제조업체들은 현재 감사 가능한 저탄소 운송을 요구하고 있으며, 블록체인 기반의 보관 기록을 통합한 사업자는 추가 요금을 청구할 수 있게 되었습니다. 고밀도 금속의 물류 비용을 최대 25% 절감하는 수로 운송이 부상함에 따라, 장거리 트럭 운송 수요도 마찬가지로 감소하고 있습니다.
침입성 수생 잡초의 확산이 준설 비용을 끌어올리고 있습니다.
수련풀의 확산으로 인해 인도의 내수운하 1호선에서는 연간 450카롤 루피(5,400만 달러)를 방제 비용으로 지출할 수밖에 없게 되었으며, 이는 운영 예산의 23%에 해당합니다. 메콩 델타의 수로에서는 2023-2025년 방제 비용으로 1,800만 달러를 지출했음에도 불구하고, 수생 식물의 피복률이 40% 증가했습니다. 이로 인해 선저의 안전한 여유 공간을 확보하기 위해 바지선은 적재량을 15-20% 줄일 수밖에 없게 되었습니다. 기후 온난화로 인해 확산 속도가 빨라지고 있으며, 생물학적 방제가 효과를 발휘하기까지 3-5년이 소요되기 때문에 비용 부담은 여전히 높은 수준을 유지하고 있습니다.
부문별 분석
2025년, 액체 벌크 운송은 내륙 수로 화물 운송 운송 시장 점유율에서 가장 높은 36.54%를 차지했으며, 정유 단지 주변에 집중된 석유 및 화학제품 무역이 이를 뒷받침했습니다. 그러나 재생에너지 거점 인근에서 재생 가능 원료로의 전환 및 현지 화학제품 생산으로의 전환에 따라 장기적인 수송량은 억제되고 있으며, 선단은 스테인리스 탱크 및 가열 파이프라인으로의 개조를 추진하고 있습니다. 반면, 건식 벌크 부문은 모래, 자갈, 시멘트에 대한 인프라 메가 프로젝트 수요와, 저비용의 인바운드 물류를 실현하기 위해 강변에 입지한 기가팩토리로 유입되는 중요 광물의 흐름에 힘입어 연평균 성장률(CAGR) 4.58%를 기록하며 모든 부문 중 가장 높은 성장세를 보일 것으로 전망됩니다.
자율 항해 기술은 건화물 운송에 특히 적합합니다. 화물의 형태가 표준화되어 있기 때문에 알고리즘을 활용한 적재 계획 및 푸시-컨보이 편성이 용이해지며, 운항 사업자는 승무원 비용을 최대 70%까지 절감할 수 있기 때문입니다. 컨테이너 화물은 정체 현상이 없는 내륙 항구가 마이크로 풀필먼트 센터와 연계하여 도시 지역으로의 당일 배송을 조정하는 모델을 통해 성장세가 가속화되고 있습니다. 이 모델은 현재 대도시권의 전자상거래 보충 물량의 3-5%를 차지했습니다. 롤온·롤오프(RoRo)는 여전히 틈새 시장이지만, 대용량 배터리 운송에 있어 수로가 지닌 안전상의 이점을 활용하여 전기차 운송 분야에서 그 입지를 넓혀가고 있습니다.
지역별 분석
2025년, 유럽은 세계 시장의 44.32%를 차지했습니다. 이는 라인·마인·도나우 강 유역에 걸쳐 8,000킬로미터에 달하는 밀집된 네트워크와, 수소 인프라에 15억 유로(17억 3,000만 달러)를 투자하는 EU의 그린포트 예산에 힘입은 결과입니다. 네덜란드 즈위드홀란트주에서만 1억 7,200만 톤을 처리하고 있으며, 내륙 운송에서 바지선의 이용률은 50%를 넘고 있습니다. 독일의 HyInland 회랑은 현재 40척의 수소 추진 선박을 개조하여 뒤스부르크, 쾰른, 마인츠를 연결하고 있으며, 이 지역 내에서 선구적인 규모를 보여주고 있습니다.
아시아태평양 지역은 2031년까지 연평균 성장률(CAGR) 4.93%로 가장 높은 성장세를 보일 전망이며, 중국의 양쯔강 경제 벨트에서는 수문, 복합 운송 터미널, 디지털 배차 센터에 1,800억 달러가 투자되고 있습니다. 베트남의 28억 달러 규모 메콩 델타 항만에는 3개의 내륙 터미널이 신설되는 한편, 인도의 내수운하 1호선에서는 120억 달러 규모의 사갈마라 예산을 활용해 컨테이너 처리량을 전년 대비 40% 늘릴 계획입니다. 인도네시아는 해안가의 제련소에 니켈 광석을 공급하기 위한 하천 운송 경로를 정비하며, 동남아시아 내 운송 점유율을 확대되고 있습니다.
북미에서는 미시시피강에서 80억 달러 규모의 수문 및 댐 개보수 공사가 진행되고 있으며, 또한 ‘클린 포트(Clean Port)’ 수소 보조금을 통해 2027년 이후 주요 터미널에서 바지선(내륙선)으로의 전환이 추진될 예정입니다. 남미에서는 급증하는 대두 및 리튬 수출에 대응하기 위해 파라과이-파라나 수로 개보수 공사가 진행되고 있으며, 아르헨티나와 브라질은 준설 및 강둑 안정화 사업에 32억 달러를 배정하고 있습니다. 중동 및 아프리카는 여전히 개발도상국이지만, 중국의 자금 지원을 통해 이집트의 나일강과 나이지리아의 니제르강 회랑에서 초기 단계의 프로젝트가 진행되고 있습니다.
기타 혜택 :
- 엑셀 형식 시장 예측(ME) 시트
- 3개월간의 애널리스트 지원
자주 묻는 질문
목차
제1장 서론
제2장 조사 방법
제3장 주요 요약
제4장 시장 구도
제5장 시장 규모 및 성장 예측
제6장 경쟁 구도
제7장 시장 기회 및 향후 전망
AJY 26.06.26According to Mordor Intelligence, the inland water freight transport market size is expected to increase from USD 117.32 billion in 2025 to USD 122.50 billion in 2026 and reach USD 151.2 billion by 2031, growing at a CAGR of 4.3% over 2026-2031.
This report is Segmented by Type of Transportation (Liquid Bulk, Dry Bulk, Containerised Freight, and Roll-On/Roll-Off Cargo), by End-User Industry (Agriculture & Food, Metallurgy & Mining, Petroleum & Chemicals, Construction, Energy, and More), and by Geography (North America, South America, Europe, Asia-Pacific, and More). The Market Forecasts are Provided in Terms of Value (USD).
Global Inland Water Freight Transport Market Trends and Insights
Expansion of Renewable-Fuel and Bio-Feedstock Trade Flows
Barge movements of vegetable oils, animal fats, and agricultural residues climbed 127% from 2024 to 2025 along the United States Gulf Coast corridors under renewable fuel standard mandates that reward low-carbon logistics. Marathon Petroleum channels feedstock to its 184-million-gallon North Dakota renewable diesel complex by Missouri River barge, locking in decades-long volume. Europe mirrors this pattern as rapeseed and used-cooking oil volumes rise along the Rhine-Main-Danube, supported by IMO 2030 carbon-intensity targets. The opportunity widens to algae oil and lignocellulosic biomass, although storage and handling infrastructure for these next-generation materials remains sparse outside pilot hubs. Operators that standardize tank-cleaning protocols and temperature-controlled holds gain first-mover pricing power.
Surge in Critical-Mineral Logistics for EV Supply Chains
China's Yangtze River carried 2.3 million tons of battery-grade lithium, cobalt, nickel, and graphite in 2025, up from 890,000 tons in 2023, reflecting gigafactory clustering near deep navigable channels. Indonesia's nickel-ore export ban forces domestic smelting, with river barges moving ore from Sulawesi mines to coastal plants; similar policy shifts spur barge demand in Chile and Argentina. Automakers now require auditable low-carbon transport, allowing operators that integrate blockchain custody records to charge premium rates. Long-haul truck lanes see a parallel decline as waterway legs remove up to 25% of logistics cost for dense metals.
Invasive Aquatic-Weed Proliferation Driving Dredging Costs
Water-hyacinth infestations forced India's National Waterway-1 to spend INR 450 crores (USD 54 million) on annual removal, or 23% of its operating budget. Mekong Delta channels recorded 40% coverage growth from 2023-2025 despite USD 18 million spent on control, compelling barges to derate cargo 15-20% to maintain safe under-keel clearance. Climatic warming accelerates the spread, and biological controls take 3-5 years to work, keeping cost pressure elevated.
Other drivers and restraints analyzed in the detailed report include:
- Post-Panamax Port Deepening Unlocking Barge Corridors
- Hydrogen-Powered Corridor Pilots and Green Inland-Port Funding
- Stricter PFAS & Micro-Plastic Discharge Regulations
For complete list of drivers and restraints, kindly check the Table Of Contents.
Segment Analysis
Liquid bulk movements secured the largest 36.54% inland water freight transport market share in 2025, anchored by petroleum and chemical trades that concentrate around refinery clusters. Yet a pivot toward renewable feedstocks and on-site chemical production near renewable-energy hubs tempers long-term volume, prompting fleets to retrofit stainless tanks and heated pipelines. Dry bulk, by contrast, is forecast to outpace all segments at a 4.58% CAGR, powered by infrastructure megaproject demand for sand, gravel, and cement, and by critical-mineral flows to gigafactories situated along rivers for low-cost inbound logistics.
Autonomous navigation fits dry bulk especially well because standardized cargo profiles simplify algorithmic load planning and push-convoy configuration, letting operators cut crew costs by up to 70%. Containerized freight accelerates as congestion-free inland ports link to micro-fulfillment centers that orchestrate same-day urban delivery, a model now capturing 3-5% of metropolitan e-commerce replenishment volumes. Roll-on/roll-off remains niche but gains momentum for electric-vehicle shipments, taking advantage of waterway safety advantages for high-capacity battery transport.
Geography Analysis
Europe commanded 44.32% of global value in 2025, supported by the Rhine-Main-Danube's dense 8,000-kilometer network and an EU green-port budget that funnels EUR 1.5 billion (USD 1.73 billion) into hydrogen infrastructure. The Netherlands' Zuid-Holland alone handled 172 million tons, with barge penetration surpassing 50% of hinterland moves. Germany's HyInland corridor now links Duisburg, Cologne, and Mainz with 40 converted hydrogen push boats, illustrating regional first-mover scale.
Asia-Pacific posts the fastest 4.93% CAGR through 2031 as China's Yangtze River Economic Belt channels USD 180 billion into locks, intermodal yards, and digital dispatch centers. Vietnam's USD 2.8 billion Mekong-Delta ports add three inland terminals, while India's National Waterway-1 uses a Sagarmala budget of USD 12 billion to lift container volumes 40% year on year. Indonesia builds nickel-ore river routes to feed coastal smelters, expanding Southeast Asian traffic share.
North America benefits from a USD 8 billion lock-and-dam overhaul on the Mississippi, and Clean Ports hydrogen grants prime terminals for barge conversions from 2027. South America upgrades the Paraguay-Parana to move surging soybean and lithium exports, with Argentina and Brazil allocating USD 3.2 billion to dredging and bank stabilization. Africa and the Middle East remain nascent but see early projects in Egypt's Nile and Nigeria's Niger corridors via Chinese financing.
- American Commercial Barge Line
- Ingram Barge
- Kirby Inland Marine
- American River Transportation
- CMA CGM Group
- A P Moller - Maersk A/S
- Rhenus Group
- Imperial Logistics (Subsidiary of DP World)
- McKeil Marine
- Danser Group
- Contargo
- Sogestran Group
- J. Muller Group
- COSCO Shipping Logistics
- Huettemann Group
- DHL
- Campbell Transportation Company Inc
- Marquette Transportation Company
- Vinafreight
- Mitsui O.S.K. Lines (MOL)
- Blue Line Logistics
- Louis Dreyfus Company
Additional Benefits:
- The market estimate (ME) sheet in Excel format
- 3 months of analyst support
TABLE OF CONTENTS
1 Introduction
- 1.1 Market Definition & Scope
- 1.2 Study Assumptions
2 Research Methodology
3 Executive Summary
4 Market Landscape
- 4.1 Market Overview
- 4.2 Market Drivers
- 4.2.1 Expansion of Renewable-Fuel & Bio-Feedstock Trade Flows
- 4.2.2 Surge in Critical-Minerals Logistics for EV Supply Chains
- 4.2.3 Post-Panamax Port Deepening Unlocking Barge Corridors
- 4.2.4 Hydrogen-Powered Corridor Pilots & Green Inland-Port Funding
- 4.2.5 Blockchain-Based Cargo-Traceability Compliance Mandates
- 4.2.6 Autonomous Modular Push-Barge Convoys for Shallow Waterways
- 4.3 Market Restraints
- 4.3.1 Invasive Aquatic-Weed Proliferation Driving Dredging Costs
- 4.3.2 Stricter PFAS & Micro-Plastic Discharge Regulations
- 4.3.3 Cyber-Security Risks to Digital Lock and Bridge Systems
- 4.3.4 Weather-Related Collision Losses Spiking Insurance Premiums
- 4.4 Value / Supply-Chain Analysis
- 4.5 Regulatory Landscape
- 4.6 Technological Outlook
- 4.7 Porter's Five Forces
- 4.7.1 Threat of New Entrants
- 4.7.2 Bargaining Power of Buyers
- 4.7.3 Bargaining Power of Suppliers
- 4.7.4 Threat of Substitutes
- 4.7.5 Competitive Rivalry
- 4.8 Trans-shipment Trade Insights
- 4.9 Impact of COVID-19 and Geo-Political Events
5 Market Size & Growth Forecasts
- 5.1 By Type of Transportation
- 5.1.1 Liquid Bulk Transportation
- 5.1.2 Dry Bulk Transportation
- 5.1.3 Containerised Freight
- 5.1.3.1 Dry
- 5.1.3.2 Reefer
- 5.1.4 Roll-On / Roll-Off Cargo
- 5.2 By End-User Industry
- 5.2.1 Agriculture & Food
- 5.2.2 Metallurgy & Mining
- 5.2.3 Petroleum & Chemicals
- 5.2.4 Construction
- 5.2.5 Energy (Biomass & Coal)
- 5.2.6 Consumer Goods & Retail
- 5.2.7 Others
- 5.3 By Geography
- 5.3.1 North America
- 5.3.1.1 United States
- 5.3.1.2 Canada
- 5.3.1.3 Mexico
- 5.3.2 South America
- 5.3.2.1 Brazil
- 5.3.2.2 Argentina
- 5.3.2.3 Rest of South America
- 5.3.3 Europe
- 5.3.3.1 Germany
- 5.3.3.2 Netherlands
- 5.3.3.3 Belgium
- 5.3.3.4 France
- 5.3.3.5 Russia
- 5.3.3.6 Rest of Europe
- 5.3.4 Asia-Pacific
- 5.3.4.1 China
- 5.3.4.2 India
- 5.3.4.3 Japan
- 5.3.4.4 Australia
- 5.3.4.5 Rest of Asia-Pacific
- 5.3.5 Middle East & Africa
- 5.3.5.1 Saudi Arabia
- 5.3.5.2 United Arab Emirates
- 5.3.5.3 Rest of Middle East And Africa
- 5.3.1 North America
6 Competitive Landscape
- 6.1 Market Concentration
- 6.2 Strategic Moves
- 6.3 Market Share Analysis
- 6.4 Company Profiles (includes Global-level Overview, Market-level Overview, Core Segments, Financials, Strategic Info, Market Rank/Share, Products & Services, Recent Developments)
- 6.4.1 American Commercial Barge Line
- 6.4.2 Ingram Barge
- 6.4.3 Kirby Inland Marine
- 6.4.4 American River Transportation
- 6.4.5 CMA CGM Group
- 6.4.6 A P Moller - Maersk A/S
- 6.4.7 Rhenus Group
- 6.4.8 Imperial Logistics (Subsidiary of DP World)
- 6.4.9 McKeil Marine
- 6.4.10 Danser Group
- 6.4.11 Contargo
- 6.4.12 Sogestran Group
- 6.4.13 J. Muller Group
- 6.4.14 COSCO Shipping Logistics
- 6.4.15 Huettemann Group
- 6.4.16 DHL
- 6.4.17 Campbell Transportation Company Inc
- 6.4.18 Marquette Transportation Company
- 6.4.19 Vinafreight
- 6.4.20 Mitsui O.S.K. Lines (MOL)
- 6.4.21 Blue Line Logistics
- 6.4.22 Louis Dreyfus Company
7 Market Opportunities & Future Outlook
- 7.1 White-space & Unmet-need Assessment