
|
시장보고서
상품코드
2062226
몰입형 기술 : 시장 점유율 분석, 산업 동향 및 통계 데이터, 성장 예측(2026-2031년)Immersive Technologies - Market Share Analysis, Industry Trends & Statistics, Growth Forecasts (2026 - 2031) |
||||||
 Mordor Intelligence
Mordor Intelligence에 의하면, 몰입형 기술 시장 규모는 2025년에 446억 2,000만 달러에 이르고, 2030년까지 1,527억 3,000만 달러로 확대되며 이 기간 CAGR은 27.90%를 나타낼 전망입니다.
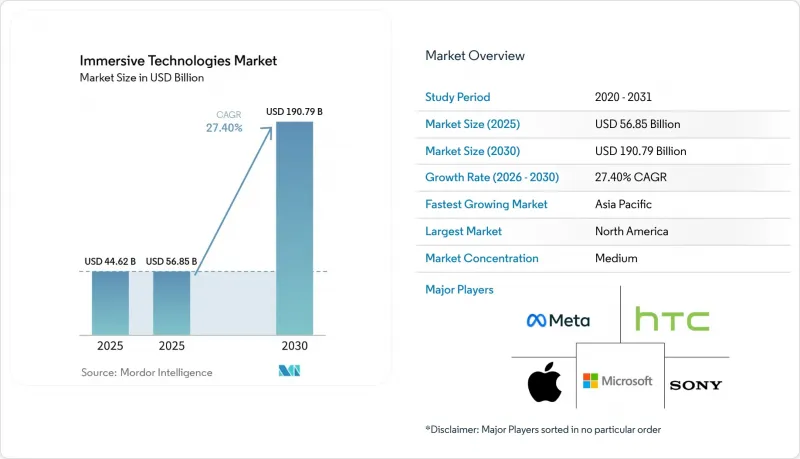
본 보고서는 기술별(증강현실, 가상현실, 혼합현실 등), 구성 요소별(하드웨어, 소프트웨어, 서비스 등), 용도별(교육·시뮬레이션, 원격 협업, 제품 설계·프로토타이핑 등), 최종 사용자 산업별(게임 및 엔터테인먼트, 의료 및 생명과학 등), 지역별로 분류되어 있습니다. 시장 전망은 금액(달러) 기준으로 제시되어 있습니다.
세계의 몰입형 기술 시장 동향 및 인사이트
기업의 교육 및 시뮬레이션 분야에서 비용 절감을 위한 노력
기업은 재무 모델을 통해 훈련 주기의 단축이 초기 기기 비용을 상쇄한다는 사실을 입증할 수 있을 때, 몰입형 기술의 도입을 정당화합니다. 정형외과 수술 리허설을 통해 평균 수술 시간이 18분 단축되었으며, 합병증 발생률이 15-20% 감소했습니다. 로슈 등 제약사들은 디지털 트윈을 활용하여 의약품 생산 라인의 검증 기간을 6개월에서 8주로 단축했습니다. 대규모로 도입할 경우, 500대 이상의 헤드셋을 보유함으로써 대당 라이선스 비용을 35% 절감할 수 있으며, 이전에는 시범 프로젝트에 불과했던 것이 표준 운영 절차로 전환됩니다. 이러한 장점 덕분에, 측정 가능한 생산성 향상을 추구하지만 예산에 제약이 있는 업계에게도 몰입형 기술 시장은 매력적인 선택지가 되고 있습니다.
게임 및 엔터테인먼트용 AR·VR 헤드셋의 소비자 시장에서의 급속한 확대
직원들이 헤드셋 사용에 익숙해진 상태에서 이를 직장에 가져오면서, 소비자 시장의 열기가 기업 시장으로도 확산되고 있습니다. 중국에서는 2025년에 1,800만 대의 소비자용 헤드셋이 출하되어, 1년 만에 50%의 급증세를 기록했습니다. 메타의 레이밴 스마트글래스는 2025년 중반까지 판매 대수가 100만 대를 돌파하며, 더욱 슬림해진 디자인이 매력을 더하고 있음을 보여주었습니다. 일본의 메타버스 관련 지출은 가상 콘서트와 아바타 커머스가 장기적인 참여도를 수익화함에 따라 2026년에는 1조 엔(73억 달러)에 달할 것으로 전망됩니다. 독립형 헤드셋의 부팅 시간은 현재 3분 미만으로 단축되었으며, 이러한 사용 편의성의 획기적인 개선 덕분에 메타 생태계의 일일 활성 사용자 수가 40% 증가했습니다. 그 결과, 사용자에게 친근감이 생기고, 기업 내 도입 기간이 단축되며, 새로운 몰입형 서비스 전개를 위한 프로젝트 승인이 가속화되고 있습니다.
엔터프라이즈급 시스템 도입에 따른 막대한 초기 설비 투자
종합적인 도입에는 하드웨어 장비, 소프트웨어 라이선스, 통합 비용으로 5만-50만 달러가 필요한 경우가 많으며, 이로 인해 투자 회수 기간이 일반적인 IT 갱신 주기를 초과하게 됩니다. 신흥 시장의 중소기업들은 현지 통합 업체가 부족하기 때문에 하루 2,000달러가 넘는 일당으로 전문 인력을 수입해야 하며, 이로 인해 프로젝트 예산에 25-30%의 추가 비용이 발생합니다. 'XR as a Service'와 같은 금융 모델의 보급률은 여전히 15% 미만에 그치고 있습니다. 이는 최소 3년의 계약 기간과 두 자릿수의 실질 금리가 유동성의 이점을 상쇄하고 있기 때문입니다. CFO는 시범 운영을 통해 ROI가 입증될 때까지 장비 발주를 미루고 있어, 개념 검증 단계에서 본격적인 운영 단계로의 전환이 지연되고 있습니다. 하드웨어의 수명 주기가 길어짐에 따라 이러한 제약은 점차 완화될 전망이지만, 자본 집약적인 특성으로 인해 몰입형 기술 시장의 단기 전망은 여전히 제한받고 있습니다.
부문별 분석
2025년에는 가상현실(VR)이 매출의 31.8%를 차지하며, 엔터테인먼트 및 완전 몰입형 훈련 프로그램을 주도했습니다. 디지털 상호작용 중에 도구나 팀원을 확인할 수 있는 풀컬러 패스스루 기능 덕분에, 혼합현실(MR) 시장이 2031년까지 연평균 성장률(CAGR) 32.3%로 확대됨에 따라 몰입형 기술 시장 점유율은 점차 변화하고 있습니다. Apple Vision Pro와 Meta Quest 3는 모두 VR 모드와 MR 모드를 전환할 수 있어, 이를 통해 조달상의 딜레마가 해소되고 기기 재고 감축으로 이어집니다. 생산 라인이나 수술실에서는 물리적 상황 파악이 필수적인 수 시간에 걸친 업무 흐름 속에서 팀은 MR을 선호하여 도입하고 있습니다. 증강현실(AR)은 착용자를 주변 환경과 격리시키지 않고 도면을 오버레이로 표시할 수 있기 때문에 현장 서비스 분야의 안내 용도로 틈새 시장을 유지하고 있습니다. 확장 현실(XR)은 다중 모드 도입과 관련된 조달 분야의 약어로 사용되고 있으며, 기업의 RFP(제안 요청서)에도 점점 더 자주 등장하고 있습니다. 소프트웨어 플랫폼이 기기에 구애받지 않는 런타임을 지원하게 됨에 따라 통합이 가속화될 가능성이 높으며, 기업은 단일 용도의 하드웨어에 얽매이지 않고 각 작업에 적합한 모드를 도입할 수 있게 될 것입니다.
MR에 대한 수요가 증가함에 따라, 컴퓨터 비전, 공간 매핑, 안전 인증을 통합한 서비스 계약이 늘어나고 있습니다. 통합 업체에 따르면, 현실 세계의 가림 현상이나 오브젝트의 앵커 위치를 정확하게 유지해야 하기 때문에 MR 도입에는 VR보다 30% 더 많은 시간이 소요된다고 보고되고 있습니다. 그렇긴 하지만, 도입 대수가 500대에 달하면 공유 컨텐츠 라이브러리를 통해 엔지니어링 비용이 상쇄되므로, 사용자 1인당 경제성은 향상됩니다. 벤더가 내장형 깊이 센서를 개선하여 패스스루 지연 시간이 15밀리초 미만으로 줄어들면, 사용자의 편의성이 향상되고 이용 시간도 늘어납니다. 그 결과로 가져오는 생산성 향상은 몰입형 기술 시장에서 MR이 주요 성장 동력으로서의 입지를 확고히 하고 있습니다.
2025년 지출의 63.9%를 하드웨어가 차지했으며, 이는 다수의 개념 증명(PoC) 시범 프로젝트를 시작한 헤드셋의 도입 대수를 반영한 것입니다. 그러나 서비스 부문은 연평균 성장률(CAGR) 31.8%로 성장하고 있습니다. 이는 기업들이 컨텐츠 업데이트, 분석, 사용자 지원을 포함하는 다년 계약의 관리형 서비스를 구매하게 되었기 때문입니다. 구매자들이 설비 투자(CAPEX)에서 예측 가능한 운영 예산(OPEX)으로 전환함에 따라, 몰입형 기술 시장의 서비스 시장 규모는 2031년까지 기기 매출액을 넘어설 것으로 전망됩니다. 통합 업체는 하드웨어 임대, 맞춤형 3D 자산 제작, 24시간 헬프데스크 서비스를 연간 10만-200만 달러 규모의 계약에 포함시키고 있습니다. 탄탄한 서비스 팀이 이용률 향상과 라이선스 갱신을 촉진함에 따라, 소프트웨어 플랫폼도 간접적인 혜택을 보고 있습니다.
인사이드아웃 광학 트래킹 기술 덕분에 외부 베이스 스테이션이 필요 없어졌고, 설정 시간이 45분에서 5분으로 단축됨에 따라 공장 현장에서 팝업 교실을 운영할 수 있게 되었습니다. 공동 디스플레이 월은 10명의 이해관계자가 별도의 헤드셋을 착용하지 않고도 쌍방향 영상을 볼 수 있기 때문에 설계 검토 과정에서 다시 주목받고 있습니다. 서비스 제공업체는 이러한 멀티모달 환경을 체계적으로 관리하고, 모든 기기와 클라우드 엔드포인트 전반에 걸쳐 데이터 보안을 확보함으로써 부가가치를 제공합니다. 생체 정보에 대한 규제가 강화되는 가운데, 컴플라이언스 컨설팅이 서비스 시장의 기회를 더욱 확대되고 있습니다. 하드웨어 공급업체들은 SDK 공개 및 통합 업체와의 제휴를 통해 이에 대응하고 있으며, 이러한 공생 관계가 몰입형 기술 시장에서 서비스 부문을 가장 빠르게 성장하는 분야로 확고히 자리매김하게 하고 있습니다.
지역별 분석
북미는 2025년 매출의 27.4%를 차지하며, 제조, 의료, 방위 분야 기업들의 모범 사례 기준 지역으로 자리매김했습니다. 구매자는 레거시 IT 시스템과의 통합을 중요하게 여기며, 사이버 보안 규정 준수를 문서화한 공급업체를 선호합니다. 연방 정부의 훈련 예산과 국방 연구 지원금은 소비자 심리가 변동하더라도 수년에 걸친 수요 기반을 확보해 줍니다. 서비스 파트너들은 대도시권의 허브에 집중되어 있어, 품질을 저하시키지 않으면서 전국적인 서비스 범위를 확보하고 있습니다.
아시아태평양은 각국 정부가 몰입형 연구소를 전략적 인프라로 간주하는 가운데, 2031년까지 연평균 성장률(CAGR) 32.6%를 기록하며 가장 빠르게 성장하고 있습니다. 중국은 2025년까지 국내 기기 자급률 45%, 부품 현지 조달률 60%를 달성하여 수출 규제로부터 생산을 보호했습니다. 인도는 인도 크리에이티브 테크놀로지 연구소 및 1만 5,000개 학교와 500개 대학에 설치될 AVGC 연구소를 위해 39억 1,150만 루피(4,680만 달러)를 예산으로 편성했습니다. 이러한 공공 투자는 예측 가능한 수요 파이프라인을 창출하여 벤처 자금이 이를 활용할 수 있게 해줍니다. Pico와 같은 지역 업체들은 중국 내 출하 대수의 25% 이상을 차지하고 있으며, 이는 현지 유력 기업들이 다국적 기업들과 어깨를 나란히 하며 번창할 수 있음을 보여줍니다.
유럽은 GDPR(EU 개인정보보호규정)과 EU AI법에 따른 혜택을 누리고 있습니다. 이는 생체 인증 데이터에 대한 규정을 명확히 함으로써, 규제 대상 부문에 속한 기업들의 조달 주기를 단축합니다. 명확한 주권에 관한 지침은 구매자의 신뢰를 높여주지만, 규정 준수 대응에는 컨설팅 비용이 수반되므로 전담 법무팀을 보유한 공급업체에 유리하게 작용합니다. 남미, 중동 및 아프리카는 5G 인프라 구축과 기기 수입 관세로 인해 헤드셋의 실질 가격이 최대 50% 상승하면서 뒤처지고 있습니다. 그렇긴 하지만, 브라질과 사우디아라비아에서 진행된 시범 프로그램은 연결성이라는 장벽이 해소된다면 누적된 수요가 표면화될 것임을 보여주고 있습니다. 전반적으로, 지리적 분산이 몰입형 기술 시장의 장기적인 회복력을 뒷받침하고 있습니다.
기타 혜택 :
- 엑셀 형식 시장 예측(ME) 시트
- 3개월간의 애널리스트 지원
자주 묻는 질문
목차
제1장 서론
제2장 분석 방법
제3장 주요 요약
제4장 시장 구도
제5장 시장 규모 및 성장률 예측
제6장 경쟁 구도
제7장 시장 기회 및 향후 전망
KTH 26.06.24According to Mordor Intelligence, the immersive technologies market size reached USD 44.62 billion in 2025 and is forecast to expand to USD 152.73 billion by 2030, reflecting a 27.90% CAGR during the period.
This report is Segmented by Technology (Augmented Reality, Virtual Reality, Mixed Reality, and More, Component (Hardware, Software, and Services), Application (Training and Simulation, Remote Collaboration), Product Design and Prototyping, and More), End-User Industry (Gaming and Entertainment, Healthcare and Life Sciences, and More), and Geography. The Market Forecasts are Provided in Terms of Value (USD).
Global Immersive Technologies Market Trends and Insights
Enterprise Training and Simulation Cost-Reduction Initiatives
Enterprises validate immersive deployments when financial models prove that shorter training cycles offset upfront device costs. Surgical rehearsal in orthopedics trimmed average operating-room time by 18 minutes and lowered complications by 15-20%. Manufacturers such as Roche compressed pharmaceutical line validation from six months to eight weeks using digital twins. At scale, fleets above 500 headsets reduce per-seat licensing by 35%, turning previously experimental pilots into standard operating procedure. These gains make the immersive technologies market attractive even to budget-constrained sectors seeking measurable productivity boosts.
Surging Consumer AR and VR Headset Adoption for Gaming and Entertainment
Consumer momentum spills into the enterprise when employees bring headset familiarity to work. China shipped 18 million consumer units in 2025, a 50% jump in one year. Meta's Ray-Ban smart glasses surpassed 1 million sales by mid-2025, showing that slimmer designs broaden appeal. Japan's metaverse spending is tracking toward JPY 1 trillion (USD 7.3 billion) in 2026 because virtual concerts and avatar commerce monetize longer engagement. Stand-alone headsets now launch in under three minutes, a usability leap that raised daily active users by 40% in Meta's ecosystem. The resulting familiarity lowers corporate onboarding time and accelerates project approval for new immersive rollouts.
High Upfront Capex for Enterprise-Grade Deployments
Comprehensive rollouts often require USD 50,000-USD 500,000 for hardware fleets, software licenses, and integration, which stretches payback beyond typical IT refresh windows. Smaller firms in emerging markets face scarce local integrators and must import expertise at daily rates above USD 2,000, adding 25-30% to project budgets. Financing models such as XR as a Service remain below 15% penetration because three-year minimum terms and double-digit effective interest rates blunt liquidity benefits. CFOs delay fleet orders until pilots prove ROI, slowing conversion from proof of concept to production use. Longer hardware life cycles will gradually ease this restraint, but capital intensity still tempers the near-term outlook for the immersive technologies market.
Other drivers and restraints analyzed in the detailed report include:
- 5G Edge Rendering Enabling Lighter, Cheaper Wearables
- Photogrammetry-Based Digital Twins Accelerating Design Cycles
- Health and Safety Concerns (Eye Strain, Cybersickness)
For complete list of drivers and restraints, kindly check the Table Of Contents.
Segment Analysis
Virtual reality accounted for 31.8% of revenue in 2025, dominating entertainment and fully immersive training programs. The immersive technologies market share is gradually shifting as mixed reality accelerates at a 32.3% CAGR through 2031, thanks to full-color passthrough that lets users see tools and teammates during digital interaction. Apple Vision Pro and Meta Quest 3 both toggle between VR and MR modes, eliminating procurement dilemmas and cutting device inventory. In manufacturing lines and operating rooms, teams favor MR for multi-hour workflows where physical situational awareness is mandatory. Augmented reality maintains a niche for field-service guidance because it overlays schematics without isolating the wearer. Extended reality serves as procurement shorthand for multi-modal deployments and increasingly appears in enterprise RFPs. Convergence is likely as software platforms speak to device-agnostic runtimes, letting firms deploy the right mode for each task without locking into single-use hardware.
Demand for MR elevates service engagements that integrate computer vision, spatial mapping, and safety certification. Integrators report that MR rollouts take 30% longer than VR because physical-world occlusion and object anchoring must remain precise. Nevertheless, per seat economics improve once deployments reach 500 devices, which is when shared content libraries amortize engineering costs. As vendors refine onboard depth sensors and pass-through latency falls below fifteen milliseconds, user comfort grows and dwell times lengthen. The resulting productivity boost reinforces MR's position as the primary growth engine for the immersive technologies market.
Hardware captured 63.9% of 2025 spending, reflecting the headset fleets that launched many proof-of-concept pilots. Yet services are scaling at a 31.8% CAGR because enterprises now purchase multi-year managed offerings that include content refresh, analytics, and user support. The immersive technologies market size for services is projected to outpace device revenue before 2031 as buyers trade capital expense for predictable operating budgets. Integrators bundle hardware leasing, custom 3D asset creation, and 24-hour help desks into contracts priced at USD 100,000-USD 2 million per year. Software platforms benefit indirectly because robust services teams drive higher seat utilization and license renewals.
Inside-out optical tracking has eliminated external base stations, shrinking set-up from forty-five to five minutes and making pop-up classrooms possible on factory floors. Collaborative display walls regain interest for design reviews because ten stakeholders can view a twin without donning separate headsets. Service providers add value by curating these multimodal environments and ensuring data security across devices and cloud endpoints. As regulations tighten around biometric information, compliance consulting further inflates the services opportunity. Hardware vendors respond by opening SDKs and partnering with integrators, a symbiosis that cements services as the fastest-growing slice of the immersive technologies market.
Geography Analysis
North America generated 27.4% of 2025 revenue and remains a reference region for enterprise best practices in manufacturing, healthcare and defense. Buyers emphasize integration with legacy IT and favor suppliers that document cybersecurity compliance. Federal training budgets and defense research grants ensure a baseline of multi-year demand, even when consumer sentiment fluctuates. Services partners cluster around metropolitan hubs, enabling nationwide coverage without diluting quality.
Asia-Pacific is the fastest climber at a 32.6% CAGR through 2031 as governments classify immersive labs as strategic infrastructure. China achieved 45% domestic device autonomy and 60% component localization in 2025, insulating production from export controls. India earmarked INR 391.15 crore (USD 46.8 million) for the Indian Institute of Creative Technologies and embedded AVGC labs in 15,000 schools and 500 colleges. Such public investment creates a predictable pipeline demand that venture funding can leverage. Regional vendors like Pico hold more than 25% of China's unit shipments, showing that local champions can thrive alongside multinationals.
Europe benefits from GDPR and the EU AI Act, which clarify biometric data rules and shorten enterprise procurement cycles in regulated sectors. Clear sovereignty guidelines lift buyer confidence, though compliance adds consulting overhead that favors vendors with dedicated legal teams. South America and the Middle East and Africa trail because 5G build-outs and device import duties raise effective headset prices by up to 50%. Nonetheless, pilot programs in Brazil and Saudi Arabia demonstrate pent-up interest once connectivity barriers fall. Overall, geographic diversification anchors the long-term resilience of the immersive technologies market.
- Meta Platforms (Reality Labs)
- Microsoft Corporation
- Apple Inc.
- HTC Corporation (Vive)
- Sony Group Corporation
- Alphabet Inc. (Google)
- Qualcomm Technologies Inc.
- Samsung Electronics Co., Ltd.
- Magic Leap, Inc.
- Unity Technologies
- NVIDIA Corporation
- PTC Inc. (Vuforia)
- Varjo Technologies
- Lenovo Group Limited
- Ultraleap Ltd.
- Pico Interactive
- DPVR (Deepoon)
- TeamViewer (Frontline)
- Epson (Moverio)
- Avegant Corporation
- Valve Corporation
- Snap Inc.
- Niantic, Inc.
- Vuzix Corporation
- Autodesk Inc.
Additional Benefits:
- The market estimate (ME) sheet in Excel format
- 3 months of analyst support
TABLE OF CONTENTS
1 INTRODUCTION
- 1.1 Study Assumptions & Market Definition
- 1.2 Scope of the Study
2 RESEARCH METHODOLOGY
3 EXECUTIVE SUMMARY
4 MARKET LANDSCAPE
- 4.1 Market Overview
- 4.2 Industry Value / Supply-Chain Analysis
- 4.3 Impact of Macroeconomic Factors on the Market
- 4.4 Market Drivers
- 4.4.1 Surging Consumer AR/VR Headset Adoption for Gaming and Entertainment
- 4.4.2 Enterprise Training and Simulation Cost-Reduction Initiatives
- 4.4.3 Declining Hardware ASPs Driven by Next-Gen Chipsets
- 4.4.4 Content-as-a-Service Business Models Unlocking Recurring Revenue
- 4.4.5 5G Edge Rendering Enabling Lighter, Cheaper Wearables
- 4.4.6 Photogrammetry-Based Digital Twins Accelerating Design Cycles
- 4.5 Market Restraints
- 4.5.1 High Upfront Capex for Enterprise-Grade Deployments
- 4.5.2 Health and Safety Concerns (Eye Strain, Cybersickness)
- 4.5.3 Supply-Chain Reliance on Rare-Earth Magnets for Haptics
- 4.5.4 Spatial-Data Privacy and Sovereignty Regulations
- 4.6 Regulatory Landscape
- 4.7 Technological Outlook
- 4.8 Porter's Five Forces Analysis
- 4.8.1 Threat of New Entrants
- 4.8.2 Bargaining Power of Buyers
- 4.8.3 Bargaining Power of Suppliers
- 4.8.4 Threat of Substitutes
- 4.8.5 Competitive Rivalry
5 MARKET SIZE AND GROWTH FORECASTS (VALUE)
- 5.1 By Technology
- 5.1.1 Augmented Reality (AR)
- 5.1.2 Virtual Reality (VR)
- 5.1.3 Mixed Reality (MR)
- 5.1.4 Extended Reality (XR)
- 5.2 By Component
- 5.2.1 Hardware
- 5.2.1.1 Head-Mounted Displays (HMDs)
- 5.2.1.2 Head-Up Displays (HUDs)
- 5.2.1.3 Projectors and Display Walls
- 5.2.1.4 Sensors and Tracking Systems
- 5.2.2 Software
- 5.2.2.1 AR/VR Content Creation Platforms
- 5.2.2.2 Simulation Software
- 5.2.2.3 Real-Time Rendering Engines
- 5.2.3 Services
- 5.2.3.1 Integration and Deployment
- 5.2.3.2 Consulting and Training
- 5.2.3.3 Support and Maintenance
- 5.2.1 Hardware
- 5.3 By Application
- 5.3.1 Training and Simulation
- 5.3.2 Remote Collaboration
- 5.3.3 Product Design and Prototyping
- 5.3.4 Marketing and Advertising
- 5.3.5 Retail Visualization
- 5.3.6 Patient Therapy and Surgical Planning
- 5.3.7 Entertainment and Gaming
- 5.3.8 Other Applications
- 5.4 By End-User Industry
- 5.4.1 Gaming and Entertainment
- 5.4.2 Healthcare and Life Sciences
- 5.4.3 Education and EdTech
- 5.4.4 Manufacturing and Industrial
- 5.4.5 Retail and E-Commerce
- 5.4.6 Aerospace and Defense
- 5.4.7 Automotive
- 5.4.8 Real Estate and Architecture
- 5.4.9 Other End-User Industries
- 5.5 By Geography
- 5.5.1 North America
- 5.5.1.1 United States
- 5.5.1.2 Canada
- 5.5.1.3 Mexico
- 5.5.2 South America
- 5.5.2.1 Brazil
- 5.5.2.2 Argentina
- 5.5.2.3 Rest of South America
- 5.5.3 Europe
- 5.5.3.1 Germany
- 5.5.3.2 United Kingdom
- 5.5.3.3 France
- 5.5.3.4 Italy
- 5.5.3.5 Spain
- 5.5.3.6 Russia
- 5.5.3.7 Rest of Europe
- 5.5.4 Asia-Pacific
- 5.5.4.1 China
- 5.5.4.2 Japan
- 5.5.4.3 South Korea
- 5.5.4.4 India
- 5.5.4.5 Australia
- 5.5.4.6 Rest of Asia-Pacific
- 5.5.5 Middle East and Africa
- 5.5.5.1 Middle East
- 5.5.5.1.1 Saudi Arabia
- 5.5.5.1.2 United Arab Emirates
- 5.5.5.1.3 Turkey
- 5.5.5.1.4 Rest of Middle East
- 5.5.5.2 Africa
- 5.5.5.2.1 South Africa
- 5.5.5.2.2 Nigeria
- 5.5.5.2.3 Rest of Africa
- 5.5.5.1 Middle East
- 5.5.1 North America
6 COMPETITIVE LANDSCAPE
- 6.1 Market Concentration
- 6.2 Strategic Moves
- 6.3 Market Share Analysis
- 6.4 Company Profiles (includes Global Level Overview, Market Level Overview, Core Segments, Financials as available, Strategic Information, Market Rank/Share, Products and Services, Recent Developments)
- 6.4.1 Meta Platforms (Reality Labs)
- 6.4.2 Microsoft Corporation
- 6.4.3 Apple Inc.
- 6.4.4 HTC Corporation (Vive)
- 6.4.5 Sony Group Corporation
- 6.4.6 Alphabet Inc. (Google)
- 6.4.7 Qualcomm Technologies Inc.
- 6.4.8 Samsung Electronics Co., Ltd.
- 6.4.9 Magic Leap, Inc.
- 6.4.10 Unity Technologies
- 6.4.11 NVIDIA Corporation
- 6.4.12 PTC Inc. (Vuforia)
- 6.4.13 Varjo Technologies
- 6.4.14 Lenovo Group Limited
- 6.4.15 Ultraleap Ltd.
- 6.4.16 Pico Interactive
- 6.4.17 DPVR (Deepoon)
- 6.4.18 TeamViewer (Frontline)
- 6.4.19 Epson (Moverio)
- 6.4.20 Avegant Corporation
- 6.4.21 Valve Corporation
- 6.4.22 Snap Inc.
- 6.4.23 Niantic, Inc.
- 6.4.24 Vuzix Corporation
- 6.4.25 Autodesk Inc.
7 MARKET OPPORTUNITIES AND FUTURE OUTLOOK
- 7.1 White-Space and Unmet-Need Assessment