
|
시장보고서
상품코드
2063954
GPU 가상화 시장 : 점유율 분석, 업계 동향과 통계, 성장 예측(2026-2031년)GPU Virtualization - Market Share Analysis, Industry Trends & Statistics, Growth Forecasts (2026 - 2031) |
||||||
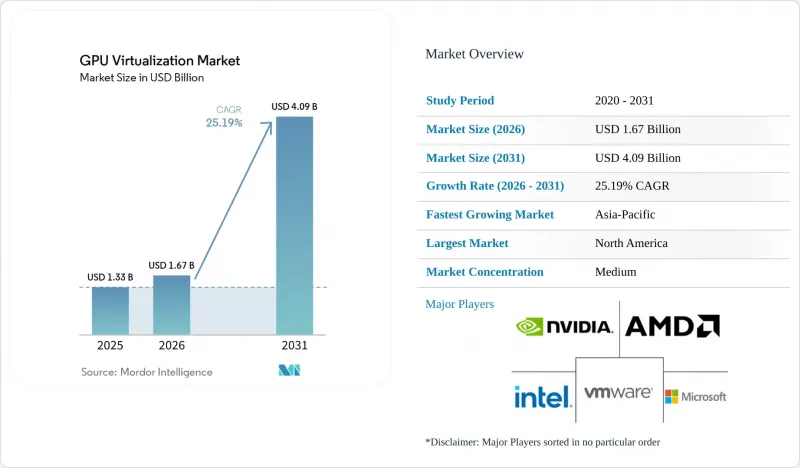
Mordor Intelligence에 의하면, GPU 가상화 시장 규모는 2025년 13억 3,000만 달러에서 2026년에는 16억 7,000만 달러로 확대되어 2031년까지 40억 9,000만 달러에 이를 것으로 예측되며, 2026년부터 2031년까지 CAGR 25.19%로 성장할 전망입니다.

본 보고서는 가상화 기술의 유형(타임슬라이스형(소프트웨어 기반) GPU 가상화 등), 도입 모델(On-Premise 데이터센터, 퍼블릭 클라우드 등), 워크로드의 유형(AI/ML 워크로드, 그래픽 및 시각화 등), 최종 사용자 유형(기업, 클라우드 서비스 제공업체(CSP) 등) 및 지역별로 분류되어 있습니다. 시장 전망은 금액(달러) 기준으로 제시되어 있습니다.
세계 GPU 가상화 시장 동향과 인사이트
엔터프라이즈 워크로드에서 AI 가속화 기술 도입 확대
기업들은 현재 50밀리초 미만의 응답 시간이 필요한 고객용 용도에 생성형 AI의 추론 기능을 통합하고 있습니다. 타임 슬라이스 가상화를 통해 단일 데이터센터 GPU에서 8-16개의 동시 추론 스트림을 처리할 수 있게 되어, 쿼리당 비용을 3분의 2 가까이 절감할 수 있습니다. 금융 기관들은 부정 행위 감지를 위해 가상화된 RTX 6000 Ada 카드를 도입하고 있으며, 병원에서는 전용 시스템을 도입하지 않고 공유 가속기에서 진단 모델을 실행하고 있습니다. ARM 기반 엣지 GPU에 최적화된 경량 스택 덕분에 이러한 효율성은 클라우드 외부로도 확대되고 있지만, CUDA에 대한 의존성으로 인해 경쟁사의 칩이 가격 대비 성능 면에서 개선되었음에도 불구하고 많은 조직이 NVIDIA의 로드맵에 얽매여 있습니다.
GPU 가속 하드웨어를 위한 데이터센터의 업데이트 주기
하이퍼스케일러는 트랜스포머 모델에서 10-20배의 처리량을 실현하는 GPU 노드로 CPU 중심의 서버를 대체함으로써, 교체 주기를 3년으로 단축하고 있습니다. H200 및 Blackwell GPU를 탑재한 새로운 클라우드 인스턴스에는 테라바이트급 HBM3e와 멀티테라비트급 상호 연결이 탑재되어 있지만, 이러한 구성이 진정한 가치를 발휘하는 것은 가상화를 통해 소규모 테넌트로 세분화된 슬라이스가 할당된 경우에 한합니다. 이러한 관행으로 인해, 중견 공급업체들이 이전 세대의 가속기를 확보하여 노후화된 하드웨어에서 새로운 가치를 창출해내는 가상화 플랫폼을 운영하는 2차 시장이 형성되고 있습니다.
GPU 하드웨어의 높은 총 소유 비용
플래그십 8GPU 서버는 25만-30만 달러에 판매되고 있으며, 3년 이내에 감가상각되므로 실리콘 결함이 발생하기 전부터 ROI가 떨어지게 됩니다. 가상화의 연간 라이선스 비용은 이용률과 관계없이 GPU 1대당 1,000-2,000달러가 부과됩니다. 또한, 랙 1대당 전기 요금은 최대 1만 5,000달러에 달할 전망입니다. 공급망의 리드타임이 길기 때문에 구매자는 1년 치 비용을 선불로 지불해야 하며, 이는 중견 공급업체에게 자금 조달에 있어 큰 장벽이 되고 있습니다.
부문별 분석
2025년 기준으로 타임 슬라이스형 소프트웨어 부문은 GPU 가상화 시장 점유율의 47.22%를 차지했으나, 하드웨어 지원형 파티셔닝은 2031년까지 연평균 성장률(CAGR) 25.44%라는 최고 수준으로 성장하고 있습니다. 자율 시스템 및 의료용 영상 처리 분야에서 결정론적 지연 시간이 중요시되면서, 하드웨어 지원형 파티셔닝에 대한 관심이 높아지고 있습니다. 2025년 시점에서 타임 슬라이스형 소프트웨어를 활용한 GPU(그래픽 처리 장치) 가상화 시장 규모는 여전히 컸으나, 기업들이 보장된 응답 시간을 대가로 인스턴스 크기의 고정을 감수하는 트레이드오프를 수용함에 따라 하드웨어 파티셔닝이 가장 높은 연평균 성장률(CAGR)을 기록하고 있습니다. 한편, API 수준의 방식은 그래픽 프레임 속도를 제한하는 프로토콜로 인한 오버헤드가 있기 때문에 틈새 시장 수준에 머물러 있습니다.
부정 감지나 음성 AI를 운영하는 기업들은 미세한 지터가 허용되는 배치 추론에서 여전히 타임 슬라이싱을 선호하고 있습니다. 그럼에도 불구하고, 차세대 실리콘에 통합된 기밀 연산 기능은 최대 50%의 프리미엄을 제공하여, 투자를 하드웨어 파티셔닝 쪽으로 기울게 하고 있습니다. 드라이버 수준의 가상화는 씬 클라이언트가 5G를 통해 스트리밍을 수행하는 엣지 영역에서 다시금 중요성이 커지고 있으며, 통신 사업자들이 GPU와 무선 액세스 기능을 패키지로 묶음에 따라 이 분야는 확대될 전망입니다.
퍼블릭 클라우드 부문은 2025년 매출의 50.15%를 차지했으나, 하이브리드 및 멀티 클라우드 전략은 2031년까지 연평균 성장률(CAGR)이 25.34%로 가장 높은 성장세를 보였습니다. 퍼블릭 클라우드의 그래픽 처리 장치(GPU)는 종량제 덕분에 여전히 지배적인 위치를 차지하고 있지만, 기업들은 현재 연간 2,000시간을 초과하는 워크로드의 경우 자체 소유 클러스터를 사용하는 것이 비용이 더 저렴할 것으로 추산하고 있습니다. 따라서 하이브리드 도입에 따른 GPU 가상화 시장 규모는 2031년까지 가장 빠르게 확대될 것입니다. 유럽 및 아시아태평양의 데이터 주권 규제로 인해, 규제 대상이 되는 AI 훈련은 국내 인프라로 이전되고 있으며, 부하가 최고조에 달할 때는 클라우드로 확장되는 하이브리드 토폴로지가 확산되고 있습니다.
그러나 스케줄러가 On-Premise vSphere 풀, AWS 계정 및 브로커의 스팟 용량을 동시에 관리하려고 하면 오케스트레이션이 복잡해집니다. 이러한 영역에 걸친 관리를 통합하는 상용 번들은 가격이 비싼 데다, 벤더 고유의 상호운용성이 진정한 이식성을 제한하고 있음에도 불구하고, 비용에 민감한 사용자들이 오픈소스 스택으로 눈을 돌리게 하고 있습니다. 신흥 스팟 시장은 락인을 최소화하도록 아키텍처를 설계한 조직에 유리하게 작용합니다.
지역별 분석
2025년, 북미는 GPU 가상화 시장을 주도했으며, 하이퍼스케일러가 50만 대 이상의 GPU를 도입함에 따라 시장 가치의 46.67%를 차지했습니다. 수출 규제로 인해 고성능 가속기가 국내에 머물게 되면서 중고 시장 가격을 끌어올렸을 뿐만 아니라, 실리콘 가동 시간을 최대한 활용하기 위한 보다 고도화된 가상화를 촉진했습니다. 성숙한 기업 소프트웨어 생태계는 기밀 데이터를 격리해야 하는 금융 및 의료 분야의 사용자들 사이에서 이 소프트웨어의 도입을 더욱 촉진했습니다.
아시아태평양은 중국, 인도, 일본의 국가 주도의 AI 투자에 힘입어 2031년까지 연평균 성장률(CAGR)이 26.21%에 달하며, 가장 빠르게 성장하고 있는 지역입니다. Ascend 910C와 같은 국산 가속기는 소프트웨어 생태계를 세분화하는 대체 가상화 계층의 출현을 촉진했습니다. 12억 달러 규모의 인도 국가 AI 인프라 구상은 가상 슬라이스를 통해 접근 가능한 공유 GPU 클러스터에 자금을 지원하고 있는 반면, 일본의 통신 사업자들은 지연 시간이 중요한 관광용 앱을 지원하기 위해 엣지 풀을 구축하고 있습니다. 한국의 주요 메모리 기업들은 HBM3e의 생산 규모를 확대하며, 지역 내 공급 탄력성을 강화하고 있습니다.
유럽의 에너지 효율 지침에 따라 GPU 리소스의 통합이 가속화되고 있으며, 사업자들은 전용 추론 서버를 공유 클러스터로 가상화하여 전력 사용 효율(PUE)을 1.3 미만으로 유지해야 하는 압박을 받고 있습니다. 독일의 주권 클라우드 규제와 영국의 AI 안전 연구소는 모두 On-Premise 또는 국내 소유의 인프라를 의무화하고 있으며, 비용 관리 측면에서 가상화가 핵심이 됩니다. 중동, 남미, 아프리카 시장은 여전히 규모가 작지만, 엄격한 데이터 주권법 하에서 지역 공급업체들이 현지화된 GPU 서비스를 출시함에 따라 두 자릿수 성장률을 유지하고 있습니다.
기타 혜택:
- 엑셀 형식 시장 예측(ME) 시트
- 3개월간의 애널리스트 지원
자주 묻는 질문
목차
제1장 서론
제2장 조사 방법
제3장 주요 요약
제4장 시장 구도
제5장 시장 규모와 성장 예측
제6장 경쟁 구도
제7장 시장 기회와 향후 전망
JHS 26.06.23According to Mordor Intelligence, the gPU virtualization market size is expected to increase from USD 1.33 billion in 2025 to USD 1.67 billion in 2026 and reach USD 4.09 billion by 2031, growing at a CAGR of 25.19% over 2026-2031.
This report is Segmented by Virtualization Technology Type (Time-Sliced (Software-Based) GPU Virtualization, and More), Deployment Model (On-Premise Data Centers, Public Cloud, and More), Workload Type (AI / ML Workloads, Graphics and Visualization, and More), End-User Type (Enterprises, Cloud Service Providers (CSPs), and More), and Geography. The Market Forecasts are Provided in Terms of Value (USD).
Global GPU Virtualization Market Trends and Insights
Rising Adoption of AI Acceleration in Enterprise Workloads
Enterprises now embed generative-AI inference into customer-facing applications that require sub-50-millisecond responses. Time-sliced virtualization lets a single data-center GPU serve 8-16 concurrent inference streams, cutting per-query cost by nearly two-thirds. Financial institutions deploy virtualized RTX 6000 Ada cards for fraud detection, and hospitals run diagnostic models on shared accelerators without procuring dedicated systems. Lightweight stacks optimized for ARM-based edge GPUs extend these efficiencies outside the cloud, yet dependence on CUDA locks many organizations into NVIDIA's roadmap despite price-performance gains from rival silicon.
Data-Center Refresh Cycles Toward GPU-Accelerated Hardware
Hyperscalers shorten refresh cycles to three years by replacing CPU-centric servers with GPU nodes that deliver 10-20X greater throughput on transformer models. New cloud instances sporting H200 and Blackwell GPUs arrive with terabytes of HBM3e and multi-terabit interconnects, configurations that only pay off when virtualization allocates fractional slices to smaller tenants. The practice creates a secondary market in which mid-tier providers acquire previous-generation accelerators and run virtualization platforms that squeeze fresh value from aging hardware.
High Total Cost of Ownership for GPU Hardware
Flagship 8-GPU servers list at USD 250,000-300,000 and depreciate within three years, eroding ROI even before silicon failure. Annual license fees for virtualization add USD 1,000-2,000 per GPU independent of utilization, while electricity bills for a single rack run up to USD 15,000. Long supply-chain lead times force buyers to pre-pay a year ahead, an obstacle that mid-tier providers struggle to finance.
Other drivers and restraints analyzed in the detailed report include:
- Surge in Cloud Gaming and Immersive Media Consumption
- Growing Demand for Secure Multi-Tenant GPU Sharing
- Software Stack Fragmentation Across Hypervisors
For complete list of drivers and restraints, kindly check the Table Of Contents.
Segment Analysis
The Time-sliced software segment held 47.22% of the GPU virtualization market share in 2025, while hardware-assisted partitioning is advancing at the highest CAGR of 25.44% through 2031. Hardware-assisted partitioning now captures rising attention because deterministic latency matters for autonomous systems and medical imaging. The GPU (Graphics Processing Unit) virtualization market size for time-sliced software remained larger in 2025, yet hardware partitioning posts the strongest CAGR as enterprises accept the trade-off of fixed instance sizes in exchange for guaranteed response times. Meanwhile, API-level schemes stay niche due to protocol overhead that caps graphics frame rates.
Enterprises that run fraud detection and voice AI continue to favor time-slicing for batch inference where micro-jitters are tolerable. Still, confidential-computing features baked into next-generation silicon attach premiums of up to 50%, tilting investments toward hardware partitioning. Driver-level virtualization regains relevance at the edge where thin clients stream over 5G, an area likely to expand as telecom operators package GPUs with radio-access functions.
The public cloud segment captured 50.15% of 2025 revenue, yet hybrid and multi-cloud strategies posted the fastest CAGR of 25.34% through 2031. Public-cloud Graphics Processing Units remain dominant thanks to pay-as-you-go pricing, but enterprises now calculate that workloads exceeding 2,000 hours yearly cost less on owned clusters. The Graphics Processing Unit virtualization market size attributed to hybrid deployments therefore expands fastest to 2031. Data-sovereignty mandates across Europe and Asia-Pacific push regulated AI training onto in-country infrastructure, encouraging hybrid topologies that burst into the cloud during spikes.
However, orchestration grows complex when schedulers juggle on-premise vSphere pools, AWS accounts, and spot capacity from brokers. Commercial bundles that unify management across these domains carry price premiums, nudging cost-sensitive users toward open-source stacks even as vendor-specific interconnects limit true portability. The emerging spot market favors organizations that architect for minimal lock-in.
Geography Analysis
North America led the GPU virtualization market in 2025, accounting for 46.67% of value as hyperscalers deployed more than 500,000 GPUs. Export controls kept high-end accelerators domestic, inflating secondary-market prices and encouraging deeper virtualization to maximize every silicon hour. A mature enterprise-software ecosystem further stimulated adoption among finance and healthcare users that must isolate sensitive data.
Asia-Pacific is the fastest-growing region with a CAGR of 26.21% to 2031, thanks to sovereign-AI investments in China, India, and Japan. Domestic accelerators such as Ascend 910C have spurred alternative virtualization layers that fragment the software ecosystem. India's USD 1.2 billion national AI infrastructure initiative funds shared GPU clusters accessible via virtual slices, while Japanese telcos deploy edge pools to serve latency-critical tourism apps. South Korea's memory giants scale HBM3e output, strengthening regional supply resilience.
Europe's energy-efficiency directive accelerates consolidation of GPU resources, pushing operators to virtualize dedicated inference servers into shared clusters and reduce power-usage effectiveness below 1.3. Germany's sovereign-cloud rules and the United Kingdom's AI Safety Institute both require on-premise or domestically owned infrastructure, making virtualization key to cost control. Markets in the Middle East, South America, and Africa remain small but grow at double-digit rates as regional providers launch localized GPU services under strict data-sovereignty statutes.
- NVIDIA Corporation
- Advanced Micro Devices, Inc.
- Intel Corporation
- VMware, Inc.
- Nutanix, Inc.
- Microsoft Corporation
- Amazon Web Services, Inc.
- Google LLC
- Citrix Systems, Inc.
- Huawei Technologies Co., Ltd.
- Alibaba Cloud
- Oracle Corporation
- Red Hat, Inc.
- Penguin Computing, Inc.
- GigaIO Networks
- Dell Technologies Inc.
- Hewlett Packard Enterprise Company
- IBM Corporation
- Run:ai
- Qualcomm Technologies, Inc.
- Super Micro Computer, Inc.
Additional Benefits:
- The market estimate (ME) sheet in Excel format
- 3 months of analyst support
TABLE OF CONTENTS
1 INTRODUCTION
- 1.1 Study Assumptions and Market Definition
- 1.2 Scope of the Study
2 RESEARCH METHODOLOGY
3 EXECUTIVE SUMMARY
4 MARKET LANDSCAPE
- 4.1 Market Overview
- 4.2 Market Drivers
- 4.2.1 Rising Adoption of AI Acceleration in Enterprise Workloads
- 4.2.2 Surge in Cloud Gaming and Immersive Media Consumption
- 4.2.3 Data-Center Refresh Cycles Toward GPU-Accelerated Hardware
- 4.2.4 Growing Demand for Secure Multi-Tenant GPU Sharing
- 4.2.5 Energy Efficiency Mandates Driving Consolidated GPU Resources
- 4.2.6 Edge Computing Rollouts Requiring Low-Latency GPU Pools
- 4.3 Market Restraints
- 4.3.1 High Total Cost of Ownership for GPU Hardware
- 4.3.2 Software Stack Fragmentation Across Hypervisors
- 4.3.3 Limited Workload Portability Between Clouds
- 4.3.4 Supply Chain Constraints for High-End GPUs
- 4.4 Industry Value Chain Analysis
- 4.5 Regulatory Landscape
- 4.6 Technological Outlook
- 4.7 Impact of Macroeconomic Factors on the Market
- 4.8 Porter's Five Forces Analysis
- 4.8.1 Competitive Rivalry
- 4.8.2 Bargaining Power of Buyers
- 4.8.3 Bargaining Power of Suppliers
- 4.8.4 Threat of New Entrants
- 4.8.5 Threat of Substitutes
5 MARKET SIZE AND GROWTH FORECASTS (VALUE)
- 5.1 By Virtualization Technology Type
- 5.1.1 Time-Sliced (Software-Based) GPU Virtualization
- 5.1.2 Hardware-Assisted GPU Partitioning
- 5.1.3 API / Driver-Level Virtualization
- 5.2 By Deployment Model
- 5.2.1 On-Premise Data Centers
- 5.2.2 Public Cloud
- 5.2.3 Hybrid / Multi-Cloud
- 5.3 By Workload Type
- 5.3.1 AI / ML Workloads
- 5.3.2 Graphics and Visualization
- 5.3.3 High-Performance Computing (HPC)
- 5.3.4 Media and Streaming
- 5.4 By End-User Type
- 5.4.1 Enterprises
- 5.4.2 Cloud Service Providers (CSPs)
- 5.4.3 Research and Academia
- 5.4.4 Telecom and Edge Operators
- 5.5 By Geography
- 5.5.1 North America
- 5.5.1.1 United States
- 5.5.1.2 Canada
- 5.5.1.3 Mexico
- 5.5.2 Europe
- 5.5.2.1 Germany
- 5.5.2.2 United Kingdom
- 5.5.2.3 Rest of Europe
- 5.5.3 Asia-Pacific
- 5.5.3.1 China
- 5.5.3.2 Japan
- 5.5.3.3 South Korea
- 5.5.3.4 India
- 5.5.3.5 Rest of Asia-Pacific
- 5.5.4 Rest of the World
- 5.5.1 North America
6 COMPETITIVE LANDSCAPE
- 6.1 Market Concentration
- 6.2 Strategic Moves
- 6.3 Market Share Analysis
- 6.4 Company Profiles (includes Global Level Overview, Market Level Overview, Core Segments, Financials as available, Strategic Information, Market Rank/Share, Products and Services, Recent Developments)
- 6.4.1 NVIDIA Corporation
- 6.4.2 Advanced Micro Devices, Inc.
- 6.4.3 Intel Corporation
- 6.4.4 VMware, Inc.
- 6.4.5 Nutanix, Inc.
- 6.4.6 Microsoft Corporation
- 6.4.7 Amazon Web Services, Inc.
- 6.4.8 Google LLC
- 6.4.9 Citrix Systems, Inc.
- 6.4.10 Huawei Technologies Co., Ltd.
- 6.4.11 Alibaba Cloud
- 6.4.12 Oracle Corporation
- 6.4.13 Red Hat, Inc.
- 6.4.14 Penguin Computing, Inc.
- 6.4.15 GigaIO Networks
- 6.4.16 Dell Technologies Inc.
- 6.4.17 Hewlett Packard Enterprise Company
- 6.4.18 IBM Corporation
- 6.4.19 Run:ai
- 6.4.20 Qualcomm Technologies, Inc.
- 6.4.21 Super Micro Computer, Inc.
7 MARKET OPPORTUNITIES AND FUTURE OUTLOOK
- 7.1 White-Space and Unmet-Need Assessment
