
|
시장보고서
상품코드
2064003
노동력 최적화 및 수요 예측 소프트웨어 시장 : 시장 점유율 분석, 업계 동향 및 통계, 성장 예측(2026-2031년)Labor Optimization And Demand Forecasting Software - Market Share Analysis, Industry Trends & Statistics, Growth Forecasts (2026 - 2031) |
||||||
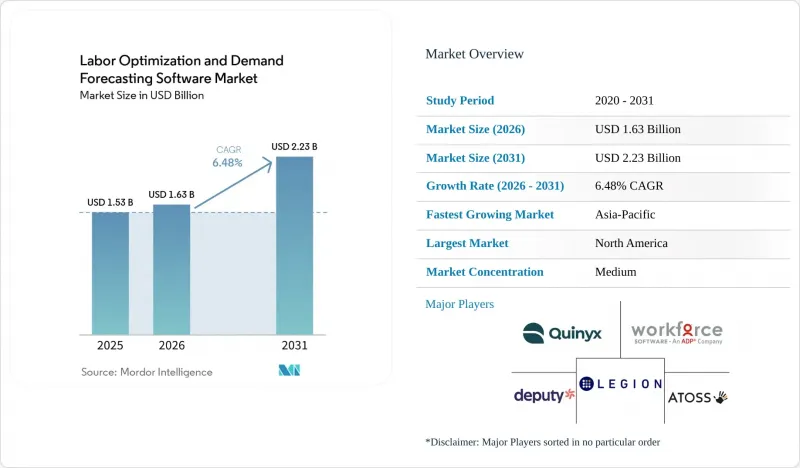
Mordor Intelligence에 의하면, 노동력 최적화 및 수요 예측 소프트웨어 시장 규모는 2025년 15억 3,000만 달러로 평가되었고, 2026년에는 16억 3,000만 달러로 추정되고, 2031년까지 22억 3,000만 달러에 이를 것으로 예상되며, 2026-2031년 CAGR 6.48%로 성장할 전망입니다.
본 보고서는 구성 요소별(소프트웨어 및 서비스(도입 및 통합 서비스 등)), 기능별(수요 예측 등), 배포 모델별(클라우드 기반 등), 조직 규모별(대기업 등), 최종 이용 산업별(소매 및 전자상거래 등) 및 지역별로 분류되어 있습니다. 시장 전망은 금액(달러) 기준으로 제시되어 있습니다.
세계의 노동력 최적화 및 수요 예측 소프트웨어 시장 동향과 인사이트
AI를 활용한 인력 분석 및 자동 스케줄링
에이전트형 AI가 인력 관리를 사후 보고에서 실시간 조치로 전환함에 따라, 노동력 최적화 및 수요 예측 소프트웨어 시장은 성장세를 보이고 있습니다. Legion Technologies는 2026년 1월, 예측, 스케줄링, 근태 관리, 노동력 최적화 등 각 분야에서 90개 이상의 AI 기능을 출시했으며, 이 회사의 풀 엔게이지먼트 스위트를 이용하는 고객사의 이직률이 평균 33% 개선되었다고 발표했습니다. 해당 보도자료에 따르면, Legion은 2025년에 216%의 매출 성장을 기록했으며, 이는 단순히 데이터를 시각화하는 데 그치지 않고 노동 관련 의사결정을 자동화할 수 있는 플랫폼에 대해 구매자들이 얼마나 긍정적인 반응을 보이고 있는지를 보여줍니다. UKG 역시 2025년 11월에 ‘Workforce Intelligence Hub’를 발표하며 시장의 AI 영역을 확대했습니다. 이는 연간 100억 건의 출퇴근 기록 데이터와 120억 건의 일정 처리를 포함한 대규모 운영 데이터셋을 바탕으로 구축되었습니다. 이러한 규모가 중요한 이유는 더 높은 품질의 데이터가 있다면 동일한 운영 뷰 내에서 예측 정확도, 초과근무 감지 및 직원의 웰빙 분석을 향상시킬 수 있기 때문입니다. 노동력 최적화 및 수요 예측 소프트웨어 시장이 성숙해짐에 따라, 보다 방대한 독자적인 데이터 풀을 보유한 공급업체는 신규 진출기업보다 정확도 측면에서 우위를 유지할 가능성이 높을 것으로 보입니다.
임금 인플레이션의 심화와 공정한 근로 주간 준수에 대한 압력
노동력 최적화 및 수요 예측 소프트웨어 시장은 일정 수립에 대한 규제가 강화됨에 따라, 인건비 산정 오류로 인한 비용 증가라는 요인에 의해서도 뒷받침되고 있습니다. GovDocs의 보고서에 따르면, 2026년까지 미국 내 8개 도시가 예측적 일정 수립 조례를 제정했으며, 로스앤젤레스 카운티의 조례는 2025년 7월 1일부터 발효되어 직원 300명 이상의 전국 소매업체에 적용됩니다. 시카고의 ‘공정한 노동 주간 조례’는 2025년 7월부터 적용 범위를 확대하여 연소득 기준을 62,561.9 달러로 상향 조정함으로써 보호 대상 근로자층을 넓혔을 뿐만 아니라, 다수의 사업장을 보유한 고용주의 규정 준수 리스크를 높였습니다. 고용주가 14일 전 사전 통지를 의무화하고, 일정 변경 지연 시 벌금을 납부해야 하는 경우, 예측 정확도가 낮으면 단순한 업무상의 불편에 그치지 않고 직접적인 인건비 손실로 이어집니다. 이것이 바로 노동력 최적화 및 수요 예측 소프트웨어 시장이 스케줄링 그 자체만큼이나 ‘수요 감지’와 밀접하게 연결되어 있는 이유입니다. 오리건주, 시카고, 시애틀, 필라델피아에서 시행되고 있는 이와 유사한 14일 전 통지 규정 역시 전국적으로 사업을 운영하는 기업들에게 규정 준수 부담이 더욱 표준화되고 있음을 보여주며, 이는 소프트웨어의 보다 광범위한 도입을 촉진하고 있습니다.
기존 HRIS, 급여 계산, ERP, POS 시스템과의 통합에 따른 복잡성
노동력 최적화 및 수요 예측 소프트웨어 시장은 구매자가 새로운 계획 도구를 기존의 급여 계산, HRIS, ERP, POS 시스템과 연동하려고 할 때 여전히 가장 큰 도입 장벽에 직면해 있습니다. Paycor에 따르면, 2024년 6월 가트너의 조사에서 HR 부서의 25% 미만이 HR 기술로부터 비즈니스 가치를 최대한 이끌어내고 있는 것으로 나타났으며, 그 주된 이유로 통합 실패가 꼽혔습니다. 핀치 씨는 상위 10개 급여 계산 서비스 제공업체가 미국 시장의 고작 62%만을 차지할 뿐이며, 데이터 구조가 다른 소규모 제공업체가 다수 존재해 이들 업체와의 연동을 위해서는 대개 맞춤형 매핑 작업이 필요하다고 지적했습니다. TimeCheck Software에 따르면, 시스템 간 연동이 이루어지지 않은 경우, 여러 사업장을 운영하는 고용주는 수동으로 데이터를 추출하거나 스프레드시트를 통해 대조하는 방식으로 급여 계산 입력 데이터를 통합하는 데 2-3일을 소요해야 할 수도 있습니다. 이러한 지연은 심각한 문제입니다. 왜냐하면 통합이 제대로 이루어지지 않으면 도입이 지연될 뿐만 아니라, 수요 예측 엔진에 제공되는 수요 데이터의 품질도 저하되기 때문입니다. 그 결과, 특히 많은 레거시 시스템을 보유하고 있으며 근로 데이터의 일관성이 부족한 고용주에게 있어, 노동력 최적화 및 수요 예측 소프트웨어 시장은 도입 중간 단계에서 규모를 확대하기가 더욱 어려워집니다.
부문별 분석
2025년 매출에서 소프트웨어가 차지한 비중은 62.44%였으며, 이는 현재의 도입 사례에서 소프트웨어 부문이 여전히 노동력 최적화 및 수요 예측 시장에서 가장 큰 점유율을 차지하고 있음을 보여줍니다. 코어 소프트웨어 스택이 그 입지를 유지할 수 있었던 이유는 스케줄링 엔진, 수요 모델, 규정 준수 규칙 및 분석 계층을 포함하고 있어, 이러한 요소들이 기업 고객에게 전환 비용을 발생시키기 때문입니다. 노동력 최적화 및 수요 예측 소프트웨어 시장에서 이러한 기능들은 구매자들이 일상적인 인력 계획, 실행 및 보고를 위해 의존하는 제품의 기반이 되고 있습니다. 또한, 벤더가 고객을 클라우드 연동형 상용 모델로 전환시킨 덕분에, 지난 몇 년간 구축된 정기 구독 사용자 기반도 소프트웨어 부문의 성장에 기여했습니다. 이러한 설치 기반을 통해 주요 제공업체들은 안정적인 수익원을 확보할 수 있을 뿐만 아니라, 시간이 지남에 따라 관련 기능을 추가할 여지도 넓어지고 있습니다.
서비스 부문은 더욱 빠르게 성장하고 있으며, 노동력 최적화 및 수요 예측 소프트웨어 시장의 서비스 규모는 2031년까지 연평균 성장률(CAGR) 9.12%로 확대될 것으로 전망됩니다. 이러한 성장은 소프트웨어의 산출물을 측정 가능한 인력 성과로 전환하기 위해 고용주들이 도입 지원, 관리형 분석, 그리고 변경 관리를 점점 더 필요로 하고 있다는 점, 즉 구매자의 행동에 나타난 뚜렷한 변화를 반영하고 있습니다. ATOSS의 보고서에 따르면, 2026년 1분기 클라우드 및 구독 매출은 전년 동기 대비 27% 증가한 2,700만 유로(2,890만 달러)를 기록했으며, 이는 분기 총매출의 53%를 차지했습니다. 또한, AI 기반 인력 관리 도구에는 재교육, 통합 시스템의 유지 관리, 그리고 ISO 27001, SOC 2, EU AI법 등의 프레임워크에 기반한 규정 준수 점검이 필요하기 때문에 도입 후 서비스 부하가 증가하게 됩니다. 따라서 노동력 최적화 및 수요 예측 소프트웨어 업계는 더 이상 라이선스 제공에만 그치지 않고, 업무 성과 및 규정 준수 현황과 연계된 지속적인 운영 지원 서비스도 함께 판매하고 있습니다.
2025년에는 수요 예측이 매출의 35.45%를 차지했으며, 노동력 최적화 및 수요 예측 소프트웨어 시장에서 가장 큰 기능 블록이 되었습니다. 이 지위는 수요 예측이 인력 예산 편성, 일정 수립 및 재예측의 기초가 되는 입력 정보로서의 역할을 반영하고 있습니다. 왜냐하면 부정확한 수요 신호는 하류 단계의 모든 계획 수립 활동의 질을 저하시킬 수 있기 때문입니다. 실무상, 고용주는 일정을 최적화하기 전에 거래 내역, 계절적 요인, 지역 행사 및 실시간 수요 변동을 종합적으로 반영하는 시스템이 필요합니다. 이것이 바로 벤더들이 더 광범위한 분석 기능과 작업 실행 도구를 추가하고 있음에도 불구하고, 수요 예측이 여전히 플랫폼 설계의 기반이 되고 있는 이유입니다. 이 범주는 여러 거점에 걸쳐 노동 관련 의사결정을 신속하고 일관되게 갱신해야 하는 다중 사업장 환경에서 특히 중요한 위치를 차지하고 있습니다.
인력 분석 및 성과 최적화는 가장 빠르게 성장하고 있는 기능 분야이며, 이 분야의 노동력 최적화 및 수요 예측 소프트웨어 시장 규모는 2031년까지 연평균 성장률(CAGR) 8.36%로 확대될 것으로 전망됩니다. 이러한 성장을 뒷받침하는 요인은 분석 모듈이 기존 고객을 대상으로 한 업그레이드 형태로 판매되는 경우가 많아, 벤더 입장에서는 신규 도입보다 더 신속하게 지속적인 수익 증대를 실현할 수 있다는 점에 있습니다. GFOS가 인용한 Logile의 2025년 인력 계획 설문조사에 따르면, 소매업 종사자의 77%가 '부실한 인력 계획이 수익에 부정적인 영향을 미친다'고 응답했으며, 80%는 인력 부족으로 인한 추가적인 스트레스와 과중한 업무 부담을 호소했습니다. 또한 Blue Yonder사는 자사가 개발한 창고용 AI가 입고 처리량 신호에 AI와 머신러닝을 적용함으로써, 근무 시작 몇 주 전부터 몇 분 전까지의 인력 예측을 개선할 수 있다고 밝혔습니다. 그 결과, 노동력 최적화 및 수요 예측 소프트웨어 시장에서는 단순히 일정 준수율을 측정하는 데 그치지 않고, 노동 생산성을 재무적 관점에서 정량화하는 도구가 더욱 중요시되고 있습니다. 노동력 최적화 및 수요 예측 소프트웨어 업계에서 이는 예측의 핵심 기능이 이미 갖춰져 있다면, 분석이 강력한 사업 확장의 발판이 될 수 있음을 의미합니다.
지역별 분석
2025년, 북미는 매출의 36.81%를 차지했으며, 지역별로는 노동력 최적화 및 수요 예측 소프트웨어 시장에서 가장 큰 점유율을 기록했습니다. 이 지역의 경쟁력은 엄격한 규정 준수 체계, 대규모 기업 고객 기반, 그리고 성숙한 AI 로드맵을 갖춘 인력 관리 벤더들이 집중되어 있다는 점에 힘입고 있습니다. 미국에서는 주요 도시 및 카운티의 예측 기반 스케줄링 관련 법률로 인해 소매업체 및 기타 다중 지점 사업주들이 수작업으로 규정 준수 조치를 취하기가 어려워지고 있습니다. 이러한 압박으로 인해 수요 예측, 일정 관리, 감사 대응이 가능한 기록 관리를 단일 워크플로우로 통합한 시스템의 가치가 높아지고 있습니다. 노동력 최적화 및 수요 예측 소프트웨어 시장에서 북미가 여전히 상업의 중심지로 자리 잡고 있는 것은 규제의 복잡성과 기업 규모가 서로를 보완하고 있기 때문입니다.
유럽은 독일, 영국, 프랑스의 견인 덕분에 노동력 최적화 및 수요 예측 소프트웨어 시장에서 지역별 2위를 차지하고 있습니다. 해당 지역 수요는 ‘공정한 근로 주간’에 관한 법률에 의해서만 형성되는 것보다는 공동 결정 규칙, 의무적인 근태 기록, 그리고 EU AI법에서 고용 AI를 고위험 이용 사례로 취급하는 점에 의해 좌우되고 있습니다. 독일에서는 2026년부터 전자식 근태 기록이 의무화될 전망이며, 이는 디지털 워크포스 시스템 도입의 직접적인 규정 준수 요인이 될 것입니다. 또한, 유럽의회가 2025년 말에 알고리즘 관리에 대한 감독 강화를 요구한 것은 단기적으로는 도입에 걸림돌이 될 수 있지만, 장기적으로는 설명 가능하고 감사 가능한 소프트웨어로의 전환을 촉진하게 될 것입니다.
아시아태평양은 가장 빠르게 성장하는 지역이며, 노동력 최적화 및 수요 예측 소프트웨어 시장은 2031년까지 연평균 성장률(CAGR) 8.77%로 확대될 것으로 전망됩니다. 소매업체, 레스토랑 체인, 제조업체들이 처음으로 대규모로 업무의 디지털화를 추진하는 가운데, 중국, 인도, 호주, 한국, 일본이 성장을 주도하고 있습니다. GaiaWorks에 따르면, 아시아태평양의 소매 및 외식 업계 고객을 대상으로 한 도입 사례에서 인건비 배분 정확도가 99%에 달했으며, 이는 해당 지역에서 수작업에 의존하던 스케줄링 방식에서 벗어나도록 돕고 있습니다. 중동에서는 노동력 현대화 프로그램과 조직화된 소매, 물류, 호텔·관광 산업의 확장에 따라 도입이 진행되고 있지만, 아프리카와 남미는 노동 집약적 부문의 제도화와 관련된 초기 단계의 기회에 그치고 있습니다.
기타 혜택 :
- 엑셀 형식 시장 예측(ME) 시트
- 3개월간의 애널리스트 지원
자주 묻는 질문
목차
제1장 서론
제2장 조사 방법
제3장 주요 요약
제4장 시장 구도
제5장 시장 규모 및 성장 예측
제6장 경쟁 구도
제7장 시장 기회 및 향후 전망
AJY 26.06.24According to Mordor Intelligence, the labor optimization and demand forecasting software market size is expected to increase from USD 1.53 billion in 2025 to USD 1.63 billion in 2026 and reach USD 2.23 billion by 2031, growing at a CAGR of 6.48% over 2026-2031.

This report is Segmented by Component (Software, and Services [Implementation and Integration Services, and More]), Functionality (Demand Forecasting, and More), Deployment Model (Cloud-Based, and More), Organization Size (Large Enterprises, and More), End-Use Industry (Retail and E-Commerce, and More), and Geography. The Market Forecasts are Provided in Terms of Value (USD).
Global Labor Optimization And Demand Forecasting Software Market Trends and Insights
AI-Driven Workforce Analytics and Automated Scheduling
The labor optimization and demand forecasting software market is gaining momentum as agentic AI shifts workforce management from post-facto reporting to in-the-moment action. Legion Technologies launched more than 90 AI features in January 2026 across forecasting, scheduling, time and attendance, and labor optimization, and said customers using its full engagement suite saw an average 33% improvement in retention. The same release said Legion recorded 216% revenue growth in 2025, showing how strongly buyers are responding to platforms that can automate labor decisions rather than just visualize them. UKG also expanded the market's AI layer in November 2025 with Workforce Intelligence Hub, built on a large operating data set that includes 10 billion punches and 12 billion schedules processed each year. That scale matters because better data improves forecast quality, overtime detection, and workforce well-being analysis in the same operating view. As the labor optimization and demand forecasting software market matures, vendors with deeper proprietary data pools are likely to hold a stronger accuracy advantage than newer challengers.
Rising Wage Inflation and Fair Workweek Compliance Pressure
The labor optimization and demand forecasting software market is also being supported by the rising cost of labor errors when scheduling rules tighten. GovDocs reported that 8 U.S. cities had enacted predictive scheduling ordinances in 2026, and Los Angeles County's ordinance took effect on July 1, 2025, for retail employers nationwide with 300 or more employees. Chicago's Fair Workweek Ordinance widened coverage in July 2025 by raising the wage threshold to USD 62,561.9 per year, expanding the pool of protected workers, and increasing compliance exposure for employers with many locations. When employers must give 14-day advance notice and pay penalties for late schedule changes, weak forecasting creates direct payroll leakage rather than merely operational inconvenience. This is why the labor optimization and demand forecasting software market is increasingly tied to demand sensing as much as to scheduling itself. Similar 14-day notice rules across Oregon, Chicago, Seattle, and Philadelphia also point to a more standardized compliance burden for national operators, which supports broader software adoption.
Legacy HRIS, Payroll, ERP, and POS Integration Complexity
The labor optimization and demand forecasting software market still faces its largest deployment barrier when buyers try to connect new planning tools with old payroll, HRIS, ERP, and POS systems. Paycor said a June 2024 Gartner survey found fewer than 25% of HR functions were maximizing business value from their HR technology, and integration failures were a primary reason. Finch noted that the top 10 payroll providers account for only 62% of the U.S. market, leaving a long tail of smaller providers with different data structures that often require custom mapping work. TimeCheck Software said disconnected systems can force multi-location employers to spend 2 to 3 days consolidating payroll inputs through manual extraction and spreadsheet reconciliation. These delays matter because poor integration not only slows deployment but also weakens the quality of the demand data feeding the forecast engine. That makes the labor optimization and demand forecasting software market harder to scale in the mid-implementation phase, especially for employers with many legacy systems and inconsistent labor data.
Other drivers and restraints analyzed in the detailed report include:
- Omnichannel and Shorter Fulfillment Windows Increasing Labor Volatility
- Cloud Adoption by Multi-Site Midmarket Employers
- Data Privacy and Algorithmic Compliance Risk
For complete list of drivers and restraints, kindly check the Table Of Contents.
Segment Analysis
Software accounted for 62.44% of revenue in 2025, indicating that the software layer remained the largest share of the labor optimization and demand forecasting market in current deployments. The core software stack kept that position because it houses the scheduling engines, demand models, compliance rules, and analytics layers that create switching costs for enterprise customers. In the labor optimization and demand forecasting software market, these functions are the foundation of the products buyers rely on every day for labor planning, execution, and reporting. Software also benefited from the installed base of recurring subscriptions built over the past several years as vendors shifted customers toward cloud-linked commercial models. That installed base gives leading providers a reliable revenue stream and more room to attach adjacent capabilities over time.
Services is the faster-growing component, with the labor optimization and demand forecasting software market size for services projected to expand at a 9.12% CAGR through 2031. This growth reflects a clear shift in buyer behavior, as employers increasingly need implementation support, managed analytics, and change management to turn software output into measurable labor results. ATOSS reported that cloud and subscription revenue rose 27% year over year to EUR 27 million (USD 28.9 million) in Q1 2026, accounting for 53% of total quarterly sales. AI-led workforce tools also require retraining, integration upkeep, and compliance checks under frameworks such as ISO 27001, SOC 2, and the EU AI Act, which increases the service's load after deployment. That is why the labor optimization and demand forecasting software industry is not only selling licenses anymore, it is also selling ongoing operating support tied to labor performance and compliance readiness.
Demand forecasting accounted for 35.45% of revenue in 2025, which made it the largest functional block in the labor optimization and demand forecasting software market. That position reflects its role as the base input for labor budgeting, scheduling, and reforecasting, because poor demand signals degrade the quality of every downstream planning action. In practical terms, employers need the system to merge transaction history, seasonality, local events, and real-time demand changes before any schedule can be optimized. This is why demand forecasting continues to anchor platform design, even as vendors add broader analytics and task-execution tools. The category remains especially important in multi-site environments where labor decisions must be updated quickly and consistently across many locations.
Workforce analytics and performance optimization is the fastest-growing functional segment, and the labor optimization and demand forecasting software market size for this area is projected to rise at an 8.36% CAGR through 2031. Growth is being supported by the fact that analytics modules are often sold into existing customers as upgrades, which gives vendors a faster path to incremental recurring revenue than a full new deployment. Logile's 2025 labor planning study, cited by GFOS, found that 77% of retail employees said poor labor planning hurts revenue, and 80% reported additional stress or overload due to understaffing. Blue Yonder also said its warehouse AI can improve labor forecasting from weeks ahead to minutes ahead of a shift by applying AI and machine learning to inbound throughput signals. As a result, the labor optimization and demand forecasting software market is placing greater emphasis on tools that quantify labor productivity in financial terms rather than solely measuring schedule adherence. In the labor optimization and demand forecasting software industry, this makes analytics a strong expansion path once the forecasting core is already in place.
Geography Analysis
North America accounted for 36.81% of revenue in 2025, giving the region the largest share in the labor optimization and demand forecasting software market by geography. The region's lead rests on a dense compliance framework, a large base of enterprise buyers, and a strong concentration of workforce management vendors with mature AI road maps. In the United States, predictive scheduling laws across major cities and counties have made manual compliance more difficult for retailers and other multi-site employers. That pressure raises the value of systems that combine demand sensing, scheduling, and audit-ready recordkeeping in a single workflow. In the labor optimization and demand forecasting software market, North America remains the commercial hub because regulatory complexity and enterprise scale reinforce one another.
Europe held the second-largest regional position in the labor optimization and demand forecasting software market, supported by Germany, the United Kingdom, and France. Demand in the region is shaped less by fair workweek laws alone and more by co-determination rules, mandatory time recording, and the EU AI Act's treatment of employment AI as a high-risk use case. Germany's expected shift toward mandatory electronic time recording from 2026 adds a direct compliance trigger for digital workforce systems. The European Parliament's late 2025 call for tighter oversight of algorithmic management also adds short-term friction to buying while encouraging a longer-term move toward explainable, auditable software.
Asia-Pacific is the fastest-growing region, and the labor optimization and demand forecasting software market is projected to expand at an 8.77% CAGR through 2031. Growth is being led by China, India, Australia, South Korea, and Japan, as retailers, restaurant chains, and manufacturers digitize labor operations at scale for the first time. GaiaWorks said its deployments across APAC retail and food-and-beverage clients achieved 99% accuracy in labor cost allocations, supporting the region's shift away from manual scheduling. Middle East adoption is rising with workforce modernization programs and the expansion of organized retail, logistics, and hospitality, while Africa and South America remain earlier-stage opportunities tied to formalization in labor-intensive sectors.
- UKG Inc.
- Blue Yonder Group, Inc.
- Quinyx AB
- Legion Technologies, Inc.
- Logile, Inc.
- ATOSS Software SE
- WorkForce Software, LLC
- Deputechnologies Pty Ltd
- 7shifts Employee Scheduling Software Inc.
- When I Work, Inc.
- Papershift GmbH
- TimeClock Plus, LLC
- Orcus Technologies, Inc. dba TimeForge
- GaiaWorks Asia Holding Limited
- Fourth Enterprises, LLC
- Kinaxis Inc.
- ToolsGroup B.V.
- o9 Solutions, Inc.
- Logility Supply Chain Solutions, Inc.
- Blue Ridge Solutions Inc.
- Lokad Inc.
Additional Benefits:
- The market estimate (ME) sheet in Excel format
- 3 months of analyst support
TABLE OF CONTENTS
1 INTRODUCTION
- 1.1 Study Assumptions and Market Definition
- 1.2 Scope of the Study
2 RESEARCH METHODOLOGY
3 EXECUTIVE SUMMARY
4 MARKET LANDSCAPE
- 4.1 Market Overview
- 4.2 Market Drivers
- 4.2.1 Rising Wage Inflation and Fair Workweek Compliance Pressure
- 4.2.2 Cloud Adoption by Multi-Site Midmarket Employers
- 4.2.3 AI-Driven Workforce Analytics and Automated Scheduling
- 4.2.4 Omnichannel and Shorter Fulfillment Windows Increasing Labor Volatility
- 4.2.5 Convergence of Store-Level Demand Forecasting, Labor Planning, and Fresh and Perishable Operations
- 4.2.6 Schedule Fairness, Earned Wage Access, and Frontline Retention Becoming a Shared Buying Criterion
- 4.3 Market Restraints
- 4.3.1 Legacy HRIS, Payroll, ERP, and POS Integration Complexity
- 4.3.2 Data Privacy and Algorithmic Compliance Risk
- 4.3.3 Sparse Intraday Demand Signals at Long-Tail Sites Reducing Forecast Quality
- 4.3.4 Works Council and Union Scrutiny of Black-Box Scheduling Decisions
- 4.4 Industry Value Chain Analysis
- 4.5 Regulatory Landscape
- 4.6 Technological Outlook
- 4.7 Impact of Macroeconomic Factors on the Market
- 4.8 Porter's Five Forces Analysis
- 4.8.1 Threat of New Entrants
- 4.8.2 Bargaining Power of Buyers
- 4.8.3 Bargaining Power of Suppliers
- 4.8.4 Threat of Substitutes
- 4.8.5 Intensity of Competitive Rivalry
5 MARKET SIZE AND GROWTH FORECASTS (VALUE)
- 5.1 By Component
- 5.1.1 Software
- 5.1.2 Services
- 5.1.2.1 Implementation and Integration Services
- 5.1.2.2 Consulting Services
- 5.1.2.3 Support and Maintenance Services
- 5.1.2.4 Training and Managed Services
- 5.2 By Functionality
- 5.2.1 Demand Forecasting
- 5.2.2 Labor Budgeting and Optimization
- 5.2.3 Workforce Scheduling
- 5.2.4 Intraday Management and Reforecasting
- 5.2.5 Task and Execution Planning
- 5.2.6 Workforce Analytics and Performance Optimization
- 5.3 By Deployment Model
- 5.3.1 Cloud-Based
- 5.3.2 On-Premise
- 5.4 By Organization Size
- 5.4.1 Large Enterprises
- 5.4.2 Small and Medium-Sized Enterprises
- 5.5 By End-Use Industry
- 5.5.1 Retail and E-commerce
- 5.5.2 Foodservice and Hospitality
- 5.5.3 Manufacturing
- 5.5.4 Transportation and Logistics
- 5.5.5 Healthcare and Life Sciences
- 5.5.6 Consumer Services and Leisure
- 5.5.7 Other End-Use Industries
- 5.6 By Geography
- 5.6.1 North America
- 5.6.1.1 United States
- 5.6.1.2 Canada
- 5.6.1.3 Mexico
- 5.6.2 South America
- 5.6.2.1 Brazil
- 5.6.2.2 Argentina
- 5.6.2.3 Chile
- 5.6.2.4 Rest of South America
- 5.6.3 Europe
- 5.6.3.1 Germany
- 5.6.3.2 United Kingdom
- 5.6.3.3 France
- 5.6.3.4 Italy
- 5.6.3.5 Spain
- 5.6.3.6 Russia
- 5.6.3.7 Rest of Europe
- 5.6.4 Asia-Pacific
- 5.6.4.1 China
- 5.6.4.2 Japan
- 5.6.4.3 India
- 5.6.4.4 Australia
- 5.6.4.5 South Korea
- 5.6.4.6 Rest of Asia-Pacific
- 5.6.5 Middle East
- 5.6.5.1 Saudi Arabia
- 5.6.5.2 United Arab Emirates
- 5.6.5.3 Turkey
- 5.6.5.4 Rest of Middle East
- 5.6.6 Africa
- 5.6.6.1 South Africa
- 5.6.6.2 Nigeria
- 5.6.6.3 Rest of Africa
- 5.6.1 North America
6 COMPETITIVE LANDSCAPE
- 6.1 Market Concentration
- 6.2 Strategic Moves
- 6.3 Market Share Analysis
- 6.4 Company Profiles (includes Global Level Overview, Market Level Overview, Core Segments, Financials as available, Strategic Information, Market Rank/Share, Products and Services, Recent Developments)
- 6.4.1 UKG Inc.
- 6.4.2 Blue Yonder Group, Inc.
- 6.4.3 Quinyx AB
- 6.4.4 Legion Technologies, Inc.
- 6.4.5 Logile, Inc.
- 6.4.6 ATOSS Software SE
- 6.4.7 WorkForce Software, LLC
- 6.4.8 Deputechnologies Pty Ltd
- 6.4.9 7shifts Employee Scheduling Software Inc.
- 6.4.10 When I Work, Inc.
- 6.4.11 Papershift GmbH
- 6.4.12 TimeClock Plus, LLC
- 6.4.13 Orcus Technologies, Inc. dba TimeForge
- 6.4.14 GaiaWorks Asia Holding Limited
- 6.4.15 Fourth Enterprises, LLC
- 6.4.16 Kinaxis Inc.
- 6.4.17 ToolsGroup B.V.
- 6.4.18 o9 Solutions, Inc.
- 6.4.19 Logility Supply Chain Solutions, Inc.
- 6.4.20 Blue Ridge Solutions Inc.
- 6.4.21 Lokad Inc.
7 MARKET OPPORTUNITIES AND FUTURE OUTLOOK
- 7.1 White-Space and Unmet-Need Assessment
