|
시장보고서
상품코드
2064526
조직 네트워크 분석 플랫폼 : 시장 점유율 분석, 업계 동향 및 통계, 성장 예측(2026-2031년)Organizational Network Analysis (ONA) Platform - Market Share Analysis, Industry Trends & Statistics, Growth Forecasts (2026 - 2031) |
||||||
 Mordor Intelligence
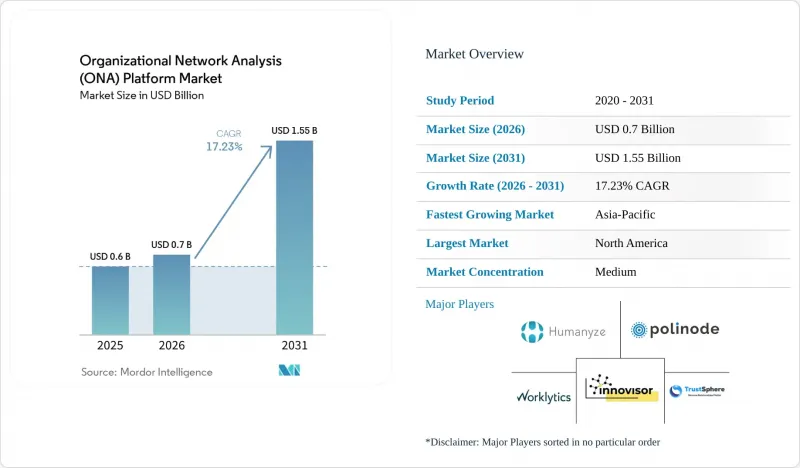
Mordor Intelligence에 의하면, 조직 네트워크 분석 플랫폼 시장 규모는 2025년 6억 달러로 평가되었습니다. 2026년 7억 달러에서 2031년까지 15억 5,000만 달러로 확대되어 2026년부터 2031년까지 연평균 복합 성장률(CAGR)은 17.23%를 나타낼 것으로 예측됩니다.
본 보고서는 구성 요소(플랫폼 및 서비스), 도입 모델(클라우드 기반, On-Premise형, 하이브리드형), 기업 규모(대기업 및 중소기업), 용도(조직 설계, 인재 계획 등), 최종 사용자 산업(BFSI 등) 및 지역별로 분류되어 있습니다. 시장 전망은 금액(달러) 기준으로 제시되어 있습니다.
세계의 조직 네트워크 분석 플랫폼 시장 동향 및 인사이트
하이브리드 근무 방식의 복잡화로 인해 협업 가시화에 대한 수요가 확대되고 있습니다.
조직 네트워크 분석 플랫폼 시장은 하이브리드 근무 방식으로부터 직접적인 견인력을 얻고 있습니다. 이는 매니저가 직원들이 실제로 어떻게 협업하고 있는지, 단순히 고정된 사무실에 출근하는 것만으로는 더 이상 확실히 파악할 수 없게 되었기 때문입니다. 2025년 보고서에 따르면, 직원들은 평일 하루 평균 275회의 업무 중단을 처리하고 153건의 Teams 메시지를 주고받는데, 이는 메시지 양만으로는 더 이상 생산적인 협업의 유용한 지표가 될 수 없는 이유를 보여줍니다. 이러한 상황에서는 정기적인 설문조사보다 수동적으로 수집된 네트워크 데이터의 가치가 더 높아지고 있습니다. 왜냐하면 수동적인 데이터는 반복되는 연결, 병목 현상, 조정 부담을 이러한 현상이 발생하는 순간에 포착할 수 있기 때문입니다. 또한, Worklytics는 2025년에, 사무실 복귀를 의무화한 그룹에서는 그 시행 후 긴밀한 협력 관계를 맺고 있는 구성원 간의 밀도가 낮아지는 경우가 많으며, 수동적인 ONA 신호를 활용하면 이직 4-6주 전에 70-80%의 정확도로 자발적 이직 위험을 파악할 수 있음을 밝혔습니다. 이 리드타임이 중요한 이유는 기업들이 조직 네트워크 분석 플랫폼을 일회성 진단이라기보다는 인재 유지, 거점 전략, 팀 재편과 연계된 지속적인 인재 계획 주기에 활용하기 시작했기 때문입니다.
번아웃 방지가 협업 과부하 분석을 중요하게 만드는 이유
조직 네트워크 분석 플랫폼 시장은 협업 과부하가 이직이나 집중력 저하로 이어지기 전에 이를 측정해야 할 필요성 덕분에 성장하고 있습니다. 2025년 10월, ONA 기반의 집중 블록을 활용하고 있는 SaaS 기업에서는 90일 이내에 ‘집중 시간’에 대한 주관적 평가가 22% 상승했고, 인지적 피로가 15% 감소했습니다. Worklytics는 2025년 조사에서 매개 중심성 측면에서 상위 10%에 속하는 직원은 전체 직원과 비교했을 때 번아웃에 빠질 가능성이 1.8배 더 높다는 사실을 밝혀냈습니다. 이 조사에 따르면, 주당 25시간 이상의 협업 시간을 기록한 팀은 혁신 성과가 23% 높은 반면, 이직 위험도 31% 높은 것으로 나타났습니다. 이에 따라 필요한 협업과 불필요한 업무 부담을 구분할 수 있는 플랫폼에 대한 수요가 증가하고 있으며, 조직 네트워크 분석 플랫폼 시장은 직원 건강 및 생산성과 관련된 광범위한 예산 범위 내에서 더욱 확고한 입지를 다져가고 있습니다.
데이터 개인정보 보호 및 윤리적 감시에 대한 우려
조직 네트워크 분석 플랫폼 시장은 개인정보 보호 규제로 인한 직접적인 제약을 겪고 있습니다. 이는 고용과 관련된 행동 데이터가 주요 법관할권 전반에 걸쳐 더욱 엄격한 감시의 대상이 되고 있기 때문입니다. 2025년에는 직원의 86%가 ONA 데이터 수집에 관한 정보 공개가 법적 요건이 되어야 한다고 생각했으며, 이는 도입이 시작되기도 전부터 이미 큰 신뢰 격차가 존재함을 보여주었습니다. 이 문제는 법적으로도 중대한 의미를 지닙니다. GDPR(EU 개인정보보호규정) 제83조(5)에 따르면, 직원 데이터의 불법적인 처리에 대해 전 세계 연간 매출액의 최대 4%에 해당하는 벌금이 부과될 수 있으므로, 거버넌스 체계가 미흡할 경우 그 위험은 더욱 커집니다. 2026년 4월에 발표된 조사에 따르면, 유럽 당국은 수동적 행동 모니터링에 대한 감시를 강화하고 있으며, EU AI법은 AI를 활용한 고용 시스템에 대해 새로운 평가 요건을 추가하고 있습니다. 그 결과, 투명성 확보를 위한 관리 기능, 동의 옵션, 그리고 관할 구역별 데이터 처리 기능을 제품에 탑재한 벤더들이 우위를 점하고 있는 반면, 강력한 개인정보 보호 전담팀을 갖추지 못한 중견 구매 기업들의 도입 속도는 더딘 임베디드니다.
부문별 분석
2025년 조직 네트워크 분석 플랫폼 시장에서 플랫폼형 솔루션이 74.20%를 차지했습니다. 이는 기업 전체 차원에서 네트워크 인텔리전스를 확장해야 하는 경우, 구매자가 프로젝트 중심의 서비스보다 지속적인 분석 계층을 선호한다는 것을 보여줍니다. 이러한 경향은 정기적인 조사 작업이 아닌 지속적인 수동적 분석으로의 전환과 일치합니다. 왜냐하면 지속적인 협업 데이터에는 활동을 대규모로 수집, 처리 및 시각화하기 위한 소프트웨어 인프라가 필요하기 때문입니다. 따라서 도입 지원이 여전히 중요함에도 불구하고, 조직 네트워크 분석 플랫폼 시장에서는 소프트웨어 중심의 매출이 계속해서 주류를 이루고 있습니다. 많은 고객의 경우, 첫 구매는 분산된 팀 전체에 걸친 네트워크 가시성을 확보하기 위한 단일하고 신뢰할 수 있는 정보원을 마련해야 할 필요성에 의해 이루어집니다. 이를 통해 플랫폼 계층은 데이터 거버넌스, 대시보드 및 향후 AI 지원 모델링의 제어 지점이 됩니다.
서비스 분야는 여전히 성장을 이어가고 있으며, 2031년까지 연평균 성장률(CAGR) 17.24%를 나타낼 것으로 전망됩니다. 이는 기업이 도입 초기 단계에서 전개 설계, 변경 대응, 거버넌스 및 맞춤형 모델링에 대한 지원이 필요한 경우가 많기 때문입니다. 조직 네트워크 분석 플랫폼 업계는 여전히 대규모의 복잡한 프로젝트에서 서비스 지원에 의존하고 있으며, 이러한 프로젝트의 경우 구매자들은 표준적인 온보딩이 아닌 맞춤형 통합 작업을 요구하고 있습니다. 시간이 지남에 따라 셀프 서비스를 통한 설정이나 더욱 강력한 템플릿 덕분에 일상적인 설정 작업이 제품 측으로 돌아갈 가능성이 높으며, 이로 인해 복잡성이 낮은 프로젝트에서 서비스의 역할은 축소될 것입니다. 동시에, 대규모 생태계 공급업체들은 서비스와 같은 기능을 자사 소프트웨어에 직접 통합하고 있으며, 이는 독립적인 자문 주도형 모델에 압박을 가하고 있습니다. 2026년 5월 Cornerstone이 출시한 ‘Workforce AI’는 186개국에 걸쳐 4,500만 명의 사용자와 55,000개 이상의 스킬 온톨로지를 아우르며, 과거에는 핵심 소프트웨어 외부에 존재했던 워크플로우의 심층적인 부분을 광범위한 플랫폼이 이를 어떻게 흡수해 나가고 있는지를 보여주고 있습니다.
2025년, 조직 네트워크 분석 플랫폼 시장에서 클라우드 기반 솔루션의 도입이 69.80%의 점유율을 차지했습니다. 이는 설정 과정이 빠르고, 인프라 부담이 적으며, 많은 구매자가 이미 이용하고 있는 SaaS 환경과의 호환성이 높기 때문입니다. 초기 도입은 주로 신속한 가치 실현을 추구하며, 데이터 소재지 관련 제약이 제한적이었던 기술 주도 기업들에 의해 이루어졌습니다. 따라서 속도, 실험, 지역 간 손쉬운 확장을 중시하는 구매자들에게 클라우드가 기본 모델이 되었습니다. 조직 네트워크 분석 플랫폼 시장은 현재도 이러한 ‘클라우드 우선’ 사용자들로부터 수요의 상당 부분을 확보하고 있습니다. 이는 해당 소프트웨어가 이미 클라우드상에서 가동 중인 디지털 협업 시스템과 긴밀하게 연동되어 있기 때문입니다. 이러한 도입 사례에서 도입 방식의 선택은 단순한 선호도라기보다는 다른 협업 스택과의 호환성을 중시한 경우가 많습니다.
현재 하이브리드 방식이 가장 빠르게 성장하고 있는 도입 형태이며, 규제 대상 업계가 클라우드 측의 분석 및 AI 기능을 활용하면서도 기밀성이 높은 직원 데이터를 방화벽 내부에 보관하려는 추세에 따라, 2031년까지 연평균 성장률(CAGR) 18.37%를 나타낼 것으로 예측됩니다. 이는 특히 BFSI(은행 및 금융 및 보험), 의료, 정부 기관에서 두드러지게 나타나며, 이러한 분야에서는 개인 데이터 관리가 조달 과정에서 핵심 과제로 대두되고 있습니다. 이 모델은 클라우드 도입 범위를 점차 확대하고 있지만, 아직 모든 직원 데이터를 외부 환경으로 이전할 준비가 되어 있지 않은 조직에게 매력적인 선택지입니다. On-Premise 배포는 국가 주권이나 국방상 중요한 환경에서 여전히 중요하지만, 그 역할은 엄격하게 관리되는 제한된 이용 사례에 점점 더 집중되고 있습니다. 규제 준수 요건이 강화됨에 따라, ONA 플랫폼 시장은 분석의 유연성과 더욱 엄격한 데이터 처리 간의 균형을 맞추는 하이브리드 설계로 계속해서 전환될 것으로 보입니다.
지역별 분석
2025년, 북미는 조직 네트워크 분석 플랫폼 시장 점유율의 41.30%를 차지했습니다. 이는 해당 지역이 대규모 하이브리드 근무제를 도입한 기업, 성숙한 인재 분석 프로그램, 그리고 순수한 ONA 벤더 및 스위트 벤더의 강력한 기반을 모두 갖추고 있기 때문입니다. 미국은 여전히 지역 수요의 주요 원천이며, 이미 대규모 디지털 협업 시스템을 도입한 기업들에 의해 도입이 촉진되고 있습니다. Microsoft Viva Insights는 기존 Microsoft 365 환경 내에서 ‘다양한 연결’, ‘강한 연결’, ‘영향력 순위’와 같은 지표를 활용할 수 있게 함으로써 플랫폼의 인지도 확대에 기여했습니다. 이는 ONA의 초기 도입 장벽을 낮추고, 구매자가 기본 지표에서 본격적인 플랫폼 구매로 이어지는 경로를 제공한다는 점에서 중요합니다. 캐나다와 멕시코는 해당 지역 내 점유율을 확대하고 있지만, 두 나라 모두 미국에 비해 도입이 초기 단계에 머물러 있습니다.
아시아태평양은 ONA 플랫폼 시장에서 가장 빠르게 성장하고 있는 지역으로, 2031년까지 연평균 성장률(CAGR) 17.89%를 기록하며 확대되고 있습니다. 2025년 3월 조사에 따르면, 아시아태평양 조직의 75% 가까이가 여전히 피플 애널리틱스 성숙도 레벨 1-2에 머물러 있는 반면, 북미 및 남미 지역 조직은 레벨 4에 집중되어 있으며, 이는 아직 ONA에 대한 대규모 투자를 하지 않은 구매자층이 광범위함을 시사합니다. 또한, 2025년에 실시된 또 다른 조사에 따르면, 아시아태평양의 HR 리더 중 73%가 지난 18개월 동안 HR 기술 플랫폼을 도입하거나 변경했으며, 46%는 예산이 증가할 것으로 예상한 것으로 나타났습니다. 이는 신규 ONA 공급업체 시장 진입에 유리한 환경임을 뒷받침합니다. 인도, 일본, 한국은 기술 서비스의 확대, HR 플랫폼의 개편, 그리고 분석 역량의 성숙도 제고를 통해 ONA 도입을 위한 견고한 기반이 마련되어 있다는 점에서 두드러집니다.
2025년 기준으로 유럽은 지역별 규모에서 2위를 차지했으며, 독일, 영국, 프랑스, 베네룩스 국가들이 조직 네트워크 분석 플랫폼 시장의 주요 수요 기반을 형성했습니다. 이 지역의 가장 큰 차이점은 규제가 엄격하다는 점에 있습니다. GDPR(EU 개인정보보호규정)의 시행과 EU AI법으로 인해, 다른 많은 시장에 비해 개인정보 보호 설계가 더 중요한 구매 결정 요인이 되고 있기 때문입니다. 이로 인해 규정 준수 비용이 증가하고 도입 주기가 길어지는 경우가 많기 때문에 강력한 동의 관리, 현지화 제어 및 ‘프라이버시 바이 디자인(Privacy by Design)’ 제품 아키텍처를 갖춘 공급업체가 유리한 입장에 서게 됩니다. 남미, 중동 및 아프리카는 여전히 초기 단계 시장이며, 수요는 다국적 기업의 자회사나 노동력의 현대화를 추구하는 최대 규모의 현지 기업에 집중되어 있습니다.
기타 혜택 :
- 엑셀 형식 시장 예측(ME) 시트
- 3개월간의 애널리스트 지원
자주 묻는 질문
목차
제1장 서론
제2장 조사 방법
제3장 주요 요약
제4장 시장 구도
제5장 시장 규모 및 성장 예측
제6장 경쟁 구도
제7장 시장 기회 및 향후 전망
KTH 26.06.24According to Mordor Intelligence, the organizational network analysis (ONA) platform market size is projected to expand from USD 0.60 billion in 2025 and USD 0.70 billion in 2026 to USD 1.55 billion by 2031, registering a CAGR of 17.23% between 2026 to 2031.
This report is Segmented by Component (Platform, and Services), Deployment Model (Cloud-Based, On-Premises, and Hybrid), Enterprise Size (Large Enterprises, and Small and Medium-Sized Enterprises), Application (Organizational Design, and Workforce Planning and More), End-User Industry (BFSI, and More), and Geography. The Market Forecasts are Provided in Terms of Value (USD).
Global Organizational Network Analysis (ONA) Platform Market Trends and Insights
Hybrid Work Complexity Expands Demand for Collaboration Visibility
The organizational network analysis (ONA) platform market is seeing direct support from hybrid work, as fixed office attendance no longer provides managers with a reliable view of how people actually work together. In 2025, it was reported that employees handled 275 interruptions a day and exchanged 153 Teams messages on a typical weekday, which shows why message volume alone is no longer a useful stand-in for productive collaboration. In this setting, passive network data has become more valuable than periodic surveys because it captures recurring ties, bottlenecks, and coordination strain as they happen. Worklytics also found in 2025 that return-to-office cohorts often lost close collaborator density after mandate implementation, and that passive ONA signals could identify voluntary departure risk 4-6 weeks before exits with 70-80% accuracy. That lead time matters because enterprises are now using the organizational network analysis platform market less for one-off diagnostics and more for ongoing workforce planning cycles tied to retention, location strategy, and team redesign.
Burnout Prevention Elevates Collaboration Overload Analytics
The organizational network analysis (ONA) platform market is also gaining from the need to measure collaboration overload before it turns into turnover or lower focus time. In October 2025, SaaS organizations using ONA-informed focus blocks saw a 22% rise in perceived focus time and a 15% drop in cognitive fatigue within 90 days. Worklytics found in 2025 that the top 10% of employees ranked by betweenness centrality were 1.8 times more likely to face burnout than the wider workforce. The same study showed that teams logging more than 25 weekly collaboration hours produced 23% higher innovation output but also carried 31% higher turnover risk. This is widening demand for platforms that can separate necessary collaboration from wasteful load, which gives the organizational network analysis platform market a stronger position within broader workforce health and productivity budgets.
Data Privacy and Ethical Surveillance Concerns
The organizational network analysis (ONA) platform market faces a direct restraint from privacy regulations, as employment-related behavioral data is now drawing closer scrutiny across major jurisdictions. In 2025, 86% of employees believed that disclosure of ONA data collection should be a legal requirement, indicating a significant trust gap before deployment even begins. The same issue carries legal weight because GDPR Article 83(5) allows fines of up to 4% of global annual turnover for unlawful processing of employee data, thereby raising the stakes for weak governance design. Research published in April 2026 noted that European authorities were increasing scrutiny of passive behavioral monitoring and that the EU AI Act adds new assessment demands for AI-assisted employment systems. As a result, vendors that build transparency controls, consent options, and jurisdiction-specific data-handling into their products are gaining an advantage, while mid-sized buyers without strong privacy teams are moving more slowly.
Other drivers and restraints analyzed in the detailed report include:
- M&A and Transformation Programs Need Influence Mapping
- Generative AI Enables Prescriptive Network Insights
- Integration Complexity Across Fragmented Collaboration Data Sources
For complete list of drivers and restraints, kindly check the Table Of Contents.
Segment Analysis
Platform solutions accounted for 74.20% of the organizational network analysis (ONA) platform market in 2025, indicating that buyers prefer a persistent analytics layer over project-led services when they need network intelligence to scale across the enterprise. This pattern aligns with the shift toward continuous passive analysis rather than periodic survey work because recurring collaboration data requires software infrastructure to ingest, process, and visualize activity at scale. The organizational network analysis platform market, therefore, continues to favor software-led revenue even when implementation support remains important. In many accounts, the first purchase is driven by the need to establish a single source of truth for network visibility across distributed teams. That makes the platform layer the control point for data governance, dashboarding, and future AI-assisted modeling.
Services are still growing and are projected to record a 17.24% CAGR through 2031 because enterprises often need help with deployment design, change support, governance, and custom modeling during early rollout stages. The organizational network analysis platform industry still relies on service support for large, complex accounts, where buyers want tailored integration work rather than standard onboarding. Over time, self-serve configuration and stronger templates are likely to shift routine setup work back into the product, which narrows the role of services in lower-complexity deals. At the same time, large ecosystem vendors are building service-like functionality directly into their software, which puts pressure on standalone advisory-led models. Cornerstone's May 2026 Workforce AI launch, covering 45 million users across 186 countries and more than 55,000 skills ontologies, shows how broad platforms are absorbing more of the workflow depth that once sat outside core software.
Cloud-based deployment held 69.80% of the organizational network analysis platform market share in 2025 because it offers faster setup, lower infrastructure burden, and a cleaner fit with the SaaS environments that many buyers already use. Early adoption largely came from technology-led enterprises that wanted quick time-to-value and faced limited data residency constraints. That made cloud the default model for buyers focused on speed, experimentation, and easier expansion across regions. The organizational network analysis (ONA) platform market still draws much of its current volume from those cloud-first users because the software is closely tied to digital collaboration systems that already run in the cloud. In these accounts, deployment choice has often been less about preference and more about matching the rest of the collaboration stack.
Hybrid deployment is now the fastest-growing path and is projected to grow at a 18.37% CAGR through 2031, as regulated sectors seek to keep sensitive employee data behind the firewall while still using cloud-side analytics and AI features. This is especially visible in BFSI, healthcare, and government, where control over people's data has become central to procurement. The model appeals to organizations that are still moving toward broader cloud adoption but are not ready to transfer all workforce data to external environments. On-premises deployment remains relevant in sovereign or defense-sensitive settings, yet its role is increasingly focused on a narrower set of highly controlled use cases. As compliance demands rise, the ONA platform market is likely to keep shifting toward hybrid designs that balance analytical flexibility with stricter data handling.
Geography Analysis
North America accounted for 41.30% of the organizational network analysis (ONA) platform market share in 2025 because the region combines large hybrid-work employers, mature people analytics programs, and a strong base of pure-play and suite vendors. The United States remained the main source of regional demand, with adoption supported by enterprises that already use digital collaboration systems at scale. Microsoft Viva Insights has helped widen exposure by making metrics such as diverse ties, strong ties, and influence rank available inside existing Microsoft 365 environments. That matters because it lowers the barrier to initial ONA use and gives buyers a path from embedded metrics to fuller platform purchases. Canada and Mexico are growing within the regional base, though both remain earlier in adoption than the United States.
Asia-Pacific is the fastest-growing region in the ONA platform market, advancing at a 17.89% CAGR through 2031. In March 2025, research showed that close to 75% of APAC organizations were still at Levels 1-2 of people analytics maturity, compared with the Americas, where organizations were concentrated at Level 4, suggesting a large base of buyers that have yet to make a major ONA investment. Another study found in 2025 that 73% of APAC HR leaders had adopted or changed their HR technology platform in the prior 18 months, while 46% expected budget increases, which supports a favorable environment for new ONA vendor entry. India, Japan, and South Korea stand out because technology services expansion, HR platform renewal, and growing analytics maturity are creating a stronger base for ONA deployment.
Europe held the second-largest regional position in 2025, with Germany, the United Kingdom, France, and the Benelux countries forming the core demand base for the organizational network analysis platform market. The region's main difference is regulatory intensity, since GDPR enforcement and the EU AI Act make privacy design a more central buying factor than in many other markets. This raises compliance costs and often lengthens deployment cycles, favoring vendors with strong consent management, localization controls, and a privacy-by-design product architecture. South America, the Middle East, and Africa remain earlier-stage markets, where demand is concentrated in multinational subsidiaries and the largest local enterprises pursuing workforce modernization.
- Humanyze
- Innovisor
- Polinode Pty Ltd.
- Worklytics Co.
- TrustSphere Pte. Ltd.
- SWOOP Analytics Pty Ltd.
- Network Perspective Sp. z o.o.
- Maven Seven Solutions Plc.
- Cognitive Talent Solutions Inc.
- Glickon S.p.A.
- People Yield srl
- Edgius Inc.
- Panalyt Inc.
- Time is Ltd. s.r.o.
- Teamspective Oy
- Confirm HR, Inc.
- Peoplelogic, Inc.
- Mentis Talent Technologies Pte. Ltd.
- Kumu Inc.
- Skyminyr Inc.
Additional Benefits:
- The market estimate (ME) sheet in Excel format
- 3 months of analyst support
TABLE OF CONTENTS
1 INTRODUCTION
- 1.1 Study Assumptions and Market Definition
- 1.2 Scope of the Study
2 RESEARCH METHODOLOGY
3 EXECUTIVE SUMMARY
4 MARKET LANDSCAPE
- 4.1 Market Overview
- 4.2 Market Drivers
- 4.2.1 Hybrid Work Complexity Expands Demand for Collaboration Visibility
- 4.2.2 Burnout Prevention Elevates Collaboration Overload Analytics
- 4.2.3 M&A and Transformation Programs Need Influence Mapping
- 4.2.4 Generative AI Enables Prescriptive Network Insights
- 4.2.5 Enterprise AI Rollout Governance Requires Influence Diffusion Mapping
- 4.2.6 Developer Experience Optimization Creates New ONA Buying Center
- 4.3 Market Restraints
- 4.3.1 Data Privacy and Ethical Surveillance Concerns
- 4.3.2 Integration Complexity Across Fragmented Collaboration Data Sources
- 4.3.3 Employee Trust Erosion From Perceived Monitoring
- 4.3.4 Weak Managerial Fluency In Network Metrics Slows Actionability
- 4.4 Industry Value Chain Analysis
- 4.5 Regulatory Landscape
- 4.6 Technological Outlook
- 4.7 Impact of Macroeconomic Factors on the Market
- 4.8 Porter's Five Forces Analysis
- 4.8.1 Bargaining Power of Buyers
- 4.8.2 Bargaining Power of Suppliers
- 4.8.3 Threat of New Entrants
- 4.8.4 Threat of Substitutes
- 4.8.5 Intensity of Competitive Rivalry
5 MARKET SIZE AND GROWTH FORECASTS (VALUE)
- 5.1 By Component
- 5.1.1 Platform
- 5.1.2 Services
- 5.2 By Deployment Model
- 5.2.1 Cloud-based
- 5.2.2 On-premises
- 5.2.3 Hybrid
- 5.3 By End User Enterprise Size
- 5.3.1 Large Enterprises
- 5.3.2 Small and Medium-sized Enterprises
- 5.4 By Application
- 5.4.1 Organizational Design and Workforce Planning
- 5.4.2 Collaboration and Communication Analytics
- 5.4.3 Change Management and Transformation
- 5.4.4 Leadership and Influence Mapping
- 5.4.5 Innovation Network Analysis
- 5.4.6 Others
- 5.5 By End User Industry
- 5.5.1 BFSI
- 5.5.2 Healthcare and Life Sciences
- 5.5.3 Information Technology and Telecom
- 5.5.4 Retail and E-commerce
- 5.5.5 Industrial Manufacturing
- 5.5.6 Government and Public Sector
- 5.6 By Geography
- 5.6.1 North America
- 5.6.1.1 United States
- 5.6.1.2 Canada
- 5.6.1.3 Mexico
- 5.6.2 South America
- 5.6.2.1 Brazil
- 5.6.2.2 Argentina
- 5.6.2.3 Rest of South America
- 5.6.3 Europe
- 5.6.3.1 Germany
- 5.6.3.2 United Kingdom
- 5.6.3.3 France
- 5.6.3.4 Italy
- 5.6.3.5 Spain
- 5.6.3.6 Russia
- 5.6.3.7 Netherlands
- 5.6.3.8 Rest of Europe
- 5.6.4 Asia-Pacific
- 5.6.4.1 China
- 5.6.4.2 Japan
- 5.6.4.3 India
- 5.6.4.4 South Korea
- 5.6.4.5 Australia and New Zealand
- 5.6.4.6 Rest of Asia-Pacific
- 5.6.5 Middle East
- 5.6.5.1 Saudi Arabia
- 5.6.5.2 United Arab Emirates
- 5.6.5.3 Rest of Middle East
- 5.6.6 Africa
- 5.6.6.1 South Africa
- 5.6.6.2 Nigeria
- 5.6.6.3 Rest of Africa
- 5.6.1 North America
6 COMPETITIVE LANDSCAPE
- 6.1 Market Concentration
- 6.2 Strategic Moves
- 6.3 Market Share Analysis
- 6.4 Company Profiles (includes Global Level Overview, Market Level Overview, Core Segments, Financials as available, Strategic Information, Market Rank/Share, Products and Services, Recent Developments).
- 6.4.1 Humanyze
- 6.4.2 Innovisor
- 6.4.3 Polinode Pty Ltd.
- 6.4.4 Worklytics Co.
- 6.4.5 TrustSphere Pte. Ltd.
- 6.4.6 SWOOP Analytics Pty Ltd.
- 6.4.7 Network Perspective Sp. z o.o.
- 6.4.8 Maven Seven Solutions Plc.
- 6.4.9 Cognitive Talent Solutions Inc.
- 6.4.10 Glickon S.p.A.
- 6.4.11 People Yield srl
- 6.4.12 Edgius Inc.
- 6.4.13 Panalyt Inc.
- 6.4.14 Time is Ltd. s.r.o.
- 6.4.15 Teamspective Oy
- 6.4.16 Confirm HR, Inc.
- 6.4.17 Peoplelogic, Inc.
- 6.4.18 Mentis Talent Technologies Pte. Ltd.
- 6.4.19 Kumu Inc.
- 6.4.20 Skyminyr Inc.
7 MARKET OPPORTUNITIES AND FUTURE OUTLOOK
- 7.1 White-space and unmet-need assessment