
|
시장보고서
상품코드
2066402
생물촉진제 시장 : 시장 점유율 분석, 업계 동향 및 통계, 성장 예측(2026-2031년)Biostimulants - Market Share Analysis, Industry Trends & Statistics, Growth Forecasts (2026 - 2031) |
||||||
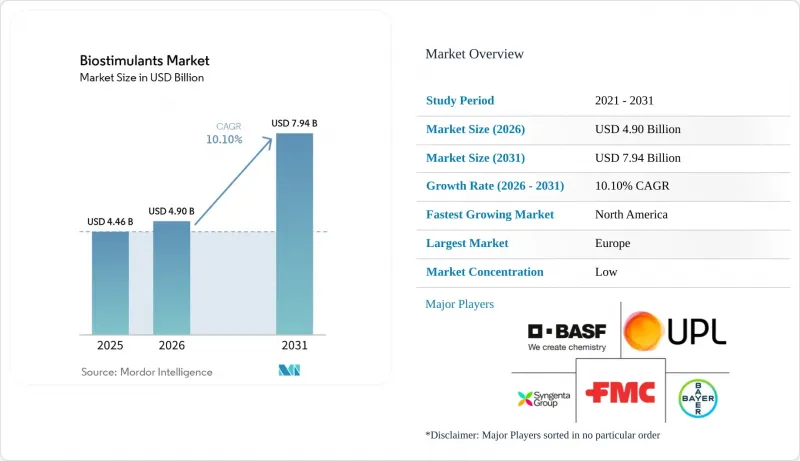
Mordor Intelligence에 의하면, 생물촉진제 시장 규모는 2025년 44억 6,000만 달러로 평가되었고, 2026년에는 49억 달러로 추정되고, 2031년까지 79억 4,000만 달러에 이를 것으로 예측되며, 2026-2031년 CAGR 10.1%를 기록할 전망입니다.
본 보고서는 형태별(아미노산, 풀빅산, 후민산, 단백질 가수분해물, 해조 추출물 등), 작물 유형별(경제작물, 원예작물, 밭작물) 및 지역별(북미, 남미, 유럽, 아시아·태평양, 중동 및 아프리카)로 분류되어 있습니다. 시장 전망은 금액(달러) 및 수량(미터톤) 단위로 제시되어 있습니다.
세계의 생물촉진제 시장 동향 및 인사이트
지속 가능한 농업 자재의 도입
지속 가능한 농자재의 도입은 현재의 농업 경제와 농업학적 요건 모두에 부합하기 때문에 생물촉진제 시장 수요를 견인하는 주요 요인으로 계속 작용하고 있습니다. 코로나19 팬데믹 이후 비료 가격의 변동은 생산자들이 투입 자재에 관한 결정을 재검토하는 계기가 되었습니다. 현재 많은 농장에서는 기존의 비료 프로그램을 대체하기 위해서가 아니라, 영양 효율을 높이기 위해 생장촉진제를 사용하고 있습니다. 이러한 변화는 생물촉진제를 주요 작물 예산에 포함시키는 것이며, 많은 경우 초기 시험 주기를 거친 후 지속적인 사용으로 이어진다는 점에서 중요합니다. 스페인 코르도바 대학교 연구진이 2025년에 실시한 조사에 따르면, 반건조 조건에서 아미노산계 생장촉진제와 서방형 요소를 병용할 경우, 처리하지 않은 대조군에 비해 곡물의 단백질 함량이 최대 4.2% 증가하는 것으로 입증되었습니다.
유기농 재배 면적과 잔류물에 민감한 밸류체인
유기농 재배 면적과 잔류물에 민감한 밸류체인은 생물촉진제 시장의 고객 기반을 기존의 작물 시스템을 넘어 확장시키고 있습니다. 소매업체의 조달 요건이 추가적인 수요를 견인하고 있으며, 잔류물 제로 조달 기준에 따라 공식적인 규제 의무가 없는 경우에도 생산자들이 생물학적 솔루션을 채택하도록 유도되는 경우가 점점 더 많아지고 있습니다. 미국 농무부 경제조업체국에 따르면, 2024년 유기농 식품 매출액은 654억 달러에 달했고, 하류 시장 수요가 강세를 보이고 있음을 보여줍니다. 이는 생물촉진제 시장에 있어 중요한 의미를 지닙니다. 왜냐하면, 그 채용이 더 이상 소규모 유기 부문에만 국한되지 않기 때문입니다. 밭농사 농가와 고부가가치 원예 생산자들도 식품 시장과 수출 시장에서 오는 이와 같은 구매자 측의 압력에 점점 더 대응하고 있습니다.
전 세계적으로 제각각인 정의와 표시 규정
법적 정의의 불일치는 유럽 이외의 많은 지역에서 여전히 바이오자극제 시장을 제약하고 있습니다. 아프리카, 동남아시아, 남아시아의 일부 국가에서는 이러한 제품들이 농약과 동일한 법규에 따라 규제되고 있습니다. 그 결과, 데이터 요구 사항이 확대되고 등록까지 걸리는 기간이 길어지면서, 많은 공급업체들이 이에 대응하는 데 어려움을 겪고 있습니다. 유럽 생물자극제 산업협의회(EBIC)에 따르면, 포지티브 리스트에 따른 제한이나 화학물질의 안전성 요건 등을 포함하는 현재의 규정 준수 요건은 특히 새로운 미생물 기반 솔루션의 상용화를 목표로 하는 중소기업에게 큰 과제가 되고 있습니다. 이 문제는 효능 표시에 따른 집행 위험과 밀접한 관련이 있습니다. 공급업체는 제품 개발에 투자했음에도 불구하고, 관할 구역마다 다른 효능 표시 기준이나 제품 분류에 직면할 가능성이 있기 때문입니다. 보다 광범위한 국제적 체계가 확립될 때까지는 생물촉진제 시장이 고르지 못한 성장세를 이어갈 것으로 예상되며, 규제 차이로 인해 경쟁에 미치는 영향이 농학적 성능에 거의 필적할 정도로 커질 것입니다.
부문별 분석
2025년에는 아미노산이 매출액 점유율의 30.7%를 차지했으며, 최대 점유율을 유지했습니다. 이러한 우위는 다양한 작물 범주에 걸친 비료 및 관개 시스템, 영양소 효율화 프로그램, 그리고 스트레스 관리 용도와의 폭넓은 호환성에서 비롯됩니다. 아미노산 제제는 기존의 비료 시비 계획이나 작물 보호 절차에 원활하게 통합될 수 있기 때문에 곡물, 채소, 원예 작물에서 널리 사용되고 있습니다. 이 부문은 상업적 농업 시스템에서 나타나는 꾸준한 재구매 행태의 혜택을 받고 있습니다. 이러한 시스템에서는 생산자가 작업의 편의성과 측정 가능한 작물 품질 향상을 우선시하고 있습니다. 또한, 안정적인 저장 기간, 취급의 용이성, 그리고 생물학적 투입 프로그램에의 적용이 증가하고 있다는 점이 전 세계 대규모 농업 생산 지역에서 이 기술의 도입을 지속적으로 촉진하고 있습니다.
후민산은 2026-2031년 연평균 성장률(CAGR) 12.6%라는 가장 높은 성장률을 보일 것으로 전망됩니다. 이러한 성장은 상업 농업 분야에서 토양 황폐화, 양분 이용 효율, 그리고 가뭄과 관련된 작물의 스트레스에 대한 우려가 커짐에 따라 주도되고 있습니다. 후민산 제제는 다양한 재배 조건에서 영양소의 이용 효율을 높이고 뿌리 주변 환경의 활성을 촉진하는 능력이 있어, 옥수수, 대두, 곡물 재배에 그 사용이 확대되고 있습니다. 후르보산 제품 역시 식물과의 신속한 상호작용과 킬레이트 형성 특성으로 인해 주목을 받고 있는 반면, 해조 추출물은 스트레스 관리 분야에서 여전히 중요한 위치를 차지하고 있습니다. 제품 혁신은 주류 농업 생산 시스템의 비료 및 종자 처리 프로그램에 통합된 다기능 생물 유래 혼합물에 점점 더 초점을 맞추었습니다.
지역별 분석
2025년에는 유럽이 시장 점유율의 38.3%를 차지해 가장 높은 점유율을 기록했습니다. 이 지역이 주도적인 위치를 유지하고 있는 것은 식물 생장 촉진제에 관한 공식적인 법적 체계를 확립한 유럽연합(EU)의 규제로 인해 제품의 표준화와 국경을 초월한 상업화가 촉진되었기 때문입니다. 또한, 유럽에서는 유기농업이 널리 보급되고 있으며, 지속 가능한 농업 자재에 대한 규제 측면의 지원도 강화되고 있는 점이 호재로 작용하고 있습니다. 스페인, 프랑스, 독일, 이탈리아 등에서는 곡물, 원예, 올리브, 와인 산업 분야에서 잔류물 관리와 수출 품질 기준이 우선시되고 있어, 계속해서 수요를 견인하고 있습니다. 고도의 농업 자문 네트워크와 생물 유래 자재에 대한 인식 제고가 지역 전체의 광역 농업 및 고부가가치 농업 생산 시스템 양쪽 모두에서 상업적 도입을 더욱 촉진하고 있습니다.
북미 시장 규모는 2026-2031년 연평균 성장률(CAGR) 12.7%라는 가장 높은 성장률을 기록하며 확대될 것으로 전망됩니다. 이러한 성장은 정밀 농업의 확대, 기후 스마트 농업 프로그램, 그리고 대규모 농업 경영에서 영양 효율이 높은 제품에 대한 관심 증가에 힘입어 이루어지고 있습니다. 미국과 캐나다에서는 옥수수, 대두, 채소 및 특산 작물 재배 체계에 생물 유래 자재의 도입이 지속적으로 확대되고 있습니다. 탄탄한 유통업체 네트워크와 선진적인 농장 관리 기법 또한 비료 최적화 및 스트레스 관리와 관련된 바이오자극제 제제의 도입을 가속화하고 있습니다. 상업 농가들은 실험적인 사용이 아닌, 측정 가능한 농업적 성과를 통해 이러한 제품을 평가하는 경향이 강해지고 있으며, 지역 전체 농업 부문의 밭작물 및 원예 생산 시스템 전반에 걸쳐 지속적인 수요가 증가하고 있습니다.
아시아태평양에서는 지속 가능한 농업 이니셔티브의 확대와 생물 유래 자재의 채택 증가를 통해 그 위상을 강화하고 있습니다. 인도 정부 보도정보국에 따르면, 제품의 품질, 효능 및 상용화 기준을 규제하기 위해 2025년 9월까지 146종의 생장촉진제 제품이 ‘비료 관리령(FCO)’의 스케줄 VI에 포함되었습니다. 인도와 중국은 기존 농업 투입재에 대한 의존도를 낮추기 위해 생물 유래 및 지속 가능한 영양 관리 프로그램을 적극적으로 지원하고 있습니다. 남미는 대두, 커피, 과일 등의 수출 지향형 생산 체제를 통해 여전히 중요한 위치를 차지하고 있습니다. 한편, 중동 및 아프리카에서는 가뭄 스트레스, 염해, 토양 품질 관리의 우선 과제 등 여러 문제를 배경으로 생물 유래 투입재의 도입이 서서히 진행되고 있습니다.
기타 혜택 :
- 엑셀 형식 시장 예측(ME) 시트
- 3개월간의 애널리스트 지원
자주 묻는 질문
목차
제1장 서론
제2장 개 보고서의 내용
제3장 주요 요약 및 주요 조사 결과
제4장 주요 업계 동향
제5장 시장 규모 및 성장 예측
제6장 경쟁 구도
제7장 농업용 바이오 제품 기업 CEO를 향한 중요 전략적 과제
AJY 26.06.24According to Mordor Intelligence, the biostimulants market size is projected to grow from USD 4.46 billion in 2025 to USD 4.90 billion in 2026 and reach USD 7.94 billion by 2031, registering a CAGR of 10.1% during 2026-2031.

This report is Segmented by Form (Amino Acids, Fulvic Acid, Humic Acid, Protein Hydrolysates, Seaweed Extracts, and More), by Crop Type (Cash Crops, Horticultural Crops, and Row Crops), and by Geography (North America, South America, Europe, Asia-Pacific, Middle East, and Africa). The Market Forecasts are Provided in Terms of Value (USD) and Volume (Metric Tons).
Global Biostimulants Market Trends and Insights
Sustainable Crop-Input Adoption
The adoption of sustainable crop inputs remains a key driver of demand in the biostimulants market, as it aligns with both current farm economics and agronomic requirements. Fertilizer price volatility following the COVID-19 pandemic has influenced growers to reassess input decisions. Many farms are now using biostimulants to enhance nutrient efficiency rather than as replacements for standard fertilizer programs. This shift is significant as it integrates biostimulants into core crop budgets, often resulting in repeat usage after initial trial cycles. A 2025 study by researchers from the University of Cordoba, Spain, demonstrated that amino acid biostimulants combined with slow-release urea increased grain protein content by up to 4.2% compared to untreated controls under semi-arid conditions.
Organic Acreage and Residue-Sensitive Value Chains
Organic acreage and residue-sensitive value chains are expanding the customer base of the biostimulants market beyond traditional crop systems. Retailer sourcing requirements are driving additional demand, as residue-free procurement standards often encourage growers to adopt biological solutions, even in the absence of formal regulatory mandates. According to the Economic Research Service of the United States Department of Agriculture, organic food sales reached USD 65.4 billion in 2024, indicating strong downstream demand. This is significant for the biostimulants market, as its adoption is no longer confined to a small organic segment. Row-crop growers and high-value horticultural producers are increasingly responding to similar buyer pressures from food and export markets.
Fragmented Global Definitions and Claim Rules
Fragmented legal definitions continue to constrain the biostimulants market in many regions outside Europe. In several countries across Africa, Southeast Asia, and South Asia, these products are regulated under pesticide-style statutes. This results in extended data requirements and prolonged registration timelines, which many suppliers find challenging to manage. According to the European Biostimulants Industry Council (EBIC), current compliance rules, including positive-list restrictions and chemical safety requirements, pose significant challenges, particularly for smaller companies aiming to commercialize new microbial solutions. This issue is closely tied to claim-enforcement risks, as suppliers may invest in product development only to encounter varying claim standards or differing product classifications across jurisdictions. Until a broader international framework is established, the biostimulants market is projected to grow unevenly, with regulatory differences influencing competition nearly as much as agronomic performance.
Other drivers and restraints analyzed in the detailed report include:
- Regulatory Recognition and Product-Legitimacy Gains
- Abiotic-Stress and Yield-Stability Proof Points
- Inconsistent Field Performance Across Conditions
For complete list of drivers and restraints, kindly check the Table Of Contents.
Segment Analysis
Amino acids held the largest 30.7% of revenue share in 2025. This dominance is attributed to their broad compatibility with fertigation systems, nutrient-efficiency programs, and stress-management applications across various crop categories. Amino acid formulations are widely used in cereals, vegetables, and horticultural crops due to their seamless integration into existing fertilizer schedules and crop-protection routines. The segment benefits from strong repeat-purchase behavior in commercial farming systems, where growers prioritize operational simplicity and measurable crop-quality improvements. Additionally, their stable shelf life, ease of handling, and increasing incorporation into biological input programs continue to drive adoption in large-scale agricultural production regions worldwide.
Humic acid is set to grow at the fastest 12.6% CAGR from 2026 to 2031. This growth is driven by rising concerns over soil degradation, nutrient-use efficiency, and drought-related crop stress in commercial agriculture. Humic acid formulations are increasingly adopted in corn, soybean, and cereal systems due to their ability to enhance nutrient availability and support root-zone activity under varying field conditions. Fulvic acid products are also gaining traction for their rapid plant interaction and chelation properties, while seaweed extracts remain significant for stress-management applications. Product innovation is increasingly focused on multi-active biological blends integrated into fertilizer and seed-treatment programs within mainstream agricultural production systems.
Geography Analysis
Europe accounted for the largest 38.3% of the market share in 2025. The region maintains leadership because the European Union regulation, which established a formal legal framework for plant biostimulants, has improved product standardization and cross-border commercialization. Europe also benefits from strong organic farming adoption and greater regulatory support for sustainable agricultural inputs. Countries including Spain, France, Germany, and Italy continue driving demand because their cereal, horticultural, olive, and wine industries prioritize residue management and export quality standards. Advanced agronomic advisory networks and stronger biological input awareness further support commercial adoption across both broadacre and high-value agricultural production systems throughout the region.
The North America market size is projected to grow at the fastest 12.7% CAGR from 2026 to 2031. Growth is supported by precision agriculture expansion, climate-smart farming programs, and increasing interest in nutrient-efficiency products across large-scale farming operations. The United States and Canada continue to increase biological input integration into corn, soybean, vegetable, and specialty-crop systems. Strong dealer infrastructure and advanced farm-management practices are also accelerating the adoption of biostimulant formulations linked to fertilizer optimization and stress management. Commercial growers increasingly evaluate these products through measurable agronomic outcomes rather than experimental use, strengthening recurring demand across row-crop and horticultural production systems throughout the regional agricultural sector.
The Asia-Pacific region is strengthening its position through the expansion of sustainable agriculture initiatives and increased adoption of biological inputs. According to the Press Information Bureau, Government of India, 146 biostimulant products had been included under Schedule VI of the Fertilizer Control Order (FCO) by September 2025 to regulate product quality, efficacy, and commercialization standards. India and China are actively supporting biological and sustainable nutrient-management programs to reduce reliance on conventional agricultural inputs. South America remains significant due to its export-oriented production systems for soybeans, coffee, and fruits. Meanwhile, the Middle East and Africa are witnessing the gradual adoption of biological inputs, driven by challenges such as drought stress, salinity exposure, and soil-quality management priorities.
- Syngenta Crop Protection AG (Syngenta Group)
- UPL Limited
- BASF SE
- Bayer AG
- FMC Corporation
- Rovensa Next S.L.
- Coromandel International Limited
- Koppert B.V.
- Haifa Negev Technologies Ltd. (Haifa Group)
- BioAtlantis Ltd.
- Acadian Seaplants Limited
- Seipasa, S.A.
- Hello Nature International S.r.l.
- Novonesis A/S
- PI Industries Limited
Additional Benefits:
- The market estimate (ME) sheet in Excel format
- 3 months of analyst support
TABLE OF CONTENTS
1 INTRODUCTION
- 1.1 Study Assumptions and Market Definition
- 1.2 Scope of the Study
- 1.3 Research Methodology
2 REPORT OFFERS
3 EXECUTIVE SUMMARY AND KEY FINDINGS
4 KEY INDUSTRY TRENDS
- 4.1 Area Under Organic Cultivation
- 4.2 Per Capita Spending on Organic Products
- 4.3 Regulatory Framework
- 4.3.1 Argentina
- 4.3.2 Australia
- 4.3.3 Brazil
- 4.3.4 Canada
- 4.3.5 China
- 4.3.6 Egypt
- 4.3.7 France
- 4.3.8 Germany
- 4.3.9 India
- 4.3.10 Indonesia
- 4.3.11 Italy
- 4.3.12 Japan
- 4.3.13 Mexico
- 4.3.14 Netherlands
- 4.3.15 Nigeria
- 4.3.16 Philippines
- 4.3.17 Russia
- 4.3.18 South Africa
- 4.3.19 Spain
- 4.3.20 Thailand
- 4.3.21 Turkey
- 4.3.22 United Kingdom
- 4.3.23 United States
- 4.3.24 Vietnam
- 4.4 Value Chain and Distribution Channel Analysis
- 4.5 Market Drivers
- 4.5.1 Sustainable crop-input adoption
- 4.5.2 Organic acreage and residue-sensitive value chains
- 4.5.3 Regulatory recognition and product-legitimacy gains
- 4.5.4 Abiotic-stress and yield-stability proof points
- 4.5.5 Carbon and nature-credit monetization pathways
- 4.5.6 Seed and fertilizer-program integration
- 4.6 Market Restraints
- 4.6.1 Fragmented global definitions and claim rules
- 4.6.2 Inconsistent field performance across conditions
- 4.6.3 Tighter claim-enforcement and reclassification risk
- 4.6.4 Seaweed feedstock concentration and harvest volatility
- 4.7 Technological Outlook
- 4.8 Porter's Five Forces Analysis
- 4.8.1 Bargaining Power of Buyers
- 4.8.2 Bargaining Power of Suppliers
- 4.8.3 Threat of New Entrants
- 4.8.4 Threat of Substitutes
- 4.8.5 Intensity of Competitive Rivalry
5 MARKET SIZE AND GROWTH FORECASTS (VALUE AND VOLUME)
- 5.1 By Form
- 5.1.1 Amino Acids
- 5.1.2 Fulvic Acid
- 5.1.3 Humic Acid
- 5.1.4 Protein Hydrolysates
- 5.1.5 Seaweed Extracts
- 5.1.6 Other Biostimulants
- 5.2 By Crop Type
- 5.2.1 Row Crops
- 5.2.2 Horticultural Crops
- 5.2.3 Cash Crops
- 5.3 By Geography
- 5.3.1 North America
- 5.3.1.1 United States
- 5.3.1.2 Canada
- 5.3.1.3 Mexico
- 5.3.1.4 Rest of North America
- 5.3.2 South America
- 5.3.2.1 Brazil
- 5.3.2.2 Argentina
- 5.3.2.3 Rest of South America
- 5.3.3 Europe
- 5.3.3.1 Germany
- 5.3.3.2 France
- 5.3.3.3 Italy
- 5.3.3.4 Spain
- 5.3.3.5 United Kingdom
- 5.3.3.6 Russia
- 5.3.3.7 Netherlands
- 5.3.3.8 Rest of Europe
- 5.3.4 Asia-Pacific
- 5.3.4.1 China
- 5.3.4.2 India
- 5.3.4.3 Japan
- 5.3.4.4 Australia
- 5.3.4.5 Indonesia
- 5.3.4.6 Thailand
- 5.3.4.7 Vietnam
- 5.3.4.8 Philippines
- 5.3.4.9 Rest of Asia-Pacific
- 5.3.5 Middle East
- 5.3.5.1 Saudi Arabia
- 5.3.5.2 Iran
- 5.3.5.3 Turkey
- 5.3.5.4 Rest of Middle East
- 5.3.6 Africa
- 5.3.6.1 South Africa
- 5.3.6.2 Egypt
- 5.3.6.3 Nigeria
- 5.3.6.4 Rest of Africa
- 5.3.1 North America
6 COMPETITIVE LANDSCAPE
- 6.1 Key Strategic Moves
- 6.2 Strategic Moves
- 6.3 Company Landscape
- 6.4 Company Profiles (Includes Global Level Overview, Market Level Overview, Core Segments, Financials as Available, Strategic Information, Market Rank/Share for Key Companies, Products and Services, and Recent Developments)
- 6.4.1 Syngenta Crop Protection AG (Syngenta Group)
- 6.4.2 UPL Limited
- 6.4.3 BASF SE
- 6.4.4 Bayer AG
- 6.4.5 FMC Corporation
- 6.4.6 Rovensa Next S.L.
- 6.4.7 Coromandel International Limited
- 6.4.8 Koppert B.V.
- 6.4.9 Haifa Negev Technologies Ltd. (Haifa Group)
- 6.4.10 BioAtlantis Ltd.
- 6.4.11 Acadian Seaplants Limited
- 6.4.12 Seipasa, S.A.
- 6.4.13 Hello Nature International S.r.l.
- 6.4.14 Novonesis A/S
- 6.4.15 PI Industries Limited
