
|
시장보고서
상품코드
2066442
폐기물 에너지화(WTE) 시장 : 시장 점유율 분석, 업계 동향 및 통계, 성장 예측(2026-2031년)Waste To Energy (WTE) - Market Share Analysis, Industry Trends & Statistics, Growth Forecasts (2026 - 2031) |
||||||
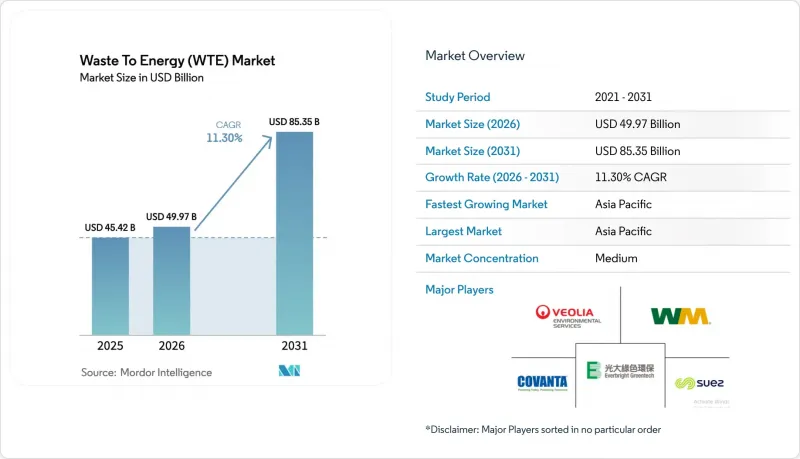
Mordor Intelligence에 의하면, 폐기물 에너지화 시장은 2025년 454억 2,000만 달러로 평가되었고, 2026년에는 499억 7,000만 달러로 추정되고, 2026-2031년 CAGR 11.30%로 성장을 지속할 전망이며, 2031년까지 853억 5,000만 달러에 이를 것으로 예측됩니다.
본 보고서는 기술별(물리적, 열적, 생물학적), 폐기물 유형별(도시 고형 폐기물, 산업 폐기물 등), 에너지 출력별(전력, 열 등), 최종 사용자별(유틸리티 및 독립발전사업자(IPP), 산업용 자가발전 플랜트, 지역 열공급 사업자, 운송용 연료 판매업자), 그리고 지역별(북미, 유럽, 아시아태평양, 남미, 중동 및 아프리카)로 분류되어 있습니다.
세계의 폐기물 에너지화(WTE) 시장 동향 및 인사이트
중국 광둥만 지역의 폐기물 에너지화(EfW) 민관협력(PPP) 프로젝트의 급속한 전개
각 부처 당국은 2024-2027년 450억 위안 규모의 예산을 편성하고, 민간 자본의 위험을 완화하기 위한 25년간의 수익 보장을 바탕으로 하루 12만 톤 규모의 신규 처리 능력을 확충할 예정입니다. 재활용을 통한 수익은 현금 흐름을 8%-12% 끌어올렸으며, 한편 더 엄격해진 발생원별 분리 규정에 따라 저발열량이 2,400 kcal/kg까지 상승하여 톤당 순발전량이 22% 증가했습니다. 이 모델은 양쯔강 삼각주와 청두·충칭 경제권으로도 확대되고 있으며, 2025년에는 14건의 추가 양도권 프로젝트가 금융 계약을 체결했습니다. 처리량의 안정성과 원료의 품질 덕분에 부채 상환 배수의 손익분기 기간이 7년에서 5년으로 단축되었습니다. 국제 금융기관들은 이 표준화된 양허 모델을 대출 대상으로서 적합하다고 평가하고 있으며, 이를 통해 다중 통화 자금 조달이 가능해짐에 따라 폐기물 에너지화 시장의 거래 건수가 증가하고 있습니다.
EU의 그린 택소노미에 따른 인센티브가 노후 소각 시설의 개보수를 가속화하고 있습니다.
위임 규정 2024/1214에 따라 고효율화 개보수 사업이 지속 가능한 투자로 재분류되었으며, 2025년에는 47개 플랜트에 28억 유로의 그린본드 자금이 투입되었습니다. 가중평균자본비용은 120베이시스포인트 하락했으며, 배기가스 정화 및 열회수 설비의 업그레이드에 따른 투자 회수 기간은 7년 미만이 되었습니다. MVV Energie사가 발행한 3억 유로 규모의 채권은 열효율을 68%로 높이는 응축식 이코노마이저 건설 자금으로 사용되어, 4만 5,000가구에 지역 난방을 공급하는 데 기여했습니다. 시멘트 가마에서 폐기물 유래 연료를 혼소하는 것에 대한 인센티브 덕분에 석탄 수요가 연간 42만 톤 감소했으며, 폐기물을 에너지로 전환하는 시장에서 가치 창출의 길이 넓어지고 있습니다.
다이옥신 배출 상한선 강화로 인해 독일에서 화격자식 용광로의 개조 허가가 연기되고 있습니다.
2024년 7월에 시행된 독일의 조례에 따라 다이옥신 배출 기준치가 0.05 ng/m³로 절반으로 낮아졌으며, 연간 처리 능력 10만 톤 규모의 시설당 800만-1,500만 유로의 개보수 비용이 의무화되었습니다. 2025년에는 23개 시설에서 허가 갱신이 연기되면서 연간 120만 톤의 처리 능력이 유휴 상태가 되었고, 톤당 35파운드의 가격으로 네덜란드로 수출할 수밖에 없었습니다. 중규모 지방 자치단체 사업자들은 개보수를 미룬 반면, 베올리아(Veolia) 등 대형 종합 사업자들은 계약을 수주하여 높은 폐기물 처리 수수료를 확보했습니다. 오스트리아는 2027년까지 이보다 더 엄격한 상한치를 도입하겠다는 방침을 밝혔으며, 계획되어 있던 설비 투자 중 1억 1,000만 유로를 앞당겨 투입함에 따라 폐기물 에너지화 시장의 단기적인 성장이 억제되었습니다.
부문별 분석
2025년, 폐기물 에너지화 시장의 65.1%를 소각 처리가 차지했으며, 이는 1톤·1일당 처리 능력 기준 45만-65만 달러라는 낮은 자본 집약도를 반영하고 있습니다. 대조적으로, 플라즈마 아크 가스화는 1톤·1일당 설비 투자액이 85만 달러를 초과하는 경우, 지자체가 부피를 98% 감축하고 골재로 적합한 유리화 슬래그를 중시하고 있기 때문에 그 규모가 확대되고 있습니다. 서울의 시범 플랜트에서는 1톤당 85,000원의 매립 회피에 따른 비용 절감 효과가 입증되어, 플라즈마 설비 개조 투자 회수 기간이 단축되었습니다. 미국의 3개 시설에서 슬래그용 플라즈마 토치를 개조함으로써 철 금속 회수율을 12% 향상시키고, 매립 비용을 톤당 18달러 절감할 수 있을 것으로 전망됩니다.
일본의 가스화 프로젝트에서는 도시 고형 폐기물을 합성 가스로 전환하고 있으며, 그 발전 효율은 화격자식 소각의 22%에 비해 최대 32%에 달할 전망입니다. 유기물이 풍부한 지역에서는 생물학적 처리가 활발히 이루어지고 있으며, 인도에서는 2025년에 압축천연가스(CNG) 차량용 일일 3,200톤 규모의 바이오메탄화 플랜트를 가동했습니다. 영국의 기계적 생물학적 처리(MBT) 시설은 2025년에 480만 톤을 처리하여, 폐기물 유래 연료 수출의 발열량을 14% 향상시켰습니다. 현재 기술 선정은 지역의 배출 상한선, 탄소 크레딧을 통한 수익성, 그리고 원료 구성에 따라 결정되고 있으며, 이로 인해 폐기물 에너지화(WTE) 시장의 기술 선택지가 전반적으로 확대되고 있습니다.
2025년, 폐기물 에너지화 업계의 투입량 중 70.2%를 도시 고형 폐기물이 차지했으나, 브라질에서 사탕수수 바가스를 이용한 바이오가스 생산 의무화 및 베트남에서 벼 껍질 펠릿화가 규모를 확대함에 따라, 농업 잔여물은 2031년까지 연평균 성장률(CAGR) 14.4%를 기록할 전망입니다. 산업 폐기물은 특히 플라스틱 및 금속의 폐쇄형 순환 회수를 목표로 하는 전자기기·자동차 공장에서 공급됨에 따라, 폐기물 에너지화 부문에서 안정적인 처리량을 확보하고 있습니다. 유럽에서는 개정된 도시 하수 처리 지침에 따라 폐기물 에너지화 업계에서 하수 슬러지의 소화 처리가 가속화되어, 2025년에는 112기의 소화조가 추가되었습니다.
네덜란드에서는 건설 및 철거 폐기물을 전처리하여 고발열 성분을 추출한 뒤, MBT(폐기물 소각 발전) 플랜트에 공급하고 있으며, 시멘트 가마에서는 110만 톤의 가연성 물질이 석탄을 대체했습니다. 중국에서는 2025년에 유해 폐기물 처리 능력이 68만 톤으로 확대되었으며, 의료 폐기물과 전자 폐기물을 통해 420 GWh의 전력을 생산했습니다. 원자재 물류는 여전히 걸림돌이 되고 있습니다. 흩어져 있는 농작물 잔여물을 수거하는 데 1톤당 25-40달러의 비용이 들기 때문에 상업적 활동 범위는 50km로 제한되어 있으며, 이로 인해 고수확 농업 지대 주변에서 집약화가 진행되어 폐기물 에너지화 시장의 공간적 집적에 영향을 미치고 있습니다.
지역별 분석
2025년에는 아시아태평양이 45.1%의 점유율을 차지했으며, 폐기물 에너지화 시장에서 가장 규모가 큰 지역 블록이 될 것입니다. 중국의 일일 80만 톤 처리 능력 목표와 인도의 매립 금지 기한이 실행 단계에 접어들면서, 해당 지역은 2031년까지 연평균 성장률(CAGR) 13.0%라는 견조한 성장세를 보이고 있습니다. 450억 위안 규모의 자금 조달과 25년간의 원료 공급 보장을 자랑하는 중국 광둥만 지역의 컨세션 모델은 부채 상환 위험을 낮추며, 아세안 국가들로도 확산될 가능성이 있습니다. 아세안(ASEAN)에서는 베트남과 태국이 2025년에 11건의 양도 계약을 체결했습니다. 인도의 2급 도시에서는 사업성 격차 자금(VGF)을 통해 하루 1만 4,500톤의 처리 능력이 추가되었으며, 지자체 소유 차량에서는 디젤 연료 대신 바이오메탄이 사용되게 되었습니다. 일본에서 8건의 합성가스(신가스) 가스화 프로젝트가 승인된 것과, 한국에서 톤당 28,000원인 탄소배출권 가격은 정책에 따른 호재라는 견해를 뒷받침하고 있습니다.
유럽의 폐기물 에너지화 시장의 성장세는 기존 설비의 개보수 경제성에 좌우되고 있습니다. EU의 그린 택소노미는 28억 유로 규모의 그린본드 발행을 촉진했으나, 독일의 다이옥신 배출 상한선 강화로 인해 연간 120만 톤의 처리 능력이 유휴 상태가 되어 단기적인 처리량이 억제되었습니다. 북유럽 국가들의 기업 대상 바이오가스 PPA는 2025년에 총 1.8 TWh에 달하며, 바이오메탄 투자를 촉진했습니다. 영국의 QP-RDF 발열량 하한 기준에 따라 7,800만 파운드 규모의 선별 설비 업그레이드가 의무화됨에 따라, 수출용 연료의 품질이 향상되는 한편, 국내 공급이 부족해지고 있습니다.
북미의 설비 확충은 미국 D3 셀룰로오스 기반 크레딧에 의존하고 있으며, 이로 인해 프로젝트의 내부수익률(IRR)이 12-15% 상승했고, 연간 총 생산량 72만 톤 규모의 6개 공장 건설이 촉진되었습니다. 캐나다에서는 톤당 80캐나다달러의 탄소 가격이 폐기물 에너지화의 경쟁력을 높여, 온타리오주와 브리티시컬럼비아주에서 프로젝트가 실현되었습니다. 라틴아메리카의 진전은 해당 지역에서 최초로 도입된 브라질의 바이오메탄 구매 의무 제도에 초점을 맞추고 있으며, 이 제도를 통해 최저 가격이 보장됨으로써 원료 계약이 개선되고 있습니다.
중동 및 아프리카는 신흥 시장이지만, 전략적으로 중요한 지역입니다. 연간 30만 톤의 처리 능력을 갖춘 샤르자 공장은 해당 지역 최대 규모이며, 한편 사우디아라비아에서는 하루 2,400톤의 처리 능력을 갖춘 컨세션 사업이 ‘비전 2030’의 폐기물 감축 목표를 뒷받침하고 있습니다. 남아프리카공화국에서는 REIPPP에 따라 1kWh당 1.80랜드의 요금이 책정됨에 따라 3개의 도시형 발전소가 가동을 시작했습니다. 또한, 이집트가 유럽부흥개발은행(EBRD)과 체결한 4억 2,000만 유로 규모의 양해각서는 다자간 기구들의 관심이 높아지고 있음을 보여줍니다.
기타 혜택 :
- 엑셀 형식 시장 예측(ME) 시트
- 3개월간의 애널리스트 지원
자주 묻는 질문
목차
제1장 서론
제2장 조사 방법
제3장 주요 요약
제4장 시장 구도
제5장 시장 규모 및 성장 예측
제6장 경쟁 구도
제7장 시장 기회 및 향후 전망
AJY 26.06.24According to Mordor Intelligence, the waste to energy market is expected to grow from USD 45.42 billion in 2025 to USD 49.97 billion in 2026 and is forecasted to reach USD 85.35 billion by 2031 at 11.30% CAGR over 2026-2031.

This report is Segmented by Technology (Physical, Thermal, and Biological), Waste Type (Municipal Solid Waste, Industrial Waste, and More), Energy Output (Electricity, Heat, and More), End-Users (Utilities and IPPs, Industrial Captive Plants, District Heating Operators, and Transport Fuel Distributors), and Geography (North America, Europe, Asia-Pacific, South America, and Middle East and Africa).
Global Waste To Energy (WTE) Market Trends and Insights
Rapid Roll-Out of EfW Public-Private Partnership Pipelines in China's Greater Bay Area
Provincial authorities earmarked CNY 45 billion between 2024 and 2027 to create 120,000 tonnes per day of new capacity backed by 25-year revenue guarantees that de-risk private capital. Bottom-ash recycling revenues add 8%-12% to cash flow, while stricter source-segregation rules have lifted lower-heating values to 2,400 kcal/kg, increasing net generation per tonne by 22%. The template is expanding to the Yangtze River Delta and Chengdu-Chongqing Economic Circle, where fourteen additional concessions reached financial close in 2025. Volume certainty and feedstock quality are shortening debt-service coverage break-evens from seven to five years. International lenders view the standardized concession model as bankable, unlocking multi-currency financing that amplifies the waste to energy market deal flow.
EU Green Taxonomy Incentives Accelerating Retrofit of Legacy Incineration Fleets
Delegated Regulation 2024/1214 re-tagged high-efficiency retrofits as sustainable investments, opening EUR 2.8 billion of green-bond proceeds for forty-seven plants in 2025. Weighted average costs of capital dropped 120 basis points, pushing payback on flue-gas cleaning and heat-recovery upgrades below seven years. MVV Energie's EUR 300 million bond financed a condensing economizer that elevates thermal efficiency to 68%, delivering district heat to 45,000 households. Co-firing incentives for refuse-derived fuel in cement kilns reduce coal demand by 420,000 tonnes annually, widening the waste to energy market valorization pathways.
Stricter Dioxin-Emission Caps Postponing Permits for Grate-Furnace Refurbishments in Germany
Germany's July 2024 ordinance halved the dioxin limit to 0.05 ng/m3, obliging EUR 8-15 million retrofits per 100,000 tpy plant. Twenty-three facilities had permit renewals deferred in 2025, idling 1.2 million tpy and forcing exports to the Netherlands at GBP 35 per tonne. Mid-sized municipal utilities deferred upgrades, while large integrated operators such as Veolia absorbed contracts, capturing premium tipping fees. Austria signaled adoption of the stricter cap by 2027, front-loading EUR 110 million of planned capital expenditure, and constraining near-term growth in the waste to energy market.
Other drivers and restraints analyzed in the detailed report include:
- National Bans on Unsegregated Landfill Triggering MSW Diversion in India's Tier-2 Cities
- Soaring Carbon-Credit Prices Improving WTE Project IRRs in South Korea
- Limited Tipping-Fee Escalation Clauses Hurting Project Bankability in Indonesia
For complete list of drivers and restraints, kindly check the Table Of Contents.
Segment Analysis
Incineration anchored 65.1% of the waste to energy market in 2025, reflecting the lower capital intensity of USD 450,000-650,000 per tonne-per-day capacity. In contrast, plasma-arc gasification, with capex north of USD 850,000 per tonne-per-day, is scaling because municipalities prize 98% volume reduction and vitrified slag suitable for aggregates. Seoul's pilot plant demonstrated KRW 85,000-per-tonne landfill-avoidance savings, quickening payback for plasma retrofits. Retrofitting bottom-ash plasma torches at three U.S. facilities will recover 12% more ferrous metals and cut landfill costs by USD 18/tonne.
Gasification projects in Japan convert municipal solid waste to syngas, hitting electrical efficiencies up to 32% against 22% for grate incineration. Biological routes thrive in organic-rich geographies; India commissioned 3,200 tpd biomethanation in 2025 for compressed natural gas fleets. Mechanical-biological treatment (MBT) plants in the United Kingdom processed 4.8 million tonnes in 2025, raising calorific value for refuse-derived fuel exports by 14%. Technology selection now hinges on local emission caps, carbon-credit upside, and feedstock composition, collectively widening the Waste to Energy (WTE) market's technology palette.
Municipal solid waste comprised 70.2% of input volumes in 2025 in the waste to energy industry, yet agricultural residues will post a 14.4% CAGR through 2031 as Brazil's sugar-bagasse biogas mandates and Vietnam's rice-husk pelletization gain scale. Industrial waste delivers steady volumes in the waste-to-energy sector, especially from electronics and automotive plants seeking closed-loop plastics and metal recovery. Sewage sludge digestion accelerated in the waste-to-energy industry in Europe after the revised Urban Wastewater Directive, adding 112 digesters in 2025.
Construction-and-demolition streams are pre-treated to extract high-calorific fractions for MBT plants in the Netherlands, where 1.1 million tonnes of combustible material replaced coal in cement kilns. Hazardous-waste capacity rose in China to 680,000 tonnes in 2025, generating 420 GWh of electricity from medical and electronic residues. Feedstock logistics remain a brake; dispersed crop-residue collection costs of USD 25-40/tonne confine commercial radii to 50 km, driving consolidation around high-yield farm belts and influencing the waste to energy market spatial clustering.
Geography Analysis
Asia-Pacific's 45.1% share in 2025 crowns it the largest regional block of the waste to energy market; the region is tracking a robust 13.0% CAGR to 2031 as China's 800,000 t-per-day capacity targets and India's landfill-ban deadlines reach execution. China's Greater Bay Area concession model, boasting CNY 45 billion funding and 25-year feedstock guarantees, lowered debt-service risk and may migrate to ASEAN, where Vietnam and Thailand closed eleven concessions in 2025. India's Tier-2 cities added 14,500 t-per-day via viability-gap funding, with biomethanation replacing diesel in municipal fleets. Japan's approval of eight syngas-gasification projects and South Korea's KRW 28,000-per-tonne carbon allowance underscore the policy-tailwind narrative.
Europe's waste to energy market momentum pivots on retrofit economics. The EU Green Taxonomy spurred EUR 2.8 billion in green-bond activity, yet Germany's tighter dioxin cap idled 1.2 million t-per-year, curbing near-term throughput. Nordic corporate biogas PPAs totaled 1.8 TWh in 2025, boosting biomethane investment. The United Kingdom's QP-RDF calorific-value floor imposed GBP 78 million in sorting upgrades, raising export fuel quality and tightening domestic supply.
North America's build-out depends on U.S. D3 cellulosic credits that lifted project IRRs 12-15%, catalyzing six plants totaling 720,000 tpy. Canada's CAD 80-per-tonne carbon price made waste-to-energy competitive, yielding projects in Ontario and British Columbia. Latin America's traction centers on Brazil's biomethane purchase mandate, the first of its kind in the region, guaranteeing floor prices that improve feedstock contracts.
The Middle East and Africa are emerging but strategic; the 300,000 t-per-year Sharjah plant is the region's largest, while Saudi Arabia's 2,400 t-per-day concessions underpin Vision 2030 waste-diversion targets. South Africa's tariff of ZAR 1.80/kWh under REIPPP unlocked three urban plants, and Egypt's EUR 420 million MoU with the EBRD signals growing multilateral appetite.
- Veolia Environnement SA
- Suez SA
- Waste Management Inc.
- Covanta Holding Corp.
- Wheelabrator Technologies Inc.
- Mitsubishi Heavy Industries Ltd
- Hitachi Zosen Corp.
- Babcock & Wilcox Enterprises Inc.
- A2A SpA
- MVV Energie AG
- Martin GmbH fur Umwelt- und Energietechnik
- China Everbright Environment Group Ltd
- China Jinjiang Environment Holding Co.
- Xcel Energy Inc.
- Shenzhen Energy Group Co.
- Keppel Seghers
- Remondis SE & Co. KG
- FCC Servicios Medio Ambiente
- Enerkem Inc.
- Sembcorp Industries Ltd
- Green Conversion Systems LLC
- Fortum Oyj
Additional Benefits:
- The market estimate (ME) sheet in Excel format
- 3 months of analyst support
TABLE OF CONTENTS
1 Introduction
- 1.1 Study Assumptions & Market Definition
- 1.2 Scope of the Study
2 Research Methodology
3 Executive Summary
4 Market Landscape
- 4.1 Market Overview
- 4.2 Market Drivers
- 4.2.1 Rapid roll-out of EfW public-private partnership pipelines in China's Greater Bay Area
- 4.2.2 EU Green Taxonomy incentives accelerating retrofit of legacy incineration fleets
- 4.2.3 National bans on unsegregated landfill triggering MSW diversion in India's Tier-2 cities
- 4.2.4 Soaring carbon credit prices improving WTE project IRRs in South Korea
- 4.2.5 Circular-economy led corporate power-purchase agreements (CPPAs) for biogas in Nordics
- 4.2.6 Mandatory calorific value thresholds for RDF exports in the UK post-Brexit
- 4.3 Market Restraints
- 4.3.1 Stricter dioxin emission caps postponing permits for grate-furnace refurbishments in Germany
- 4.3.2 Limited tipping-fee escalation clauses hurting project bankability in Indonesia
- 4.3.3 Anaerobic-digestion feedstock price volatility undermining margins in Brazil
- 4.3.4 Community push-back against plasma-arc facilities in Australia's peri-urban regions
- 4.4 Supply-Chain Analysis
- 4.5 Technological Outlook
- 4.6 Regulatory Outlook
- 4.7 Porter's Five Forces
- 4.7.1 Bargaining Power of Suppliers
- 4.7.2 Bargaining Power of Consumers
- 4.7.3 Threat of New Entrants
- 4.7.4 Threat of Substitutes
- 4.7.5 Intensity of Competitive Rivalry
- 4.8 Investment Analysis
5 Market Size & Growth Forecasts
- 5.1 By Technology
- 5.1.1 Physical (Refuse-Derived Fuel, Mechanical Biological Treatment)
- 5.1.2 Thermal (Incineration/Combustion, Gasification, Pyrolysis and Plasma-Arc)
- 5.1.3 Biological (Anaerobic Digestion, Fermentation)
- 5.2 By Waste Type
- 5.2.1 Municipal Solid Waste
- 5.2.2 Industrial Waste
- 5.2.3 Agricultural and Agro-industrial Residues
- 5.2.4 Sewage Sludge
- 5.2.5 Others (Commercial, Construction, Hazardous)
- 5.3 By Energy Output
- 5.3.1 Electricity
- 5.3.2 Heat
- 5.3.3 Combined Heat and Power (CHP)
- 5.3.4 Transportation Fuels (Bio-SNG, Bio-LNG, Ethanol)
- 5.4 By End-user
- 5.4.1 Utilities and Independent Power Producers (IPPs)
- 5.4.2 Industrial Captive Plants
- 5.4.3 District Heating Operators
- 5.4.4 Transport Fuel Distributors
- 5.5 By Geography
- 5.5.1 North America
- 5.5.1.1 United States
- 5.5.1.2 Canada
- 5.5.1.3 Mexico
- 5.5.2 Europe
- 5.5.2.1 United Kingdom
- 5.5.2.2 Germany
- 5.5.2.3 France
- 5.5.2.4 Spain
- 5.5.2.5 Nordic Countries
- 5.5.2.6 Russia
- 5.5.2.7 Rest of Europe
- 5.5.3 Asia-Pacific
- 5.5.3.1 China
- 5.5.3.2 India
- 5.5.3.3 Japan
- 5.5.3.4 South Korea
- 5.5.3.5 ASEAN Countries
- 5.5.3.6 Rest of Asia-Pacific
- 5.5.4 South America
- 5.5.4.1 Brazil
- 5.5.4.2 Argentina
- 5.5.4.3 Colombia
- 5.5.4.4 Rest of South America
- 5.5.5 Middle East and Africa
- 5.5.5.1 United Arab Emirates
- 5.5.5.2 Saudi Arabia
- 5.5.5.3 South Africa
- 5.5.5.4 Egypt
- 5.5.5.5 Rest of Middle East and Africa
- 5.5.1 North America
6 Competitive Landscape
- 6.1 Market Concentration
- 6.2 Strategic Moves (M&A, Partnerships, PPAs)
- 6.3 Market Share Analysis (Market Rank/Share for key companies)
- 6.4 Company Profiles (includes Global level Overview, Market level overview, Core Segments, Financials as available, Strategic Information, Products & Services, and Recent Developments)
- 6.4.1 Veolia Environnement SA
- 6.4.2 Suez SA
- 6.4.3 Waste Management Inc.
- 6.4.4 Covanta Holding Corp.
- 6.4.5 Wheelabrator Technologies Inc.
- 6.4.6 Mitsubishi Heavy Industries Ltd
- 6.4.7 Hitachi Zosen Corp.
- 6.4.8 Babcock & Wilcox Enterprises Inc.
- 6.4.9 A2A SpA
- 6.4.10 MVV Energie AG
- 6.4.11 Martin GmbH fur Umwelt- und Energietechnik
- 6.4.12 China Everbright Environment Group Ltd
- 6.4.13 China Jinjiang Environment Holding Co.
- 6.4.14 Xcel Energy Inc.
- 6.4.15 Shenzhen Energy Group Co.
- 6.4.16 Keppel Seghers
- 6.4.17 Remondis SE & Co. KG
- 6.4.18 FCC Servicios Medio Ambiente
- 6.4.19 Enerkem Inc.
- 6.4.20 Sembcorp Industries Ltd
- 6.4.21 Green Conversion Systems LLC
- 6.4.22 Fortum Oyj
7 Market Opportunities & Future Outlook
- 7.1 White-space & unmet-need assessment
